Journal List > J Korean Med Sci > v.39(3) > 1516085833

Jung, Lee, Kim, and Yang: Risk Factors and Trends in Adolescent’s Suicide Attempt Rates Before and After the Coronavirus Disease 2019 Pandemic

Abstract

Background

Understanding adolescents’ mental health during the coronavirus disease 2019 (COVID-19) pandemic and identifying those most at risk is an urgent public health challenge. This study explored the trend of suicide attempts and the association between loneliness, family financial stress, and suicide attempts during the COVID-19 pandemic among adolescents.

Methods

Data of the 2020 to 2022 Korea Youth Risk Behavior Surveys for adolescents aged 13–18 years were used. Multivariate logistic regression analyses were performed to examine the association between suicide attempts, family financial stress, and loneliness during the COVID-19 pandemic.

Results

The trend of suicide attempt rates was lowest in 2020 (1.9%, 1,034 out of 53,534) and it showed an increasing trend with rates of 2.2% (1,159 out of 53,445) in 2021 and 2.5% (1,271 out of 50,455) in 2022. The risk of suicide attempt was higher among adolescents who experienced financial stress (in 2020: adjusted odds ratio [AOR], 1.53, 95% confidence interval [CI], 1.26–1.88; in 2021: AOR, 1.63, 95% CI, 1.03–1.54) and felt lonely (in 2020: AOR, 2.19, 95% CI, 1.78–2.70; in 2021: AOR, 2.65, 95% CI, 2.16–3.26; in 2022: AOR, 1.3, 95% CI, 1.04–1.55) than those who did not.

Conclusion

The COVID-19 pandemic affected the suicide attempts of adolescents, with financial stress and feelings of loneliness closely linked to this impact. Although the pandemic nears its end, the persistent risk of suicide attempts among adolescents remains a concern. Therefore, it is imperative to implement targeted screening and interventions to address adolescent suicide risk.

Graphical Abstract

jkms-39-e32-abf001.jpg

INTRODUCTION

The coronavirus disease 2019 (COVID-19) pandemic has caused tremendous turmoil, with over 2 million deaths and hundreds of millions of individuals isolated worldwide.1 However, its impact on children and adolescents has been relatively minimal in terms of morbidity and mortality rates.2 Similar to the events observed during the outbreak of severe acute respiratory syndrome in 2003, quarantine measures during the COVID-19 pandemic have had adverse mental repercussions, such as increased incidence of depression and posttraumatic stress disorder.3 A survey of over 50,000 individuals in the United Kingdom revealed that the percentage of individuals suffering from mental stress rose from 19% in 2018 to 27% in April 2020, 1 month after the COVID-19 lockdown was enforced.4 The quarantine measures imposed during the COVID-19 pandemic posed a significant challenge to the mental health of children and adolescents as well.2
Adolescence is a vulnerable period in which individuals undergo significant transitions.56 Mental health issues are more common than physical issues during this period and can impact individuals’ mental health status into adulthood.7 During adolescence, individuals establish the direction of their behaviors and develop self-concept and self-worth based on their experiences of peer acceptance and rejection, highlighting the importance of peer interactions for mental health.8 The impact of the COVID-19 pandemic and subsequent lockdown measures on the mental health of young people has raised concerns. Children and adolescents were unable to attend school during quarantine, which potentially led to a decrease in social contact, loneliness, and increased reliance on the internet and social media. Some of them also experienced unstable home environments and exposure to domestic violence.259
The COVID-19 pandemic significantly affected the global economy as well, including an increase in the worldwide unemployment rate.10 Approximately 30 million people in the United States and 400 million people worldwide have lost their jobs in the ongoing economic recession.11 The children and adolescents who observed their parents experiencing anxiety regarding potential unemployment and helplessness related to physical distancing may have developed stress regarding their future prospects.3 The deteriorating economic conditions may also have triggered conflict within families, taking a toll on the mental health of children and adolescents through various pathways, including child abuse.7
Several studies have examined the mental health of children and adolescents during the COVID-19 pandemic, their findings are conflicting. Some studies indicated that families spending more time together during the COVID-19 crisis may have strengthened the sense of community and social support in some households, positively influencing the mental health of children.12 However, others revealed an increased adverse childhood experiences13 and risk of mental disorders, such as depression, anxiety, posttraumatic stress disorder, and addiction, among children and adolescents.5 It is clear that negative childhood events linked to poor mental health outcomes and an increased risk of suicide attempt.13 As the COVID-19 pandemic prolongs, there are also numerous studies indicating that suicide rates tend to increase in general population.14 Although the impact of the COVID-19 pandemic on the risk of suicide among vulnerable populations is of utmost importance, research on suicide risk in children and adolescents is lacking1415 and needs to include periods before, during, and after COVID-19. Additionally, studies that have addressed the suicide attempt risks among adolescents depending on financial stress or loneliness that are closely associated with COVID-19 pandemic are relatively rare. Therefore, this study examined the trends in the suicidal risk population before and after the COVID-19 pandemic and investigated the impact of COVID-19-related social isolation and financial stress on suicide attempts among adolescents.

METHODS

Data source and participants

We used raw data from the Korean Youth Risk Behavior Web-Based Survey (KYRBS),16 which is planned by the Korea Centers for Disease Control and Prevention (KCDC) of the Ministry of Health and Welfare and conducted by the Ministry of Education. The KYRBS aims to assess the health behaviors of Korean youth and generate health indicators for youth health promotion projects that enable international comparisons. Sixteen items, including smoking, alcohol consumption, diet, mental health, personal hygiene, and sexual behavior, are assessed in the KYRBS. Since 2005, the survey has been conducted every year among students from grades 7–12 in 800 sampled schools nationwide using a standardized, anonymous, self-administered online questionnaire in computer labs.16
In this study, KYRBS datasets16 from years 2020 (N = 54,948, response rate = 94.9%), 2021 (N = 54,848, response rate = 92.9%) and 2022 (N = 51,850, response rate = 92.2%) were analyzed.

Measures

The outcome variable used in this study was suicide attempt, which was measured by the question, “Have you attempted suicide in the past 12 months?” Respondents who answered “yes” to this question were categorized as having made a suicide attempt. The main explanatory variable was the experience of worsening household finances due to the COVID-19 pandemic and loneliness. The experience of financial stress was defined as responding with “strongly agree” to the question, “Do you think that the financial condition of your family has worsened due to the COVID-19 pandemic?”, among the response options: “strongly agree,” “somewhat agree,” “somewhat disagree,” and “strongly disagree.” Additionally, to assess loneliness, responding “sometimes,” “often,” or “always” among the responses (“never,” “almost never,” “sometimes,” “often,” and “always”) to the question, “How often have you felt lonely in the past 12 months” was defined as feeling loneliness. Demographic factors, such as age, sex, and city type were also considered. Age was treated as a continuous variable. The reference categories for sex and city type were defined as “male” and “countryside,” respectively. Furthermore, potential risk factors of suicide attempt identified in previous studies17 were included as control variables. Some binary variables, including experience of suicidal ideation, having a suicide plan, experience of smoking, alcohol, and drug intake, feeling sadness or hopelessness, physical activity, and experiences of asthma, allergic rhinitis, and atopic dermatitis, were considered. All of these factors are categorized by “yes” and “no.” As for other factors, grade level was ranged from 12th grade (G6) to 7th grade (G1). Academic achievement and family socioeconomic status were divided into 5 categories: “high,” “middle high,” “middle,” “low middle,” and “low.” Based on the body mass index (BMI), the participants were classified as underweight (< 18.5), normal (18.5–22.9), overweight (23–24.9), and obese (≥ 25). Moreover, all the following parameters were recorded with 5 response options: stress (very low, low, middle, high, and very high), sleep (very high, high, middle, low, and very low), self-rated health (very good, good, normal, poor, and very poor), and the perceived body image (normal, very thin, thin, fat, and very fat). Questionnaires with missing responses to any 1 of the items were excluded from the analyses.

Statistical analyses

We conducted a frequency analysis to assess data on demographic factors including age, sex, and city type; outcome variables, suicide attempt; and other variables, such as financial stress and feeling of loneliness. Univariate logistic regression was performed to assess the association of the variables with suicide attempts. Subsequently, a multivariate logistic regression analysis was conducted to examine the influence of financial stress and feeling of loneliness on suicide attempts, while considering the effects of other variables. Confidence intervals (CIs) were set at 95%, and statistical significance was set at P < 0.05 in both the univariate and multivariate logistic regression analyses. All statistical analyses were performed using the Statistical Package for the Social Sciences for Windows, version 21.0 (IBM Corp., Armonk, NY, USA).

Ethics statement

The raw data was approved by the KCDC Institutional Review Board (certification number: 117058) and obtained in accordance with the KCDC regulations for the management and disclosure of raw data. Due to the study design, the KCDC Institutional Review Board waived the requirement to obtain informed consent.

RESULTS

Table 1 shows the general distribution of the study variables. As shown in Table 1, the sex ratio of the participants was similar, with 51.7% male participants in 2020, 52.0% in 2021 and 51.0% in 2022. A total of 3,072 (5.7%) adolescents in 2020 and 3,026 (5.7%) in 2021 reported a family financial stress due to the COVID-19 pandemic, while in 2022 the survey did not include questionnaires pertaining to family financial stress due to the COVID-19 pandemic, we were unable to examine this aspect. The 25,949 (48.5%) adolescents in 2020, 27,709 (51.8%) in 2021 and 27,440 (54.4%) in 2022 experienced loneliness in the prior 12 months.
Table 1

Baseline characteristics of demographic and psychological variables in the 2020–2022 Korean Youth Risk Behavior Web-Based Survey data

jkms-39-e32-i001
Variables No. (%)
2020 2021 2022
Outcome variable
Suicide attempt
No 52,500 (98.1) 52,286 (97.8) 49,182 (97.5)
Yes 1,034 (1.9) 1,159 (2.2) 1,271 (2.5)
Main explanatory variable
Financial stress during COVID-19
No 50,462 (94.3) 50,419 (94.3) -
Yes 3,072 (5.7) 3,026 (5.7) -
Loneliness
Very low 13,303 (24.8) 11,630 (21.8) 11,007 (21.8)
Low 14,282 (26.7) 14,106 (26.4) 12,006 (23.8)
Middle 18,449 (34.5) 19,283 (36.1) 18,614 (36.9)
High 5,973 (11.2) 6,720 (12.6) 6,912 (13.7)
Very high 1,527 (2.9) 1,706 (3.2) 1,914 (3.8)
Control variables
Suicidal ideation
No 47,802 (89.3) 46,776 (87.5) 43,412 (86.0)
Yes 5,732 (10.7) 6,669 (12.5) 7,041 (14.0)
Suicide plan
No 51,695 (96.6) 51,389 (96.2) 48,265 (95.7)
Yes 1,839 (3.4) 2,056 (3.8) 2,188 (4.3)
Sex
Male 27,687 (51.7) 27,773 (52.0) 25,749 (51.0)
Female 25,847 (48.3) 25,672 (48.0) 24,704 (49.0)
Age (grade)
13 (G1) 9,800 (18.9) 9,802 (18.3) 9,039 (17.9)
14 (G2) 9,331 (17.4) 10,009 (18.7) 9,098 (18.0)
15 (G3) 9,161 (17.1) 9,508 (17.8) 9,173 (18.2)
16 (G4) 8,687 (16.2) 8,266 (15.5) 8,233 (16.3)
17 (G5) 8,669 (16.2) 8,398 (15.7) 7,767 (15.4)
18 (G6) 7,886 (14.7) 7,462 (14.0) 7,143 (14.2)
City type
Big city 23,058 (43.1) 23,340 (43.7) 25,108 (49.8)
Medium small city 26,284 (49.1) 26,117 (48.9) 21,669 (42.9)
Countryside 4,192 (7.8) 3,988 (7.5) 3,676 (7.3)
Academic achievement
High 6,572 (12.3) 6,883 (12.9) 6,739 (13.4)
High middle 13,195 (24.6) 13,227 (24.7) 12,887 (25.5)
Middle 16,241 (30.3) 16,530 (30.9) 15,160 (30.0)
Low middle 12,287 (23.0) 11,662 (21.8) 11,015 (21.8)
Low 5,239 (9.8) 5,143 (9.6) 4,652 (9.2)
Family SES
Low 1,177 (2.2) 1,022 (1.9) 906 (1.8)
Low middle 5,724 (10.7) 4,890 (9.1) 4,627 (9.2)
Middle 25,738 (48.1) 26,438 (49.5) 23,575 (46.7)
High middle 15,033 (28.1) 15,352 (28.7) 15,598 (30.9)
High 5,862 (11.0) 5,743 (10.7) 5,747 (11.4)
Alcohol experience
No 35,744 (66.8) 36,045 (67.4) 33,380 (66.2)
Yes 17,790 (33.2) 17,400 (32.6) 17,073 (33.8)
Smoking experience
No 47,683 (89.1) 47,718 (89.3) 45,423 (90.0)
Yes 5,851 (10.9) 5,727 (10.7) 5,030 (10.0)
Drug experience
No 53,165 (99.3) 53,091 (99.3) -
Yes 369 (0.7) 354 (0.7) -
Body mass index
Optimal 25,849 (48.3) 25,234 (47.2) 23,828 (47.2)
Underweight 11,164 (20.9) 11,509 (21.5) 11,905 (23.6)
Overweight 7,251 (13.5) 6,926 (13.0) 6,242 (12.4)
Obese 9,270 (17.3) 9,776 (18.3) 8,474 (16.8)
(Feelings of) sadness or hopelessness
No 40,138 (75.0) 39,219 (73.4) 35,961 (71.3)
Yes 13,396 (25.0) 14,226 (26.6) 14,492 (28.7)
Stress
Very low 1,950 (3.6) 1,748 (3.3) 1,426 (2.8)
Low 9,697 (18.1) 8,425 (15.8) 7,140 (14.2)
Middle 23,842 (44.5) 22,733 (42.5) 21,191 (42.0)
High 13,666 (25.5) 14,815 (27.7) 14,661 (29.1)
Very high 4,379 (8.2) 5,724 (10.7) 6,035 (12.0)
Sleep
Very high 5,413 (10.1) 3,557 (6.7) 3,403 (6.7)
High 10,983 (20.5) 8,935 (16.7) 7,902 (15.7)
Middle 18,195 (34.0) 17,461 (32.7) 16,266 (32.2)
Low 13,179 (24.6) 16,034 (30.0) 14,973 (29.7)
Very low 5,764 (10.8) 7,458 (14.0) 7,909 (15.7)
Self-rated health
Very good 14,584 (27.7) 11,968 (22.4) 10,318 (20.5)
Good 22,848 (42.7) 22,928 (42.9) 21,913 (43.4)
Normal 11,927 (22.3) 13,837 (25.9) 13,142 (26.0)
Poor 3,689 (6.9) 4,448 (8.3) 4,765 (9.4)
Very poor 216 (0.4) 264 (0.5) 310 (0.6)
Perceived body image
Very thin 2,231 (4.2) 2,384 (4.5) 2,486 (4.9)
Thin 10,950 (20.5) 11,303 (21.1) 11,019 (21.8)
Normal 19,697 (36.8) 19,363 (36.2) 18,406 (36.5)
Fat 17,539 (32.8) 17,201 (32.2) 15,553 (30.8)
Very fat 3,117 (5.8) 3,194 (6.0) 2,989 (5.9)
Physical activity
Active 32,986 (61.6) 35,677 (66.8) 33,787 (67.0)
Inactive 20,548 (38.4) 17,768 (33.2) 16,666 (33.0)
Asthma
No 50,295 (93.9) 50,463 (94.4) 47,692 (94.5)
Yes 3,239 (6.1) 2,981 (5.6) 2,761 (5.5)
Allergic rhinitis
No 35,356 (66.0) 35,010 (65.5) 32,569 (64.6)
Yes 18,178 (34.0) 18,435 (34.5) 17,884 (35.4)
Atopic dermatitis
No 41,205 (77.0) 41,573 (77.8) 39,384 (78.1)
Yes 12,329 (23.0) 11,872 (22.2) 11,069 (21.9)
COVID-19 = coronavirus disease 2019, G = grade, SES = socioeconomic status.
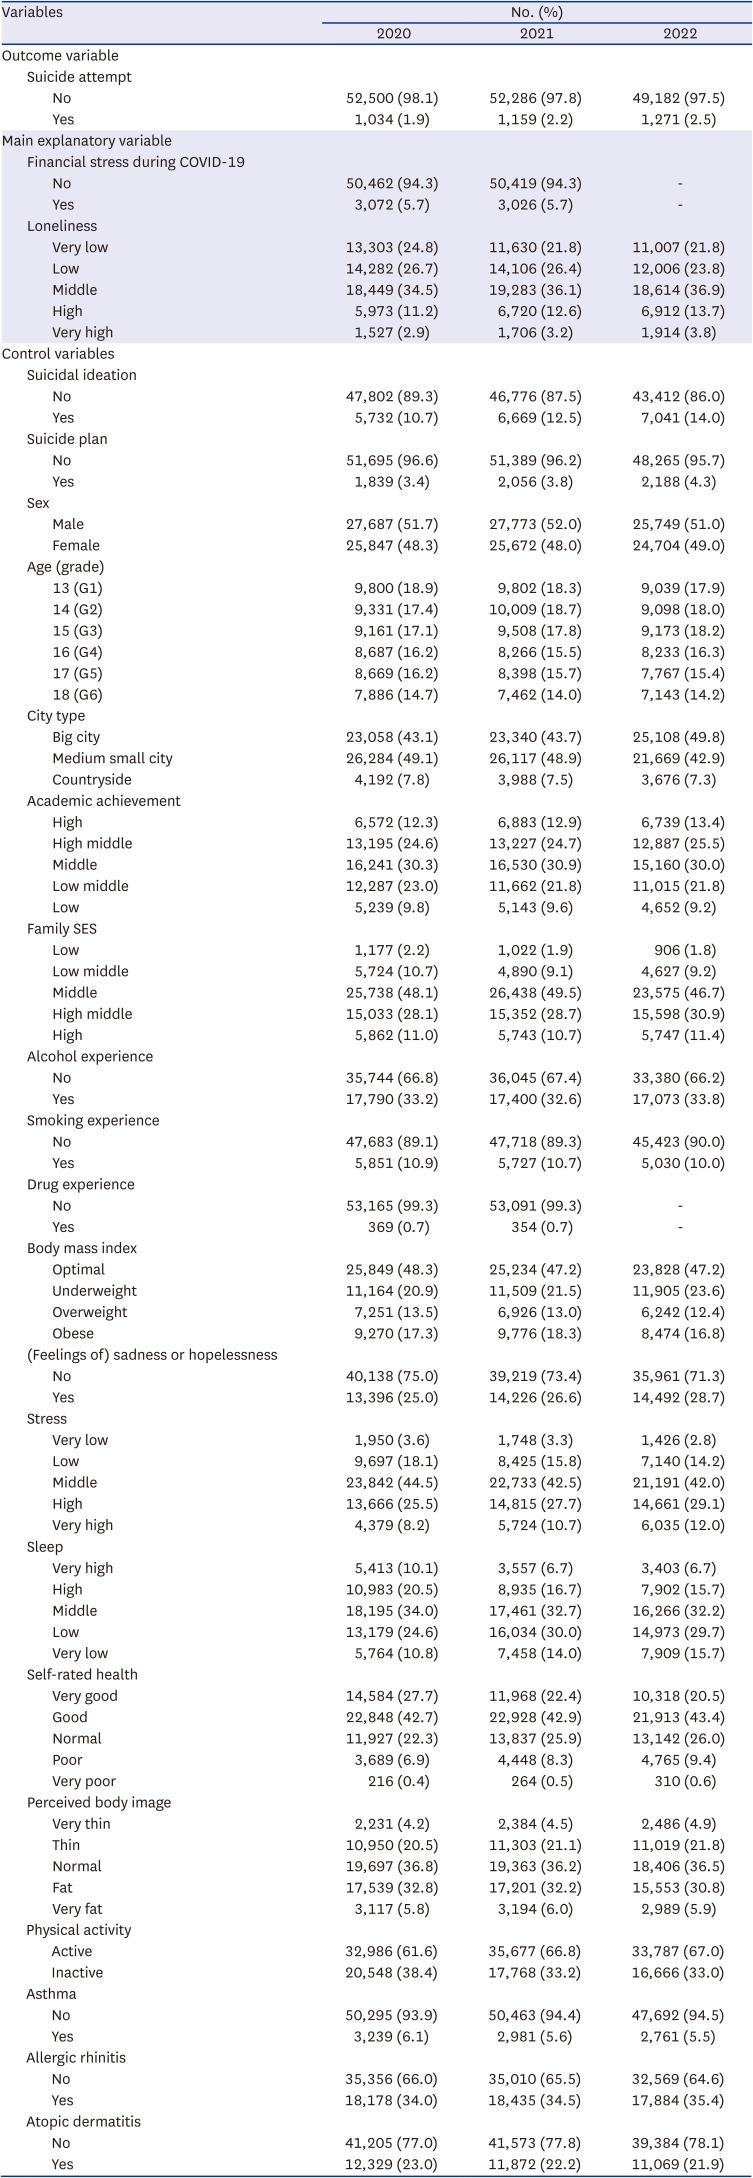
Approximately one-third of the adolescents (33.2% in 2020, 32.6% in 2021 and 33.8% in 2022) reported drinking alcohol, and approximately 10% reported trying cigarettes or e-cigarettes (10.9% in 2020, 10.7% in 2021 and 10.0% in 2021). Similarly, in both 2020 and 2021, 0.7% adolescents reported using drugs habitually other than for therapeutic purposes. However, due to limited access to the data for habitual use of drugs in 2022, we were unable to perform an analysis. Less than half of the adolescents (48.2% in 2020, 47.2% in 2021 and 47.2% in 2022) maintained a healthy BMI, while approximately 36% of them felt that they had an average body shape (36.8% in 2020, 36.2% in 2021 and 36.5% in 2021, respectively).
One-fourth of adolescents reported feeling sad or hopeless to the extent that their daily lives were disrupted for 2 consecutive weeks within the past 12 months (25% and 26.6% in 2020 and 2021, respectively), which increased to 28.7% in 2022. The rates of experiencing significant stress in their daily lives also showed a steady increase, reaching 33.7% in 2020, 38.4% in 2021, and 41.0% in 2022. However, the rates of feeling sufficiently rested during sleep demonstrated a consistent decrease, dropping to 30.6% in 2020, 27.4% in 2021, and 22.4% in 2022. Lastly, the rates of participants reporting feeling unhealthy were 7.3%, 8.8%, and 10.0% in 2020, 2021, and 2022, respectively, while in those same years, 38.4%, 33.2%, and 33.0% of the participants did not engage in physical activity that increases the heart rate above normal levels or causes shortness of breath for at least 60 minutes a day on at least 1 day within the past 7 days.

Suicide attempt

As shown in Table 1, when comparing the years 2020, 2021, and 2022, the rates of suicidal ideation were 10.7%, 12.5% and 14.0% respectively, which means there was an increase of 1.8% in 2021 and an additional 1.5% increase in 2022.
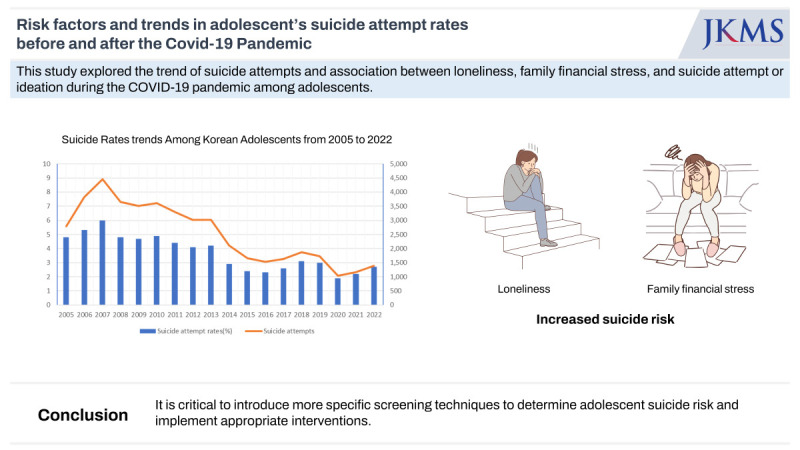
The annual suicide attempt rates and the number of suicide attempts among adolescents were depicted in Fig. 1. The rates showed an increasing trend from 2005 to 2007, reaching a peak of 5.8% in 2007. In 2005, the rate was 4.6% (2,622 out of 56,511), while in 2006 it was 5.2% (3,602 out of 69,497), and in 2007 it was 5.8% (4,148 out of 72,133). Subsequently, there was a slight decline in the rates from 2008 to 2011, ranging from 4.2% to 4.7%. In 2008, the rate was 4.7% (3,388 out of 72,703), in 2009 it was 4.5% (3,243 out of 72,399), in 2010 it was 4.7% (3,331 out of 70,809), and in 2011 it was 4.2% (3,055 out of 73,474). Following this, there was a further decrease in the rates from 2012 to 2016, reaching a low of 2.1% in 2016. In 2012, the rate was 3.9% (2,785 out of 72,229), in 2013 it was 3.9% (2,769 out of 70,354), in 2014 it was 2.7% (1,892 out of 69,959), in 2015 it was 2.2% (1,467 out of 66,068), and in 2016 it was 2.1% (1,369 out of 63,741). However, there was a slight increase in rates from 2016 to 2019, ranging from 2.1% to 2.9%, followed by a decline in 2019 and 2020. In 2017, the rate was 2.4% (1,445 out of 60,392), in 2018 it was 2.9% (1,697 out of 58,336), in 2019 it was 2.8% (1,545 out of 55,748), and in 2020 it was 1.9% (1,034 out of 53,534). In recent years, there has been a slight increase in rates, with 2.2% (1,159 out of 53,445) in 2021 and 2.5% (1,271 out of 50,455) in 2022. This indicates that the rates of suicide attempt increased by approximately 15.8% from 2020 to 2021 and by approximately 31.6% from 2020 to 2022.
Fig. 1

Suicide attempt rates trends among Korean adolescents from 2005 to 2022. This figure shows the annual suicide attempt rates among adolescents as well as the number of suicide attempts year-wise. The graph provides an overview of the trends and patterns in suicide attempt rates within adolescents over a specific period. The x-axis represents the years, while the y-axis represents the suicide attempt rates (left) and number of suicide attempts (right). The graph aims to highlight notable changes, fluctuations, or patterns in suicide attempt rates among adolescents over time.

jkms-39-e32-g001
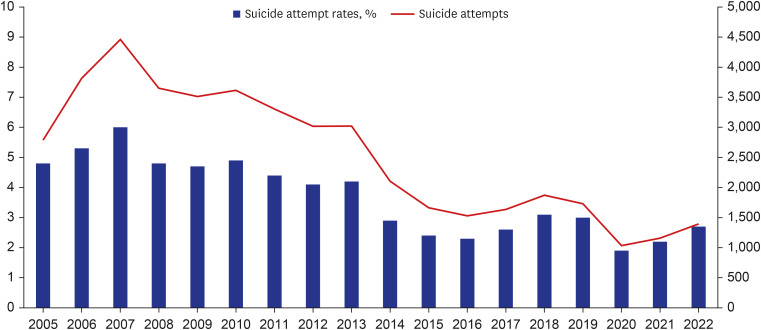
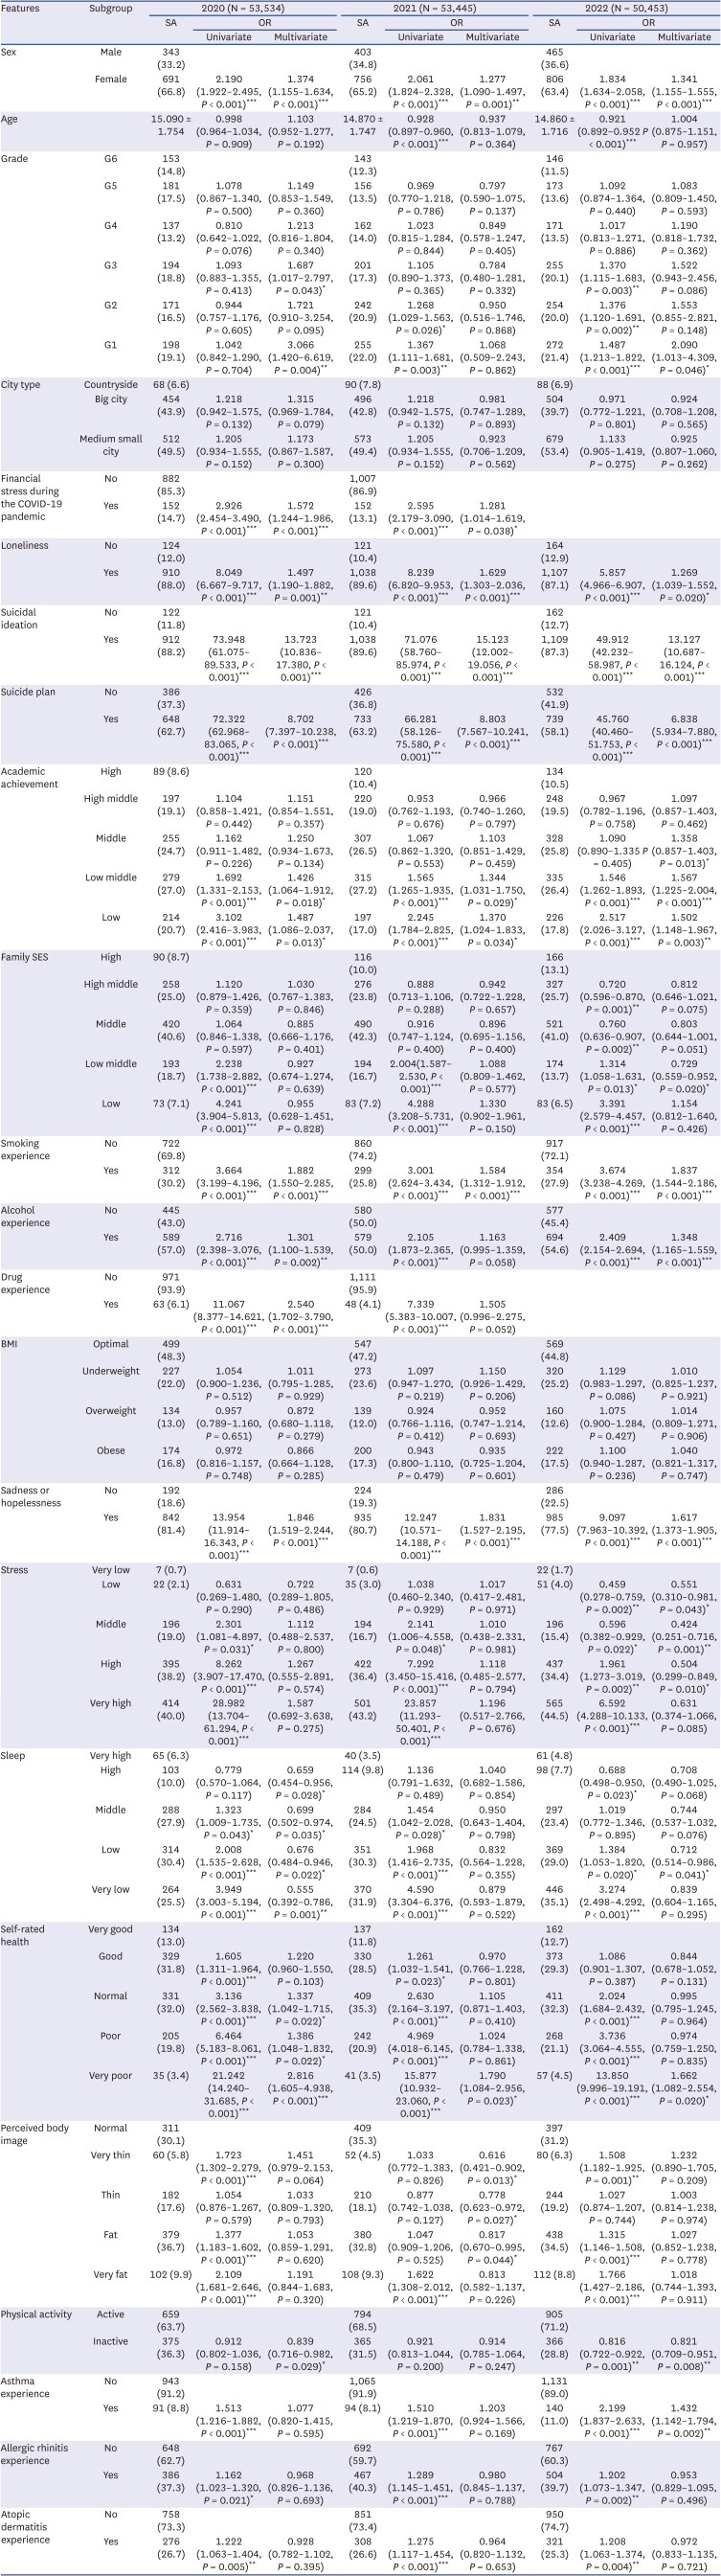
Table 2 shows the multivariate associations between the variables and suicide attempts. Data from 2020 and 2022 were analyzed separately. In the multivariate logistic regression model that controlled for other factors, the risk of suicide attempt was 1.6 times higher in 2020 and 1.3 times higher in 2021 among adolescents who reported a family financial stress due to the COVID-19 pandemic than among those who did not (in 2020: 95% CI, 1.256–1.882, P < 0.001; in 2021: 95% CI, 1.033–1.543, P = 0.023). The risk of suicide attempt was 1.5 times higher in 2020, 1.6 times higher in 2021 and 1.3 times higher in 2022 among adolescents who had felt lonely in the past 12 months than among those who did not (in 2020: 95% CI, 1.786–2.705, P < 0.001; in 2021: 95% CI, 2.159–3.260, P < 0.001; in 2022: 95% CI, 1.039–1.552, P = 0.020).
Table 2

Logistic regression analysis results for assessing the risk of suicide attempt

jkms-39-e32-i002
Features Subgroup 2020 (N = 53,534) 2021 (N = 53,445) 2022 (N = 50,453)
SA OR SA OR SA OR
Univariate Multivariate Univariate Multivariate Univariate Multivariate
Sex Male 343 (33.2) 403 (34.8) 465 (36.6)
Female 691 (66.8) 2.190 (1.922–2.495, P < 0.001)*** 1.374 (1.155–1.634, P < 0.001)*** 756 (65.2) 2.061 (1.824–2.328, P < 0.001)*** 1.277 (1.090–1.497, P = 0.001)** 806 (63.4) 1.834 (1.634–2.058, P < 0.001)*** 1.341 (1.155–1.555, P < 0.001)***
Age 15.090 ± 1.754 0.998 (0.964–1.034, P = 0.909) 1.103 (0.952–1.277, P = 0.192) 14.870 ± 1.747 0.928 (0.897–0.960, P < 0.001)*** 0.937 (0.813–1.079, P = 0.364) 14.860 ± 1.716 0.921 (0.892–0.952 P < 0.001)*** 1.004 (0.875–1.151, P = 0.957)
Grade G6 153 (14.8) 143 (12.3) 146 (11.5)
G5 181 (17.5) 1.078 (0.867–1.340, P = 0.500) 1.149 (0.853–1.549, P = 0.360) 156 (13.5) 0.969 (0.770–1.218, P = 0.786) 0.797 (0.590–1.075, P = 0.137) 173 (13.6) 1.092 (0.874–1.364, P = 0.440) 1.083 (0.809–1.450, P = 0.593)
G4 137 (13.2) 0.810 (0.642–1.022, P = 0.076) 1.213 (0.816–1.804, P = 0.340) 162 (14.0) 1.023 (0.815–1.284, P = 0.844) 0.849 (0.578–1.247, P = 0.405) 171 (13.5) 1.017 (0.813–1.271, P = 0.886) 1.190 (0.818–1.732, P = 0.362)
G3 194 (18.8) 1.093 (0.883–1.355, P = 0.413) 1.687 (1.017–2.797, P = 0.043)* 201 (17.3) 1.105 (0.890–1.373, P = 0.365) 0.784 (0.480–1.281, P = 0.332) 255 (20.1) 1.370 (1.115–1.683, P = 0.003)** 1.522 (0.943–2.456, P = 0.086)
G2 171 (16.5) 0.944 (0.757–1.176, P = 0.605) 1.721 (0.910–3.254, P = 0.095) 242 (20.9) 1.268 (1.029–1.563, P = 0.026)* 0.950 (0.516–1.746, P = 0.868) 254 (20.0) 1.376 (1.120–1.691, P = 0.002)** 1.553 (0.855–2.821, P = 0.148)
G1 198 (19.1) 1.042 (0.842–1.290, P = 0.704) 3.066 (1.420–6.619, P = 0.004)** 255 (22.0) 1.367 (1.111–1.681, P = 0.003)** 1.068 (0.509–2.243, P = 0.862) 272 (21.4) 1.487 (1.213–1.822, P < 0.001)*** 2.090 (1.013–4.309, P = 0.046)*
City type Countryside 68 (6.6) 90 (7.8) 88 (6.9)
Big city 454 (43.9) 1.218 (0.942–1.575, P = 0.132) 1.315 (0.969–1.784, P = 0.079) 496 (42.8) 1.218 (0.942–1.575, P = 0.132) 0.981 (0.747–1.289, P = 0.893) 504 (39.7) 0.971 (0.772–1.221, P = 0.801) 0.924 (0.708–1.208, P = 0.565)
Medium small city 512 (49.5) 1.205 (0.934–1.555, P = 0.152) 1.173 (0.867–1.587, P = 0.300) 573 (49.4) 1.205 (0.934–1.555, P = 0.152) 0.923 (0.706–1.209, P = 0.562) 679 (53.4) 1.133 (0.905–1.419, P = 0.275) 0.925 (0.807–1.060, P = 0.262)
Financial stress during the COVID-19 pandemic No 882 (85.3) 1,007 (86.9)
Yes 152 (14.7) 2.926 (2.454–3.490, P < 0.001)*** 1.572 (1.244–1.986, P < 0.001)*** 152 (13.1) 2.595 (2.179–3.090, P < 0.001)*** 1.281 (1.014–1.619, P = 0.038)*
Loneliness No 124 (12.0) 121 (10.4) 164 (12.9)
Yes 910 (88.0) 8.049 (6.667–9.717, P < 0.001)*** 1.497 (1.190–1.882, P = 0.001)** 1,038 (89.6) 8.239 (6.820–9.953, P < 0.001)*** 1.629 (1.303–2.036, P < 0.001)*** 1,107 (87.1) 5.857 (4.966–6.907, P < 0.001)*** 1.269 (1.039–1.552, P = 0.020)*
Suicidal ideation No 122 (11.8) 121 (10.4) 162 (12.7)
Yes 912 (88.2) 73.948 (61.075–89.533, P < 0.001)*** 13.723 (10.836–17.380, P < 0.001)*** 1,038 (89.6) 71.076 (58.760–85.974, P < 0.001)*** 15.123 (12.002–19.056, P < 0.001)*** 1,109 (87.3) 49.912 (42.232–58.987, P < 0.001)*** 13.127 (10.687–16.124, P < 0.001)***
Suicide plan No 386 (37.3) 426 (36.8) 532 (41.9)
Yes 648 (62.7) 72.322 (62.968–83.065, P < 0.001)*** 8.702 (7.397–10.238, P < 0.001)*** 733 (63.2) 66.281 (58.126–75.580, P < 0.001)*** 8.803 (7.567–10.241, P < 0.001)*** 739 (58.1) 45.760 (40.460–51.753, P < 0.001)*** 6.838 (5.934–7.880, P < 0.001)***
Academic achievement High 89 (8.6) 120 (10.4) 134 (10.5)
High middle 197 (19.1) 1.104 (0.858–1.421, P = 0.442) 1.151 (0.854–1.551, P = 0.357) 220 (19.0) 0.953 (0.762–1.193, P = 0.676) 0.966 (0.740–1.260, P = 0.797) 248 (19.5) 0.967 (0.782–1.196, P = 0.758) 1.097 (0.857–1.403, P = 0.462)
Middle 255 (24.7) 1.162 (0.911–1.482, P = 0.226) 1.250 (0.934–1.673, P = 0.134) 307 (26.5) 1.067 (0.862–1.320, P = 0.553) 1.103 (0.851–1.429, P = 0.459) 328 (25.8) 1.090 (0.890–1.335 P = 0.405) 1.358 (0.857–1.403, P = 0.013)*
Low middle 279 (27.0) 1.692 (1.331–2.153, P < 0.001)*** 1.426 (1.064–1.912, P = 0.018)* 315 (27.2) 1.565 (1.265–1.935, P < 0.001)*** 1.344 (1.031–1.750, P = 0.029)* 335 (26.4) 1.546 (1.262–1.893, P < 0.001)*** 1.567 (1.225–2.004, P < 0.001)***
Low 214 (20.7) 3.102 (2.416–3.983, P < 0.001)*** 1.487 (1.086–2.037, P = 0.013)* 197 (17.0) 2.245 (1.784–2.825, P < 0.001)*** 1.370 (1.024–1.833, P = 0.034)* 226 (17.8) 2.517 (2.026–3.127, P < 0.001)*** 1.502 (1.148–1.967, P = 0.003)**
Family SES High 90 (8.7) 116 (10.0) 166 (13.1)
High middle 258 (25.0) 1.120 (0.879–1.426, P = 0.359) 1.030 (0.767–1.383, P = 0.846) 276 (23.8) 0.888 (0.713–1.106, P = 0.288) 0.942 (0.722–1.228, P = 0.657) 327 (25.7) 0.720 (0.596–0.870, P = 0.001)** 0.812 (0.646–1.021, P = 0.075)
Middle 420 (40.6) 1.064 (0.846–1.338, P = 0.597) 0.885 (0.666–1.176, P = 0.401) 490 (42.3) 0.916 (0.747–1.124, P = 0.400) 0.896 (0.695–1.156, P = 0.400) 521 (41.0) 0.760 (0.636–0.907, P = 0.002)** 0.803 (0.644–1.001, P = 0.051)
Low middle 193 (18.7) 2.238 (1.738–2.882, P < 0.001)*** 0.927 (0.674–1.274, P = 0.639) 194 (16.7) 2.004(1.587–2.530, P < 0.001)*** 1.088 (0.809–1.462, P = 0.577) 174 (13.7) 1.314 (1.058–1.631, P = 0.013)* 0.729 (0.559–0.952, P = 0.020)*
Low 73 (7.1) 4.241 (3.904–5.813, P < 0.001)*** 0.955 (0.628–1.451, P = 0.828) 83 (7.2) 4.288 (3.208–5.731, P < 0.001)*** 1.330 (0.902–1.961, P = 0.150) 83 (6.5) 3.391 (2.579–4.457, P < 0.001)*** 1.154 (0.812–1.640, P = 0.426)
Smoking experience No 722 (69.8) 860 (74.2) 917 (72.1)
Yes 312 (30.2) 3.664 (3.199–4.196, P < 0.001)*** 1.882 (1.550–2.285, P < 0.001)*** 299 (25.8) 3.001 (2.624–3.434, P < 0.001)*** 1.584 (1.312–1.912, P < 0.001)*** 354 (27.9) 3.674 (3.238–4.269, P < 0.001)*** 1.837 (1.544–2.186, P < 0.001)***
Alcohol experience No 445 (43.0) 580 (50.0) 577 (45.4)
Yes 589 (57.0) 2.716 (2.398–3.076, P < 0.001)*** 1.301 (1.100–1.539, P = 0.002)** 579 (50.0) 2.105 (1.873–2.365, P < 0.001)*** 1.163 (0.995–1.359, P = 0.058) 694 (54.6) 2.409 (2.154–2.694, P < 0.001)*** 1.348 (1.165–1.559, P < 0.001)***
Drug experience No 971 (93.9) 1,111 (95.9)
Yes 63 (6.1) 11.067 (8.377–14.621, P < 0.001)*** 2.540 (1.702–3.790, P < 0.001)*** 48 (4.1) 7.339 (5.383–10.007, P < 0.001)*** 1.505 (0.996–2.275, P = 0.052)
BMI Optimal 499 (48.3) 547 (47.2) 569 (44.8)
Underweight 227 (22.0) 1.054 (0.900–1.236, P = 0.512) 1.011 (0.795–1.285, P = 0.929) 273 (23.6) 1.097 (0.947–1.270, P = 0.219) 1.150 (0.926–1.429, P = 0.206) 320 (25.2) 1.129 (0.983–1.297, P = 0.086) 1.010 (0.825–1.237, P = 0.921)
Overweight 134 (13.0) 0.957 (0.789–1.160, P = 0.651) 0.872 (0.680–1.118, P = 0.279) 139 (12.0) 0.924 (0.766–1.116, P = 0.412) 0.952 (0.747–1.214, P = 0.693) 160 (12.6) 1.075 (0.900–1.284, P = 0.427) 1.014 (0.809–1.271, P = 0.906)
Obese 174 (16.8) 0.972 (0.816–1.157, P = 0.748) 0.866 (0.664–1.128, P = 0.285) 200 (17.3) 0.943 (0.800–1.110, P = 0.479) 0.935 (0.725–1.204, P = 0.601) 222 (17.5) 1.100 (0.940–1.287, P = 0.236) 1.040 (0.821–1.317, P = 0.747)
Sadness or hopelessness No 192 (18.6) 224 (19.3) 286 (22.5)
Yes 842 (81.4) 13.954 (11.914–16.343, P < 0.001)*** 1.846 (1.519–2.244, P < 0.001)*** 935 (80.7) 12.247 (10.571–14.188, P < 0.001)*** 1.831 (1.527–2.195, P < 0.001)*** 985 (77.5) 9.097 (7.963–10.392, P < 0.001)*** 1.617 (1.373–1.905, P < 0.001)***
Stress Very low 7 (0.7) 7 (0.6) 22 (1.7)
Low 22 (2.1) 0.631 (0.269–1.480, P = 0.290) 0.722 (0.289–1.805, P = 0.486) 35 (3.0) 1.038 (0.460–2.340, P = 0.929) 1.017 (0.417–2.481, P = 0.971) 51 (4.0) 0.459 (0.278–0.759, P = 0.002)** 0.551 (0.310–0.981, P = 0.043)*
Middle 196 (19.0) 2.301 (1.081–4.897, P = 0.031)* 1.112 (0.488–2.537, P = 0.800) 194 (16.7) 2.141 (1.006–4.558, P = 0.048)* 1.010 (0.438–2.331, P = 0.981) 196 (15.4) 0.596 (0.382–0.929, P = 0.022)* 0.424 (0.251–0.716, P = 0.001)**
High 395 (38.2) 8.262 (3.907–17.470, P < 0.001)*** 1.267 (0.555–2.891, P = 0.574) 422 (36.4) 7.292 (3.450–15.416, P < 0.001)*** 1.118 (0.485–2.577, P = 0.794) 437 (34.4) 1.961 (1.273–3.019, P = 0.002)** 0.504 (0.299–0.849, P = 0.010)*
Very high 414 (40.0) 28.982 (13.704–61.294, P < 0.001)*** 1.587 (0.692–3.638, P = 0.275) 501 (43.2) 23.857 (11.293–50.401, P < 0.001)*** 1.196 (0.517–2.766, P = 0.676) 565 (44.5) 6.592 (4.288–10.133, P < 0.001)*** 0.631 (0.374–1.066, P = 0.085)
Sleep Very high 65 (6.3) 40 (3.5) 61 (4.8)
High 103 (10.0) 0.779 (0.570–1.064, P = 0.117) 0.659 (0.454–0.956, P = 0.028)* 114 (9.8) 1.136 (0.791–1.632, P = 0.489) 1.040 (0.682–1.586, P = 0.854) 98 (7.7) 0.688 (0.498–0.950, P = 0.023)* 0.708 (0.490–1.025, P = 0.068)
Middle 288 (27.9) 1.323 (1.009–1.735, P = 0.043)* 0.699 (0.502–0.974, P = 0.035)* 284 (24.5) 1.454 (1.042–2.028, P = 0.028)* 0.950 (0.643–1.404, P = 0.798) 297 (23.4) 1.019 (0.772–1.346, P = 0.895) 0.744 (0.537–1.032, P = 0.076)
Low 314 (30.4) 2.008 (1.535–2.628, P < 0.001)*** 0.676 (0.484–0.946, P = 0.022)* 351 (30.3) 1.968 (1.416–2.735, P < 0.001)*** 0.832 (0.564–1.228, P = 0.355) 369 (29.0) 1.384 (1.053–1.820, P = 0.020)* 0.712 (0.514–0.986, P = 0.041)*
Very low 264 (25.5) 3.949 (3.003–5.194, P < 0.001)*** 0.555 (0.392–0.786, P = 0.001)** 370 (31.9) 4.590 (3.304–6.376, P < 0.001)*** 0.879 (0.593–1.879, P = 0.522) 446 (35.1) 3.274 (2.498–4.292, P < 0.001)*** 0.839 (0.604–1.165, P = 0.295)
Self-rated health Very good 134 (13.0) 137 (11.8) 162 (12.7)
Good 329 (31.8) 1.605 (1.311–1.964, P < 0.001)*** 1.220 (0.960–1.550, P = 0.103) 330 (28.5) 1.261 (1.032–1.541, P = 0.023)* 0.970 (0.766–1.228, P = 0.801) 373 (29.3) 1.086 (0.901–1.307, P = 0.387) 0.844 (0.678–1.052, P = 0.131)
Normal 331 (32.0) 3.136 (2.562–3.838, P < 0.001)*** 1.337 (1.042–1.715, P = 0.022)* 409 (35.3) 2.630 (2.164–3.197, P < 0.001)*** 1.105 (0.871–1.403, P = 0.410) 411 (32.3) 2.024 (1.684–2.432, P < 0.001)*** 0.995 (0.795–1.245, P = 0.964)
Poor 205 (19.8) 6.464 (5.183–8.061, P < 0.001)*** 1.386 (1.048–1.832, P = 0.022)* 242 (20.9) 4.969 (4.018–6.145, P < 0.001)*** 1.024 (0.784–1.338, P = 0.861) 268 (21.1) 3.736 (3.064–4.555, P < 0.001)*** 0.974 (0.759–1.250, P = 0.835)
Very poor 35 (3.4) 21.242 (14.240–31.685, P < 0.001)*** 2.816 (1.605–4.938, P < 0.001)*** 41 (3.5) 15.877 (10.932–23.060, P < 0.001)*** 1.790 (1.084–2.956, P = 0.023)* 57 (4.5) 13.850 (9.996–19.191, P < 0.001)*** 1.662 (1.082–2.554, P = 0.020)*
Perceived body image Normal 311 (30.1) 409 (35.3) 397 (31.2)
Very thin 60 (5.8) 1.723 (1.302–2.279, P < 0.001)*** 1.451 (0.979–2.153, P = 0.064) 52 (4.5) 1.033 (0.772–1.383, P = 0.826) 0.616 (0.421–0.902, P = 0.013)* 80 (6.3) 1.508 (1.182–1.925, P = 0.001)** 1.232 (0.890–1.705, P = 0.209)
Thin 182 (17.6) 1.054 (0.876–1.267, P = 0.579) 1.033 (0.809–1.320, P = 0.793) 210 (18.1) 0.877 (0.742–1.038, P = 0.127) 0.778 (0.623–0.972, P = 0.027)* 244 (19.2) 1.027 (0.874–1.207, P = 0.744) 1.003 (0.814–1.238, P = 0.974)
Fat 379 (36.7) 1.377 (1.183–1.602, P < 0.001)*** 1.053 (0.859–1.291, P = 0.620) 380 (32.8) 1.047 (0.909–1.206, P = 0.525) 0.817 (0.670–0.995, P = 0.044)* 438 (34.5) 1.315 (1.146–1.508, P < 0.001)*** 1.027 (0.852–1.238, P = 0.778)
Very fat 102 (9.9) 2.109 (1.681–2.646, P < 0.001)*** 1.191 (0.844–1.683, P = 0.320) 108 (9.3) 1.622 (1.308–2.012, P < 0.001)*** 0.813 (0.582–1.137, P = 0.226) 112 (8.8) 1.766 (1.427–2.186, P < 0.001)*** 1.018 (0.744–1.393, P = 0.911)
Physical activity Active 659 (63.7) 794 (68.5) 905 (71.2)
Inactive 375 (36.3) 0.912 (0.802–1.036, P = 0.158) 0.839 (0.716–0.982, P = 0.029)* 365 (31.5) 0.921 (0.813–1.044, P = 0.200) 0.914 (0.785–1.064, P = 0.247) 366 (28.8) 0.816 (0.722–0.922, P = 0.001)** 0.821 (0.709–0.951, P = 0.008)**
Asthma experience No 943 (91.2) 1,065 (91.9) 1,131 (89.0)
Yes 91 (8.8) 1.513 (1.216–1.882, P < 0.001)*** 1.077 (0.820–1.415, P = 0.595) 94 (8.1) 1.510 (1.219–1.870, P < 0.001)*** 1.203 (0.924–1.566, P = 0.169) 140 (11.0) 2.199 (1.837–2.633, P < 0.001)*** 1.432 (1.142–1.794, P = 0.002)**
Allergic rhinitis experience No 648 (62.7) 692 (59.7) 767 (60.3)
Yes 386 (37.3) 1.162 (1.023–1.320, P = 0.021)* 0.968 (0.826–1.136, P = 0.693) 467 (40.3) 1.289 (1.145–1.451, P < 0.001)*** 0.980 (0.845–1.137, P = 0.788) 504 (39.7) 1.202 (1.073–1.347, P = 0.002)** 0.953 (0.829–1.095, P = 0.496)
Atopic dermatitis experience No 758 (73.3) 851 (73.4) 950 (74.7)
Yes 276 (26.7) 1.222 (1.063–1.404, P = 0.005)** 0.928 (0.782–1.102, P = 0.395) 308 (26.6) 1.275 (1.117–1.454, P < 0.001)*** 0.964 (0.820–1.132, P = 0.653) 321 (25.3) 1.208 (1.063–1.374, P = 0.004)** 0.972 (0.833–1.135, P = 0.721)
BMI = body mass index, COVID-19 = coronavirus disease 2019, G = grade, OR = odds ratio, SA = suicide attempt, SES = socioeconomic status.
*P < 0.05, **P < 0.01, ***P < 0.001.

DISCUSSION

This study investigated the predictors of suicide risk among adolescents with a focus on financial stress and social isolation due to the quarantine measures during the COVID-19 pandemic. Overall, the results indicated that the rates of suicidal behavior including suicidal ideation, suicide plan and suicide attempt were gradually increased through 2020 to 2022. Furthermore, adolescents who experienced family financial stress and feelings of loneliness were at a higher risk of suicide attempt both in 2020 (shortly after the pandemic began) and in 2021 (1 year into the pandemic). Although the risk of suicide attempt among adolescents experiencing financial difficulties showed a slightly decreasing trend from 2020 to 2021, an increasing trend was identified in adolescents who experienced loneliness.
Social isolation, anxiety about infection, and economic hardship due to COVID-19 exacerbated stress-related disorders and suicidality in vulnerable populations.18 However, some studies have shown contradictory results in the early stages of the pandemic. One study found that suicide behavior decreased by approximately 50% during the COVID-19 lockdown, presumably due to reduced help-seeking and hospitalization rates during the lockdown.19 Another study reported a decrease in suicide rates during the first wave of the COVID-19 pandemic (February to June 2020) but a rapid increase in suicide rates, especially among women, children, and adolescents, during the second wave (July to October 2020) and once schools began reopening.2021 Previous study in US has reported an increase in suicide-related visits, particularly regarding suicidal ideation, among youth, aged 15–20, when compared to pre-pandemic periods.22 In this study, the rate of suicide attempt was at its lowest during the 2020 survey when school closure was still in effect. However, since 2020, suicide attempts have been consistently increasing every year. This trend is thought to be strongly linked to the increase in suicide deaths among youth that has been observed in South Korea23 and other countries.1424 Our findings can be explained by the hypothesis that the accumulation of stress resulting from the prolonged pandemic and continued limited access to mental health services and support may increase suicide attempts during the late pandemic. Numerous studies highlight the profound psychological effects of the pandemic, noting increased distress, depression, and anxiety in children and adolescents.2526 Long-term pandemic effects, such as social isolation, economic strain, and general uncertainty, might accumulate, particularly affecting vulnerable groups, leading to more suicide attempts.1827 Furthermore, the limited availability of mental health services and face-to-face care could also prevent timely and sufficient mental health support.2829
Even before the COVID-19 pandemic, financial burden—along with parents’ mental health, parenting quality, and family conflict—has been reported as a family-related factor influencing the mental health of adolescents.3031 A recent study showed that financial problems were associated with depressive symptoms in adolescents from families with a reduced income due to the COVID-19 pandemic as well as those experiencing subjective financial pressure.32 These findings are in line with our observation that adolescents who experienced a family financial stress during the COVID-19 pandemic were at an increased risk of suicide attempt.
Social isolation is a major cause of loneliness,33 and the physical isolation measures implemented during the COVID-19 pandemic have been linked to the perception of loneliness.34 Increased loneliness due to physical and social isolation can elevate the risk of depression, anxiety, suicidal ideation, and self-harm among children and adolescents.35 In addition, as shown in Table 1, the higher percentage of adolescents reporting loneliness in 2021 than in 2020 appears to be the result of prolonged social isolation due to quarantine measures and restrictions on social gatherings during the pandemic. Although we did not find reports on how the duration of perceived loneliness influences suicide risk, we speculate that a prolonged feeling of loneliness could significantly impact suicide risk.
To compare changes in risk factors for suicide attempts among adolescents before and after COVID-19, we used 2011–2018 KYRBS data from previous studies.17 Risk factors that tended to decrease in association with suicide attempts were grade (G1, G2) and academic achievement, which may be related to reduced school adjustment and exam stress due to nationwide school closures and shortened school days during 2020–2021. Interestingly, the risk of both factors for suicide attempts increased as school resumed in 2022. On the other hand, the association between smoking and drug exposure, and suicide attempts was clearly increased in 2020 compared to the pre-COVID-19 period, which may be related to difficulties in getting adequate attention and control for healthy growth at home or in the community during school closures. There was also a trend toward increased risk of hopelessness for suicide attempts, likely due to limited screening process in schools and mental health services during 2020–2021 and a lack of timely therapeutic linkages.2936 As suicidal ideation and suicide attempt rates have been increasing year over year since 2020, post-COVID-19 public health policy and interventions need to take into account the changes in risk of the above-mentioned factors associated with suicide attempts among youth.
There are limitations in this study. One pertains to the reliance on retrospective self-report surveys because they may be susceptible to recall bias or underreporting. Another limitation is the absence of data for comparing the feeling of loneliness before the COVID-19 pandemic as this variable was introduced for the first time in 2020. Similarly, the lack of data on financial stress during COVID-19 pandemic and drug exposure in 2022 also hinders our ability to confirm sustained trend in these variables. In addition, while this study addressed risk factors associated with the COVID era, it did not account for other confounding factors, including adverse childhood experiences, personality, and protective factors.61337
In conclusion, the changes brought upon by the COVID-19 pandemic certainly impacted the mental health of adolescents, particularly in relation to suicide risk. The study provides insights into the impact of these factors on adolescent mental health because the results demonstrated an elevated risk of suicide attempt among adolescents who experienced financial stress and reported feelings of loneliness during the pandemic. Although financial aid may have weakened the association between family financial stress and suicide risk, adolescents experiencing loneliness showed elevated risks of suicide attempt, indicating that the interventions for social isolation and loneliness were inadequate. As the COVID-19 pandemic comes to an end, it is critical to introduce more specific screening techniques to determine adolescent suicide risk and implement appropriate interventions.

Notes

Funding: This work was supported by Wonkwang University in 2023.

Disclosure: The authors have no potential conflicts of interest to disclose.

Author Contributions:

  • Conceptualization: Yang CM.

  • Formal analysis: Jung SI.

  • Funding acquisition: Yang CM.

  • Writing - original draft: Jung SI.

  • Writing - review & editing: Yang CM, Lee SY, Kim DJ.

References

1. Jones EAK, Mitra AK, Bhuiyan AR. Impact of COVID-19 on mental health in adolescents: a systematic review. Int J Environ Res Public Health. 2021; 18(5):2470. PMID: 33802278.
2. Bruining H, Bartels M, Polderman TJC, Popma A. COVID-19 and child and adolescent psychiatry: an unexpected blessing for part of our population? Eur Child Adolesc Psychiatry. 2021; 30(7):1139–1140. PMID: 32623697.
3. Zalsman G, Stanley B, Szanto K, Clarke DE, Carli V, Mehlum L. Suicide in the time of COVID-19: review and recommendations. Arch Suicide Res. 2020; 24(4):477–482. PMID: 33200946.
4. Pierce M, Hope H, Ford T, Hatch S, Hotopf M, John A, et al. Mental health before and during the COVID-19 pandemic: a longitudinal probability sample survey of the UK population. Lancet Psychiatry. 2020; 7(10):883–892. PMID: 32707037.
5. Guessoum SB, Lachal J, Radjack R, Carretier E, Minassian S, Benoit L, et al. Adolescent psychiatric disorders during the COVID-19 pandemic and lockdown. Psychiatry Res. 2020; 291:113264. PMID: 32622172.
6. Kim KW, Lim JS, Yang CM, Jang SH, Lee SY. Classification of adolescent psychiatric patients at high risk of suicide using the personality assessment inventory by machine learning. Psychiatry Investig. 2021; 18(11):1137–1143.
7. Golberstein E, Gonzales G, Meara E. How do economic downturns affect the mental health of children? Evidence from the National Health Interview Survey. Health Econ. 2019; 28(8):955–970. PMID: 31165566.
8. Magson NR, Freeman JY, Rapee RM, Richardson CE, Oar EL, Fardouly J. Risk and protective factors for prospective changes in adolescent mental health during the COVID-19 pandemic. J Youth Adolesc. 2021; 50(1):44–57. PMID: 33108542.
9. Mansfield KL, Newby D, Soneson E, Vaci N, Jindra C, Geulayov G, et al. COVID-19 partial school closures and mental health problems: a cross-sectional survey of 11,000 adolescents to determine those most at risk. JCPP Adv. 2021; 1(2):e12021. PMID: 34514466.
10. Kawohl W, Nordt C. COVID-19, unemployment, and suicide. Lancet Psychiatry. 2020; 7(5):389–390. PMID: 32353269.
11. Brenner MH, Bhugra D. Acceleration of anxiety, depression, and suicide: secondary effects of economic disruption related to COVID-19. Front Psychiatry. 2020; 11:592467. PMID: 33384627.
12. Fegert JM, Vitiello B, Plener PL, Clemens V. Challenges and burden of the coronavirus 2019 (COVID-19) pandemic for child and adolescent mental health: a narrative review to highlight clinical and research needs in the acute phase and the long return to normality. Child Adolesc Psychiatry Ment Health. 2020; 14(1):20. PMID: 32419840.
13. Anderson KN, Swedo EA, Trinh E, Ray CM, Krause KH, Verlenden JV, et al. Adverse childhood experiences during the COVID-19 pandemic and associations with poor mental health and suicidal behaviors among high school students - adolescent behaviors and experiences survey, United States, January-June 2021. MMWR Morb Mortal Wkly Rep. 2022; 71(41):1301–1305. PMID: 36227769.
14. Goto R, Okubo Y, Skokauskas N. Reasons and trends in youth’s suicide rates during the COVID-19 pandemic. Lancet Reg Health West Pac. 2022; 27:100567. PMID: 35966624.
15. Durante JC, Lau M. Adolescents, suicide, and the COVID-19 pandemic. Pediatr Ann. 2022; 51(4):e144–e149. PMID: 35417315.
16. Korea Disease Control and Prevention Agency. Korea Youth Risk Behavior Survey. Updated 2023. Accessed September 12, 2023. https://www.kdca.go.kr/yhs/home.jsp .
17. Lim JS, Yang CM, Baek JW, Lee SY, Kim BN. Prediction models for suicide attempts among adolescents using machine learning techniques. Clin Psychopharmacol Neurosci. 2022; 20(4):609–620. PMID: 36263637.
18. Sher L. The impact of the COVID-19 pandemic on suicide rates. QJM. 2020; 113(10):707–712. PMID: 32539153.
19. Mourouvaye M, Bottemanne H, Bonny G, Fourcade L, Angoulvant F, Cohen JF, et al. Association between suicide behaviours in children and adolescents and the COVID-19 lockdown in Paris, France: a retrospective observational study. Arch Dis Child. 2021; 106(9):918–919. PMID: 33355154.
20. Tanaka T, Okamoto S. Increase in suicide following an initial decline during the COVID-19 pandemic in Japan. Nat Hum Behav. 2021; 5(2):229–238. PMID: 33452498.
21. Auger N, Low N, Chadi N, Israël M, Steiger H, Lewin A, et al. Suicide attempts in children aged 10-14 years during the first year of the COVID-19 pandemic. J Adolesc Health. 2023; 72(6):899–905. PMID: 36870902.
22. Xiao Y, Junus A, Li T, Yip P. Temporal and spatial trends in suicide-related visits before and during the COVID-19 pandemic in the US, 2018-2021. J Affect Disord. 2023; 324:24–35. PMID: 36566936.
23. Statistics Korea Statistics Research Institute. Children and Youth Well-being in Korea 2022 (Korean version). Updated 2023. Accessed July 30, 2023. https://kostat.go.kr/board.es?mid=b10105000000&bid=0060&act=view&list_no=426078&tag=&nPage=1&ref_bid= .
24. Charpignon ML, Ontiveros J, Sundaresan S, Puri A, Chandra J, Mandl KD, et al. Evaluation of suicides among US adolescents during the COVID-19 pandemic. JAMA Pediatr. 2022; 176(7):724–726. PMID: 35467724.
25. Madigan S, Racine N, Vaillancourt T, Korczak DJ, Hewitt JM, Pador P, et al. Changes in depression and anxiety among children and adolescents from before to during the COVID-19 pandemic: a systematic review and meta-analysis. JAMA Pediatr. 2023; 177(6):567–581. PMID: 37126337.
26. Oliveira JM, Butini L, Pauletto P, Lehmkuhl KM, Stefani CM, Bolan M, et al. Mental health effects prevalence in children and adolescents during the COVID-19 pandemic: a systematic review. Worldviews Evid Based Nurs. 2022; 19(2):130–137. PMID: 35229967.
27. Yao H, Chen JH, Xu YF. Patients with mental health disorders in the COVID-19 epidemic. Lancet Psychiatry. 2020; 7(4):e21. PMID: 32199510.
28. Carr MJ, Steeg S, Webb RT, Kapur N, Chew-Graham CA, Abel KM, et al. Effects of the COVID-19 pandemic on primary care-recorded mental illness and self-harm episodes in the UK: a population-based cohort study. Lancet Public Health. 2021; 6(2):e124–e135. PMID: 33444560.
29. Cantor J, Sood N, Bravata DM, Pera M, Whaley C. The impact of the COVID-19 pandemic and policy response on health care utilization: evidence from county-level medical claims and cellphone data. J Health Econ. 2022; 82:102581. PMID: 35067386.
30. Neppl TK, Senia JM, Donnellan MB. Effects of economic hardship: testing the family stress model over time. J Fam Psychol. 2016; 30(1):12–21. PMID: 26551658.
31. Conger RD, Conger KJ, Elder GH Jr, Lorenz FO, Simons RL, Whitbeck LB. A family process model of economic hardship and adjustment of early adolescent boys. Child Dev. 1992; 63(3):526–541. PMID: 1600820.
32. Argabright ST, Tran KT, Visoki E, DiDomenico GE, Moore TM, Barzilay R. COVID-19-related financial strain and adolescent mental health. Lancet Reg Health Am. 2022; 16:100391. PMID: 36405885.
33. Holt-Lunstad J. A pandemic of social isolation? World Psychiatry. 2021; 20(1):55–56. PMID: 33432754.
34. Binagwaho A. We need compassionate leadership management based on evidence to defeat COVID-19. Int J Health Policy Manag. 2020; 9(10):413–414. PMID: 32610733.
35. Jones AC, Schinka KC, van Dulmen MH, Bossarte RM, Swahn MH. Changes in loneliness during middle childhood predict risk for adolescent suicidality indirectly through mental health problems. J Clin Child Adolesc Psychol. 2011; 40(6):818–824. PMID: 22023273.
36. Ziedan E, Simon KI, Wing C. Effects of state COVID-19 closure policy on non-COVID-19 health care utilization. NBER Work Pap Ser. 2020; 27621.
37. Qi M, Zhou SJ, Guo ZC, Zhang LG, Min HJ, Li XM, et al. The effect of social support on mental health in Chinese adolescents during the outbreak of COVID-19. J Adolesc Health. 2020; 67(4):514–518. PMID: 32753347.
TOOLS
Similar articles