

 PDF
PDF Citation
 Print
Print


INTRODUCTION
Postpartum depression (PPD), that is, a major depressive episode that occurs in the first 4 weeks after delivery,1 is one of the most common complications of childbearing and it occurs in 10–22% of pregnant women.2 The incidence of PPD in Korean women varies between 16.3% and 24.3%345 but another study reported the prevalence of PPD by the depression diagnosis codes in the national health insurance database is only 1.4%.6 The prevalence of PPD in Korea has shown significant variation because of the use of different tools such as the Beck Depression Inventory (BDI) or Edinburgh Postnatal Depression Scale-Korea.78 The 4-week time interval for diagnosing PPD is still controversial, and there have been recommendations to increase this period to 6 months following delivery.9 The 5th edition of the Diagnostic and Statistical Manual of Mental Disorders developed in 2013 expanded this category of depression into “peripartum depression” that includes depressive episodes both during pregnancy and postpartum. However, the criteria for PPD remained as 4 weeks after delivery.1 Depression during the prenatal and postpartum periods is a widespread and debilitating mental health condition, frequently observed both in South Korea and worldwide.10 The primary diagnostic criteria for major depression and PPD include loss of interest and appetite, sleep problems, anxiety, irritability, fatigue, depressed mood, impaired concentration, feeling of being overwhelmed, guilty feeling, psychomotor symptom, and suicidal ideation.1 Particularly, women with PPD have an obsessional preoccupation with the baby’s health and suicidal thoughts and worries about causing harm to the baby.11 Thus, PPD may have a negative impact on the emotional and behavioral development during early childhood.1213 As such, timely interventions for both the mother and child are crucial to mitigate the adverse effect on the child’s emotional and behavioral development.
Previous studies have investigated the possible risk factors of PPD such as young maternal age, low educational level, poor marital status, poor economic status, negative life event, absence of family and social support, antenatal anxiety and depression, and postpartum depressive symptom.1415 Also there are obstetric risk factors including parity, gestational diabetes, unwanted pregnancy, infant-related factors, negative pregnancy and/or delivery experience and delivery by cesarean section. Among them, a history of depressive symptom and anxiety during pregnancy are well-known risk factors.11
PPD is a treatable mental disorder, but it is often understudied and underdiagnosed.16 Even if a diagnosis is made, among mothers experiencing PPD, especially those who wish to breastfeed, many patients often refuse pharmacological treatment out of concern that the medication might affect their baby.17
Therefore, it is essential to identify risk factors for prevention or to conduct early screening for timely interventions. Although the frequency and risk factors of PPD symptoms might vary depending on the country and culture, there is limited and inconsistent research on these risk factors among women in Korea.
Therefore, the purpose of this study was to examine the risk factors of PPD during the ante- and postpartum period to help improve PPD screening in Korean women.
METHODS
Study design and participants
This cohort study used data from the Korean Pregnancy Outcome Study (KPOS), which is a prospective cohort study launched by the Korea Centers for Disease and Prevention.18 KPOS was conducted at two obstetric specialized hospitals including Gangnam CHA Medical Center and Cheil General Hospital from March 2013 to November 2017 and investigated the influencing factors of adverse pregnancy outcomes in Korean women. In this study, we focused on PPD and investigated the risk factors from the first trimester to the postpartum period.
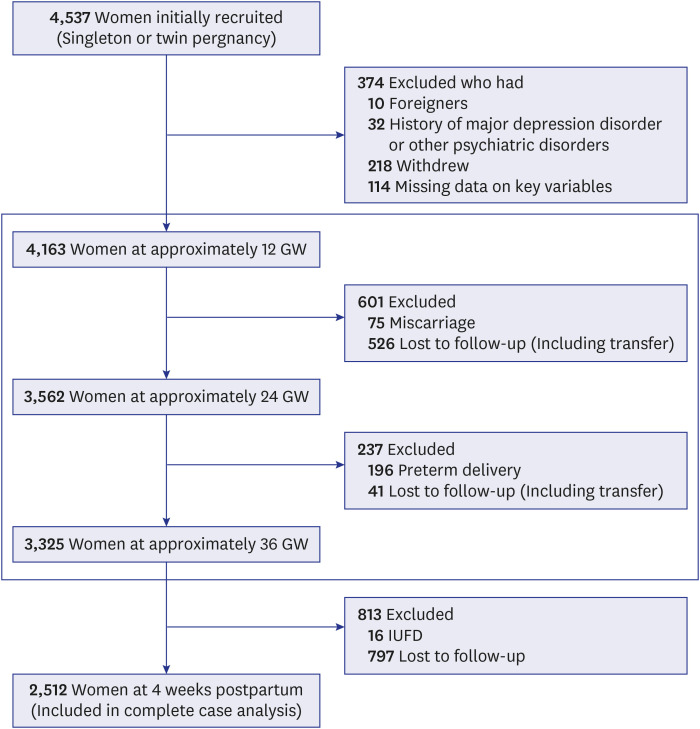
Korean women with singleton or twin pregnancy were enrolled. The eligibility criteria were 1) agreement to participate and provision of written informed consent, 2) ability to understand the self-administered questionnaire, 3) around 12 gestational weeks (GW) at the time of enrollment. The exclusion criteria were 1) women who suffered abortion, intrauterine fetal death, or preterm birth, 2) triplet or quadruplets pregnancy, 3) women with history of major depressive disorder or other mental disorders, 4) women who were transferred to other hospitals or lost to follow up, 5) women who withdrew their consent, 6) women who did not answer the questionnaires we needed. The flow diagram of participants of this study were shown Fig. 1.3
Fig. 1
Flow chart of participants enrolled in this study.3
GW = gestational weeks, IUFD = intrauterine fetal death.
Questionnaire survey
A self-administered questionnaire was administered at enrollment (12 GW ± 4 weeks) and at 24 GW, 36 GW, and 4 weeks postpartum. Depressive symptoms were evaluated using the Korean version of the Edinburgh Postnatal Depression Scale (K-EPDS) at each visit. This scale is specially designed for detecting depression during pregnancy and postpartum.19 The EPDS is widely used in both research and clinical environment for many reasons. Translated into over 50 languages, this scale comprises 10 self-assessment questions that are suitable for diverse health literacy levels and can be completed in 5 minutes. Notably, EPDS can detect symptoms of anxiety, which are often seen in perinatal mood disorders, but it omits some typical depression symptoms like altered sleep patterns. These symptoms were included in other screening tools such as the Patient Health Questionnaire 9 (PHQ-9) and BDI but these scales reduce their specificity for identifying perinatal depression.20 Also, other scales have 20 questions and take more time to complete and to score except the PHQ-9 and EPDS. The EPDS is a 10-item self-reported scale; each item is graded using a 4-point scale (0 to 3 scores), with the total score ranging from 0 to 30. The cut-off point for PPD was a score of > 10, based on a previous study in Korean women.21 These scores indicate a significant risk for PPD, with a sensitivity of 76.7% and a specificity of 87.1% in the K-EPDS.
Variable definition and assessment
General information included maternal age, height, weight, smoking before pregnancy, the presence of second-hand smoking, alcohol consumption, medical disorders such as hypertension, diabetes mellitus, thyroid disease, congenital heart disease, asthma, chronic renal disease, autoimmune disease, atopic disease, epilepsy, polycystic ovary, hepatitis A, B, tuberculosis, marital status, family structure, employment, maternal academic level, household income, and reproductive history (gravidity, parity, live birth, fetal death, artificial and spontaneous abortion). In 2017, the median 4-person household income in South Korea was approximately US $4,000/month. Thus, the standard household income was divided into high and low at a cutoff of 5,000,000 Won/month, equivalent to US $4,400/month. Information regarding the participants’ current pregnancy condition, including planned pregnancy, experience of hyperemesis gravidarum, and threatened abortion, was determined from the baseline questionnaire.
The activity level in ‘Overall activity’ is based on the nature of one’s work intensity; 1: resting (mostly lying down or sitting), 2: light activity (office work, administration, technical job, and housewife with minimal chores), 3: moderate activity (housewife with more chores, teachers, sales, manufacturing, and processing), 4: intense activity (construction, civil engineering, agricultural/fishing workers), 5: very intense activity (athletes, wood carriers, heavy machinery agricultural workers). For the pure physical activity, we used the International Physical Activity Questionnaire (IPAQ). While the IPAQ is made up of vigorous activity, moderate activity, walking, and sitting, we replaced ‘sitting’ with ‘strength activity’ to investigate the amount of resistance training in this study. ‘Vigorous activity’ includes heavy lifting, digging, aerobics, or fast bicycling, and ‘moderate activity’ encompasses activities like carrying light loads, bicycling at a regular pace, or doubles tennis. ‘Walking’ includes that done at work and at home, walking to travel from place to place, and any other walking that you have done solely for recreation, sport, or leisure, exercise. ‘Strength training’ refers to physical activities over the past 7 days such as push-ups, sit-ups, dumbbells, weight lifting, and pull-ups.
Psychological information other than depression included distress thermometer, marriage satisfaction, and quality of life. Distress thermometer is a widely used tool for screening distress, especially in cancer patients.22 This tool consists of two parts. The first part assesses distress felt over the past week. The participants circle a number on the thermometer that best describes the distress (0: not distressed to 10: extremely distressed). The second part assesses problems. Participants tick boxes from the list for problems that apply to them. This list consists of 6 practical, 4 familial, 6 emotional, 1 spiritual/religious, and 21 physical problems. We included 2 items in the familial problems, namely, relationship with parents and relationship with parents in law, because these often occur in the peripartum period in Korean culture.
Marital satisfaction was assessed using the question “How much happiness do you feel in your marriage?”. The response was selected from a 7-point Likert scale as follows: 0, extremely unhappy; 1, quite unhappy; 2, a little unhappy; 3, happy (like most other people); 4, very happy; 5, extremely happy; and 6, perfectly happy. Quality of life was assessed using Korean version of the European Quality of Life in 5 Dimension (mobility, self-care, usual activities, pain/discomfort, and anxiety/depression) with 3 levels of response (no, some, and extreme problems).23 This tool also includes the EQ-5D visual analog scale, which is a rating of subjective health status. The endpoints are labeled “worst imaginable health state” and “best imaginable health state” (0–100). The EQ visual analogue scale (VAS) records the respondent’s self-rated health on a VAS from 0 to 100, whereby 0 indicates “the worst health you can imagine”, and 100 “the best health you can imagine”.
Statistical analysis
We randomly divided the data into a 70:30 ratio for the train set and test set to evaluate the performance of the PPD prediction model. Continuous variables were presented as the means and standard deviations, while categorical variables were presented as numbers with percentages. The participant characteristics by group were assessed using Student’s t test and Wilcoxon two-sample test. The frequencies of categorical variables were compared using Fisher’s exact test. The association between significant variables and PPD was analyzed using univariate analysis and logistic analyses. The results were expressed as odds ratios (ORs) and their 95% confidence intervals (CIs). Significant factors in the multivariate analysis were used to establish a risk model for predicting PPD. All statistical analyses were performed using Statistical Analysis System (SAS) software, version 9.3 (SAS Institute Inc, Cary, NC, USA). A P value of < 0.05 was considered statistically significant.
Ethics statement
The study was approved by the ethics review committee of the Institutional Review Boards of both participating institutions including CHA Gangnam Medical Center (approval No. 2013-14, approval date: 09/May/2013) and Cheil General Hospital (approval No. CGH-IRB-2013-10, approval date: 28/Mar/2013).
RESULTS
Participant characteristics
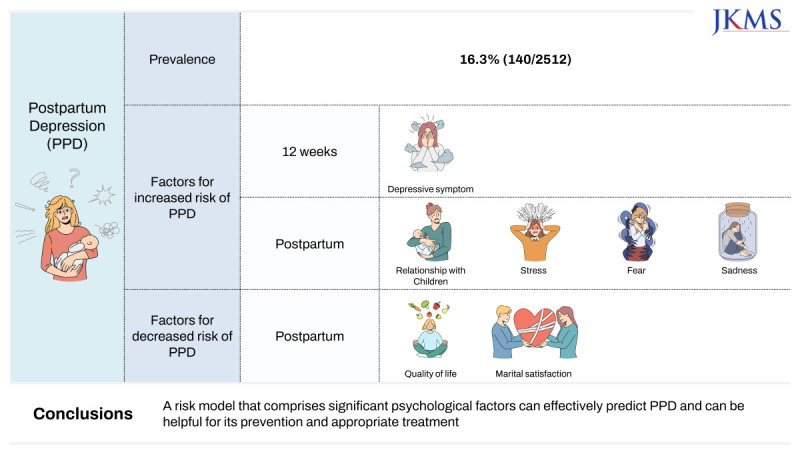
A total of 4,537 pregnant women were enrolled. The prevalence rates of peripartum depression were 19.5% in the first trimester, 13.7% in the second trimester, 13.9% in the third trimester, and 16.6% at 4 weeks postpartum. These data are presented in the first article of KPOS.18 After excluding 1,993 women due to loss to follow-up, miscarriage, or preterm birth and 32 women with a history of major depressive disorder, 2,512 women were evaluated. PPD was prevalent in 16.3% (410/2,512) of the participants. The clinicodemographic participant characteristics by group are shown in Table 1.
Table 1
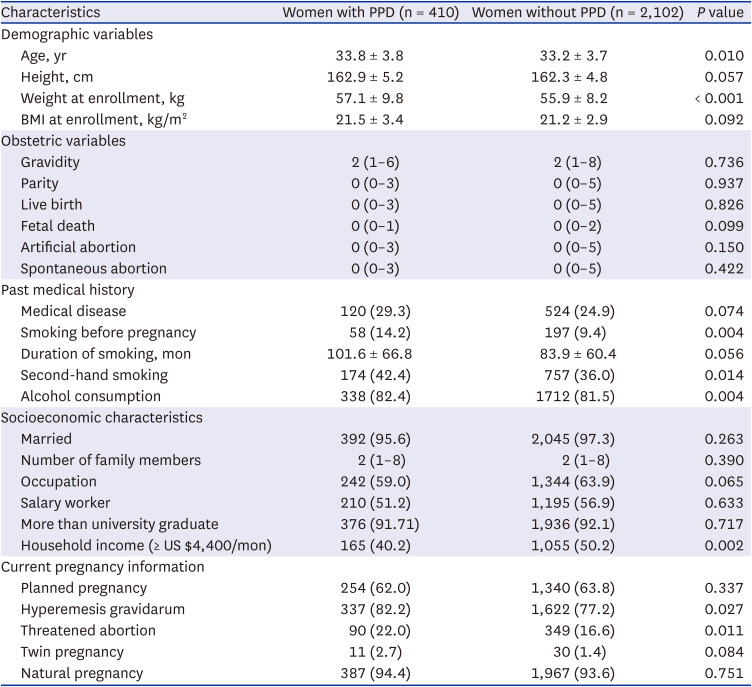
Differences in demographic, socioeconomic, obstetric characteristics between the two groups
Comparison between the PPD and no PPD groups
Maternal age, weight, smoking history before pregnancy, second-hand smoking, alcohol drinking, household income, experience with hyperemesis gravidarum, and threatened abortion were significantly different between the PPD and no PPD groups. The PPD group was significantly older (P = 0.010) and higher weight (P < 0.001) than no PPD group. This group also showed significantly higher rates of hyperemesis gravidarum (P = 0.027) and threatened abortion (P = 0.011). Meanwhile, average household income was higher in the no PPD group (P = 0.002). Smoking history before pregnancy, second-hand smoking, and alcohol consumption were significantly associated with PPD (P = 0.004, P = 0.014, and P = 0.004, respectively).
The comparison of overall physical activity based on work intensity and sleep between the PPD and no PPD groups is shown in Table 2. There was a significant between-group difference in overall physical activity at the postpartum period (P < 0.029), but not in the intensity and frequency of exercise at postpartum period.
Table 2
Between-group comparison of physical activity and sleep across the study time points
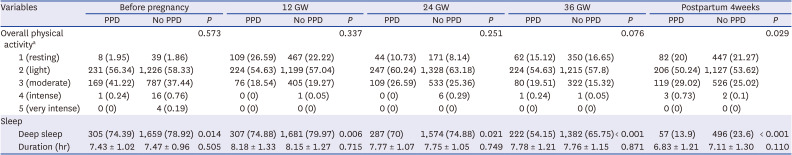
Data are presented as the mean ± standard deviation or number (%).
GW = gestational weeks, PPD = postpartum depression.
a1: resting (mostly lying down or sitting), 2: light activity (office work, administration, technical job, and housewife with minimal chores), 3: moderate activity (housewife with more chores, teachers, sales, manufacturing, and processing), 4: intense activity (construction, civil engineering, agricultural/fishing workers), 5: very intense activity (athletes, wood carriers, heavy machinery agricultural workers).
We investigated whether exercise intensity and strength training can influence the onset of PPD (Table 3). After 24 GW, the number of women with stable status or mild exercise increased, while the number of women with vigorous-to-moderate exercise decreased in in the no PPD group.
Table 3
Between-group comparison of physical activity and sleep across the study time points
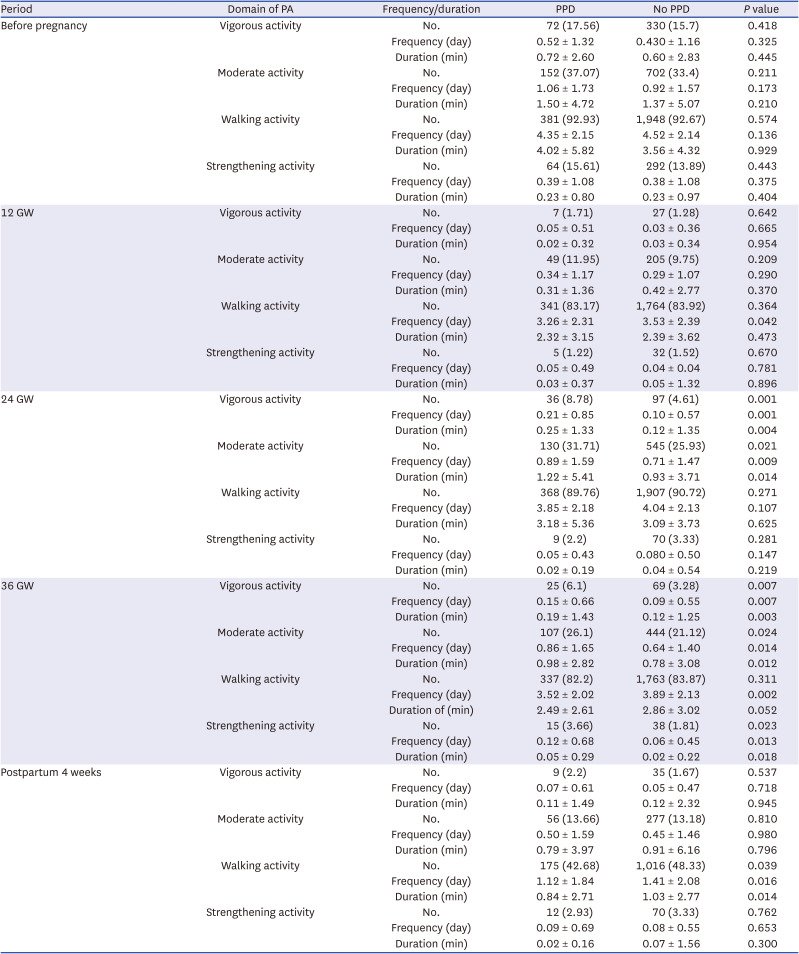
The frequency and duration of vigorous exercise at 24 GW were significantly higher in the PPD group than in the no PPD group (P = 0.001 and P = 0.004, respectively). Similar results were found at 36 GW (P = 0.007 and P = 0.003, respectively). In addition, the frequency and duration of moderate exercise at 24 GW and 36 GW were significantly higher in the PPD than in the no PPD group (P = 0.009, P = 0.014, P = 0.014, and P = 0.012, respectively). On the other hand, the frequency of walking exercise at 8–16 GW, 36 GW, and postpartum were statistically different between PPD and non-PPD group (P = 0.042, 0.002, and 0.016, respectively). The frequency and duration of strengthening exercise at the last month of pregnancy were higher in the PPD group (P = 0.013 and P = 0.018, respectively). Meanwhile, there were no significant between-group differences in walking exercise throughout pregnancy. With respect to the sleep pattern, the number of women with sufficient sleep was significantly higher at all time points (pre-pregnancy, 12 GW, 24 GW, and 36 GW) in the no PPD group than in the PPD group (P = 0.014, P = 0.006, P = 0.021, P < 0.001, and P < 0.001, respectively).
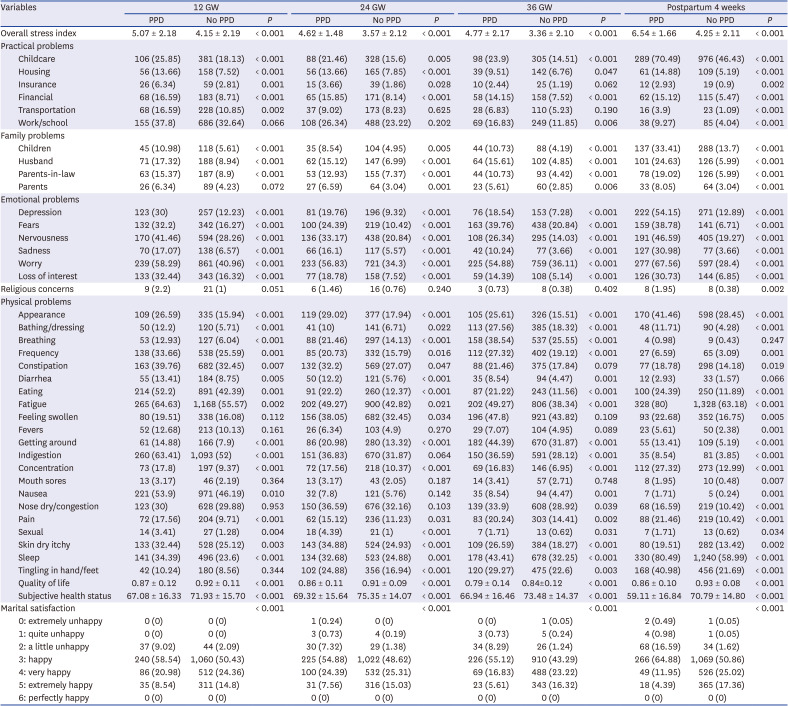
The differences in psychological factors between the PPD and no PPD group are shown in Table 4. The overall stress index was significantly higher in the PPD group throughout pregnancy to postpartum (all P < 0.001). The frequency of several environmental stress factors was also significantly different between the PPD and no PPD groups. The practical problems significantly associated with PPD were childcare, housing, and financial issues; for familial problems, they were relationship with children, husband, and parents in law; emotional problems such as depression, fear, nervousness, sadness, worry, interest of life; and physical problems such as appearance, eating, urination, fatigue, movement, memory, pain, skin trouble, and sleep disturbance. Quality of life, subjective health status, and marital satisfaction were significantly lower in the PPD group than in the no PPD group across all timepoints (all P < 0.001).
Table 4
Differences in stress factors between the PPD and no PPD groups at each time point
Risk factors of PPD
We conducted the univariate analysis and, based on the significant factors identified, proceeded with the multivariate analysis.
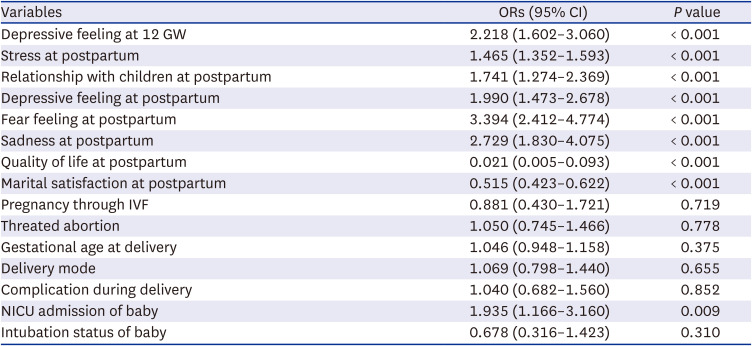
The medical, physical activity, demographic, and psychological factors included in the multivariate regression model are shown in Table 5. Depressive feeling at 12 GW and postpartum factors of stress, relationship with children, depressive feeling, fear, and sadness were significantly associated with developing PPD (OR, 2.392; 95% CI, 1.556–3.654, P < 0.001; OR, 1.478; 95% CI, 1.328–1.653, P < 0.001, OR, 1.615; 95% CI, 1.077–2.401, P = 0.019; OR, 1.848; 95% CI, 1.248–2.72, P < 0.001, respectively. Meanwhile, quality of life and marital satisfaction at postpartum were significantly associated with a lower risk of PPD. When baby is admitted to the NICU, the OR for the onset of PPD increases to 1.935 (95% CI, 1.166–3.160, P = 0.009).
Table 5
Influencing factors of postpartum depression in the multivariate regression analysis
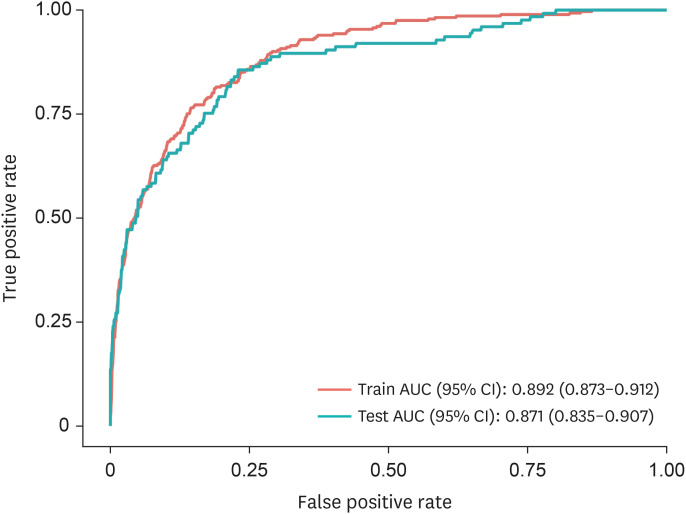
Additionally, we validated the predictive performance of the model we developed using both the train and test datasets (Table 6). The sensitivity for predicting PPD was 0.792, specificity was 0.795, negative predictive value was 0.949, and area under precision-recall curve was 0.871, validating that it is a good model for predicting PPD.
Table 6
Predictive performance for postpartum depression prediction model

| Dataset | Optimal cut-off | AUPRC | Sensitivity | Specificity | PPV | NPV | Accuracy |
|---|---|---|---|---|---|---|---|
| Train dataset | 0.153 | 0.892 | 0.811 | 0.812 | 0.457 | 0.957 | 0.812 |
| Test dataset | 0.871 | 0.792 | 0.795 | 0.442 | 0.949 | 0.795 |
A PPD prediction model that included depressive feeling at 8–16 GW and postpartum factors of stress, relationship with children, depressive feeling, fear, sadness, quality of life, marital satisfaction, and NICU admission of baby had an area under the curve of 0.871 (Fig. 2).
DISCUSSION
Data on the risk factors of PPD among Korean women are rare. To the best of our knowledge, this is the first prospective longitudinal study to determine the demographic, socioeconomic, obstetric, and psychological factors associated with the risk of PPD in Korean women. Previous studies reported that the incidence of PPD ranged from 10% to 22% in the first year after delivery,924 and 33% of women with PPD actually have symptom onset during pregnancy.11 This study also showed a similar prevalence of 16.3% (420/2,512). Further, we also demonstrated that depressive feeling at 12 GW and fear, sadness, and stress including relationship with children at postpartum significantly increased the risk of PPD. In addition, high quality of life scores and marital satisfaction at the postpartum period significantly decreased the risk of PPD. Finally, the risk model comprising these factors accurately predicted susceptibility to PPD.
Previous studies have reported that demographic and socioeconomic conditions are important factors in assessing the postpartum psychological status of new mothers.2526 However, the influence of sociodemographic factors has been conflicting. For example, some studies suggested that younger mothers had a higher risk of PPD2728 than did older women, whereas another study showed that older women had a worse risk of PPD.29 Household income and education level were also related to the risk of PPD. PPD is more prevalent in low- or middle-income countries than in high-income countries (> 20% vs 6.9–12.9%).16 However, conflicting findings have also been reported. In the current study, household income level was associated with the risk of PPD (P = 0.002) but education level did not show a significant difference between the two groups (P = 0.717).
Also, older age and higher body weight at enrollment were associated with the risk of PPD. Further, smoking before pregnancy, second-hand smoking, and alcohol drinking increased the risk of PPD. In addition, the participants who had hyperemesis gravidarum and threatened abortion were found to be at higher risk of PPD. A previous history of depression is the most well-known risk factor of PPD2728 but we excluded women who had a history of major depressive disorder to eliminate its effect.
Overall physical activity at the postpartum period was significantly between the PPD and no PPD groups. The number of women with stable status or mild exercise was lower, while the number of women with moderate-severe exercise was higher in the PPD group. The frequency and duration of vigorous-to-moderate exercise at 24–36 GW and 36 GW until delivery were higher in the PPD group than in the no PPD group. In addition, the frequency and duration of strengthening exercise at the last month of pregnancy (36 GW until delivery) were higher in the PPD group.
Meanwhile, the rate of walking exercise was only significantly different between the two groups at the postpartum period. The Physical Activity for Mothers Enrolled in Longitudinal Analysis reported that moderate-intensity exercise during pregnancy did not lower the risk of PPD.30 In addition, a recent meta-analysis demonstrated that light-to-moderate intensity aerobic exercise had a small beneficial effect on mild-to-moderate depressive symptoms in postpartum women.31 Although exercise has several health benefits against weight gain, stress remission, and prevention of chronic disease, it is difficult to reveal the direct beneficial effects of exercise on reducing depressive symptoms in new mothers.
In this study, it was found that women who had sufficient sleep at all time points pre-pregnancy showed fewer incidence of PPD. Okun reported that sleep disturbance during the perinatal period was significantly associated with an increased risk of PPD.27 Also, short pre-pregnancy sleep duration is associated with developing PPD and this risk is more significant in multiparous women than in nulliparous women.32 Neurotransmitters including estrogen and progesterone-controlled sleep quality during pregnancy. Our previous study showed that insufficient sleep at 36 GW and a shift towards worsening sleep at 36 GW were significantly related to the risk of developing PPD.3 A previous study also demonstrated that sleep disturbances in late pregnancy were related to significant depressive symptoms at 2 to 4 weeks postpartum.33 Based on the results of these studies, collecting information of sleep duration and quality is important to identify women with high risk of PPD.
With respect to psychological factors, we found that depressive feeling at 12 GW and postpartum stress increased the risk of PPD. Meanwhile, high quality of life scores and marital satisfaction at postpartum significantly decreased the risk of PPD. Also, Wakamatsu et al.34 reported that marital dissatisfaction was significantly correlated to developing PPD and a lack of social support was also significantly related to depressive and anxious symptom. Among obstetric factors, it was found that the risk of PPD increases when the baby is admitted to the NICU. Approximately 33% of women with PPD already had depressive symptoms during pregnancy. This is one evidence for the expansion of PPD into peripartum depression in the 5th edition of the Diagnostic and Statistical Manual of Mental Disorders.11 Therefore, depressive feelings at 8–16 GW is a useful predictive factor of PPD. Previous study reported that depressive symptoms and levels of anxiety increased from 24 GW to postpartum, whereas stress levels increased in postpartum but decreased during pregnancy.35 Therefore, depressive symptoms, stress, and anxiety are interrelated and for the pregnant women's psychological well-being, active diagnosis, treatment, and intervention of these symptoms must be continued from the beginning of pregnancy to postpartum.
This study has several limitations. First, besides collecting objective data, the research also included data gathered through subjective questionnaire-based information. Second, we were unable to incorporate more obstetric risk factors that could impact PPD. Given the previous studies have each identified different obstetric risk factors influencing PPD, we included the most representative risk factors in our analysis. Lastly, there is an absence of long-term follow-up results. After about two months postpartum, most women did not return for outpatient tracking, making it difficult to collect further data, thus preventing us from obtaining long-term data.
Despite several limitations, this study has the following strengths. First, this study was performed using large sample size and a prospective, longitudinal cohort design. Second, depressive symptoms were evaluated using a validated and objective scale. Third, many parameters including the diagnostic criteria of depression were evaluated at multiple time points. The change in patterns were also assessed serially, unlike most previous studies that focused on a single time point.
Depressive feeling at 12 GW and postpartum stress, fear, sadness, relationship with children, low quality of life, and low marital satisfaction increased the risk of PPD. The risk model that included these factors accurately predicted the occurrence of PPD. Early diagnosis and timely treatment of PPD can lower its potential negative impact on both the mother and family.
 XML Download