

 PDF
PDF Citation
 Print
Print


INTRODUCTION
Lung cancer is the most dangerous and complex disease. In general, an early American Joint Committee on Cancer (AJCC) stage of lung cancer requires simple curative intent and local therapy, with low recurrence or cancer-related death.123 Some patients with early-stage disease have a risk of local recurrence and metastatic potential even though curative resection is operable.45 In patients with advanced or disseminated disease, a more comprehensive, multidisciplinary approach and systemic therapy are necessary.6789 Recent advances in targeted therapy and immunotherapy for advanced stages have improved the lung cancer survival rate, leading to better clinical outcomes. Some patients in advanced lung cancer stages with long-term survival have also been reported.10111213
Several studies have aimed to determine the reason or risk factors for early but dismal lung cancer and investigated molecular markers associated with its detection and prognosis.141516 Tumor spread through air spaces (STAS) is a recently discovered risk factor in non-small cell lung cancer (NSCLC). The clinical significance of STAS was actively investigated after its first mention in the World Health Organization (WHO) classification of lung adenocarcinoma (LUAD).171819 Recently, the presence of STAS in stage I LUAD and squamous cell carcinoma was associated with a low survival rate compared to the absence of STAS. Additionally, according to the STAS grading system, tumors are divided into two grades, Grade 1 and Grade 2, based on their distance from the main tumor mass (with a cutoff of 2,500 micrometers). Grade 2 is associated with a poorer prognosis than grade 1. On the basis of previous results, the clinicopathological meaning of STAS should be further investigated.2021
In locally advanced or metastatic NSCLC, different biomarkers have been assessed to determine molecular target therapy with conventional chemotherapy and radiotherapy. In clinical practice, targeted molecular drugs against epidermal growth factor receptor and anaplastic lymphoma kinase and immunotherapies targeting the immune checkpoints programmed death 1 (PD-1) and programmed death ligand 1 (PD-L1) contribute to favorable survival for patients with NSCLC.22 Despite the best efforts of clinicians, patients with NSCLC may experience relapse or disease progression, and this situation mandates further emerging targets and novel therapies.
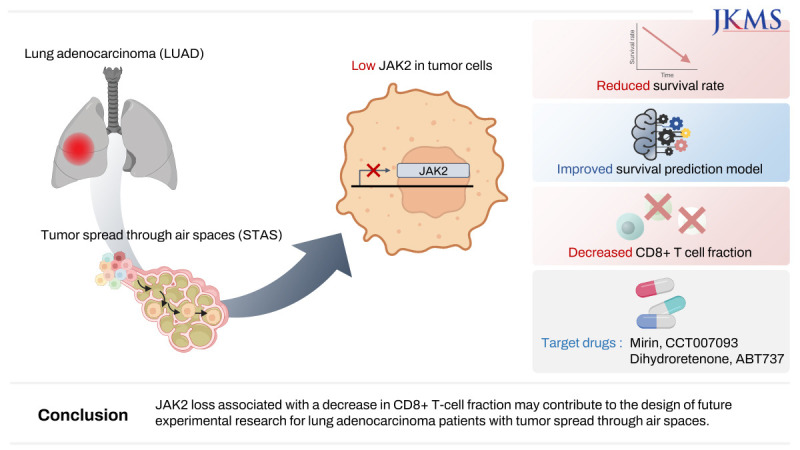
The present study aimed to evaluate clinicopathological factors and survival rates according to the presence of STAS in patients with LUAD. By using bioinformatic analyses, we investigated specific genetic alterations and anticancer immune responses related to STAS. We identified Janus kinase 2 (JAK2), a novel target gene associated with STAS, and then performed pathway network analyses. We investigated drug screening in NSCLC cell lines with JAK2 expression. Using a machine learning (ML) algorithm, we analyzed the effect of JAK2 on the survival of patients with LUAD (Fig. 1).
METHODS
Patient selection and histopathological review
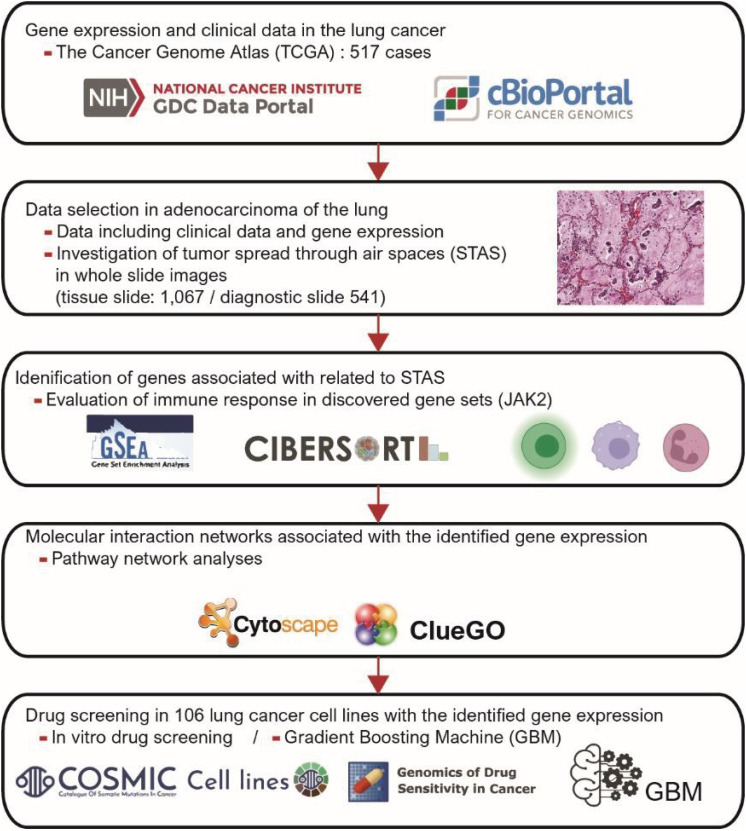
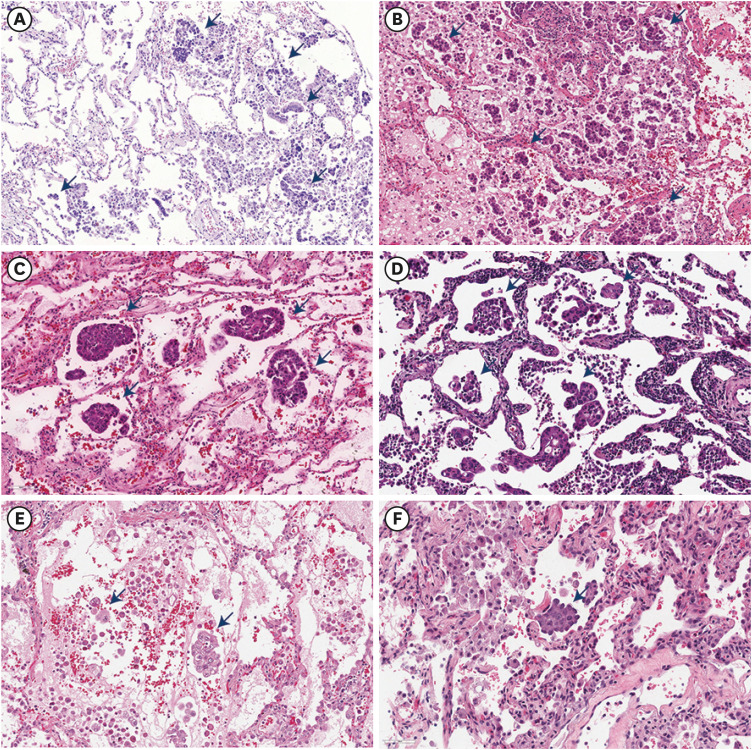
This study included 566 patients with LUAD from National Cancer Institute, Genomic Data Commons (GDC) Data Portal (https://gdc.cancer.gov/about-data/publications/pancanatlas) and cBioPortal (https://www.cbioportal.org/). The presence of STAS was evaluated through whole-slide images (tissue slides 1067/diagnostic slides 541) for LUAD. STAS was defined as described by Kadota et al.18, namely, tumor cells within air spaces in the lung parenchyma beyond the edge of the main tumor composed of three morphological patterns: 1) micropapillary structures consisting of papillary structures without central fibrovascular cores, which occasionally form ring-like structures within air spaces; 2) solid nests or tumor islands consisting of solid collections of tumor cells filling air spaces; and 3) single cells consisting of scattered discohesive single cells (Fig. 2).
Fig. 2
Representative microphotographs revealing tumor spread through air spaces: (A, B) scattered tumor clusters (black arrow) within the air space (original magnification ×100) (C, D) multiple solid clusters (black arrow) (original magnification ×200) (E, F) single cluster (black arrow) (original magnification ×200).
Gene sets, in silico cytometry, and network analysis based on the TCGA database
We selected 517 patients with corresponding RNA-Seq data among 566 LUAD patients. We analyzed significant gene sets using gene set enrichment analysis (GSEA, version 4.3.2).23 Curated gene sets (C2, 6,495 sets), oncogenic gene sets (C6, 189 gene sets) and immunologic gene sets (C7, 5,219 sets) were used to identify gene sets associated with the presence of STAS. For this analysis, 1,000 permutations were used to calculate P values, and the permutation type was set to phenotype; the following cutoffs were used: P < 0.05, false discovery rate of < 0.05 and a family wise-error rate of < 0.1. Through GSEA, expression of JAK2, a gene associated with the presence of STAS, was determined to be low (scores < 361.72) or high (scores > 361.72).
We applied in silico cytometry to investigate proportions of immune cells (https://cibersortx.stanford.edu/). For grouping of networks based on functionally enriched Gene Ontology (GO) terms and pathways, pathway network analyses were visualized using Cytoscape software (version 3.9.1) and ClueGo (version 2.5.8), an application for gene ontology analysis.2425 We used the TIDE tool to identify two biomarkers: TIDE (Tumor Immune Dysfunction and Exclusion) and interferon-gamma (IFN-γ).26
ML algorithm
We integrated JAK2 with clinicopathological parameters (T stage, N stage, tumor size, pleural invasion, lymphovascular invasion, histological subtypes) to construct prognostic models for survival prediction by applying ML algorithms for 517 cases (randomization: training set, 70%; validation set, 30%).2728 A learning algorithm was independently applied to select and combine multiple covariates from gradient boosting machines (GBM) based on multivariate Bernoulli models. To explore the performance of the GBM method, a receiver operator characteristic (ROC) curve was used.
Drug screening
We analyzed the relationship between anticancer drug sensitivity and JAK2 expression based on the Genomics of Drug Sensitivity in Cancer (GDSC) dataset.29 One hundred six NSCLC cell lines were divided into high and low groups based on zero JAK2 expression (Supplementary Table 1). In NSCLC cell lines with low (< 0 based on the z score) or high (> 0) JAK2 expression, drug response was defined as the natural log of the half-maximal inhibitory concentration (LN IC50). A drug was identified as effective when the calculated LN IC50 value was decreased in cell lines with low JAK2 expression and increased in those with high JAK2 expression, i.e., when an inverse correlation was observed.
Statistical analysis
Correlations between clinicopathological parameters and JAK2 were analyzed using the χ2 test. Student’s t-test and/or Spearman’s correlation analysis were applied to examine differences among continuous variables. Survival curves were generated by the Kaplan–Meier method and compared using the log-rank test. A two-tailed P value of < 0.05 was considered statistically significant. All data were analyzed using R software packages and SPSS statistics (version 25.0, IBM Corp., Armonk, NY, USA).
Ethics statement
The TCGA program has established the following policy to clarify freedom of TCGA and non-TCGA users to publish or present on findings using TCGA data. There are no limitations on reports containing analyses using any TCGA data set if the data set meets the following freedom-to-publish criteria: A global analysis publication has been published on that tumor type.
RESULTS
Effect of tumor STAS
The patients with STAS had a shorter survival time than those without STAS (disease-specific survival [DSS], P < 0.001; overall survival [OS], P < 0.001) (Fig. 3A and B). The presence of STAS was associated with advanced N stage (P = 0.02), poorly differentiated histologic grade (P = 0.019), pleural invasion (P = 0.031), and lymphovascular invasion (P = 0.002) (Table 1).
Fig. 3
Survival analyses, gene set enrichment analysis and JAK2 expression. (A, B) Tumor STAS was associated with a low survival rate in patients with lung adenocarcinoma. (C) Gene set enrichment analysis of JAK2 regulation. (D) Bar plots: JAK2 expression was lower in lung adenocarcinoma (DSS, P < 0.001; OS, P < 0.001). (E, F) Low JAK2 expression was related to short survival time in patients with lung adenocarcinoma (DSS, P < 0.050; OS, P = 0.012).
STAS = spread through air spaces, JAK2 = Janus kinase 2, DSS = disease-specific survival, OS = overall survival.
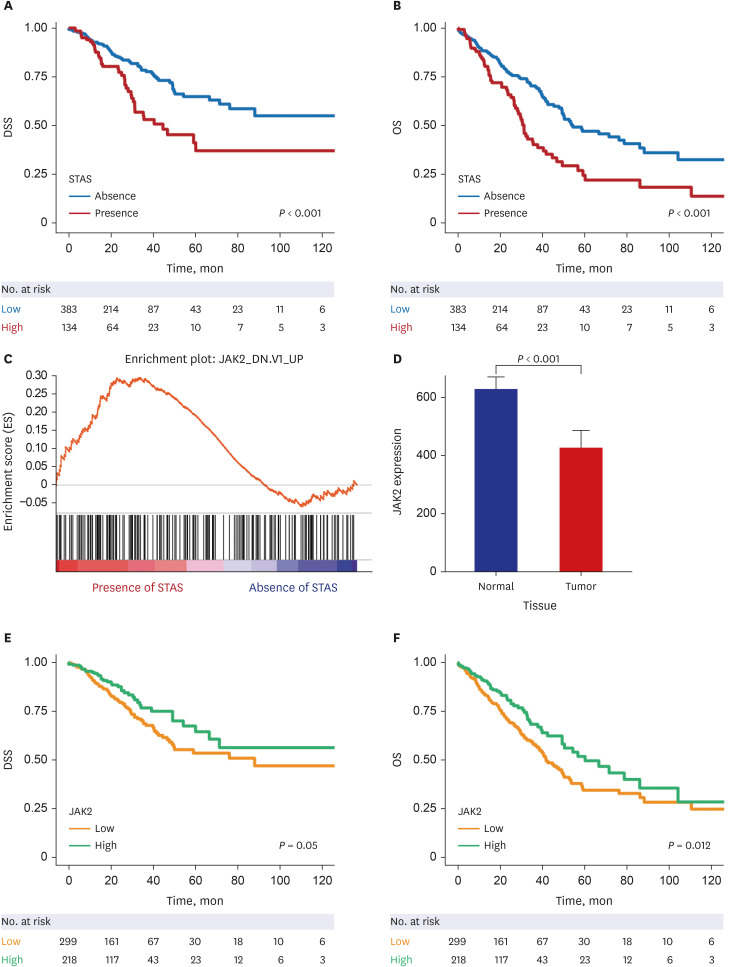
Table 1
Correlation between clincopathological parameters and tumor STAS in patients with lung adenocarcinoma
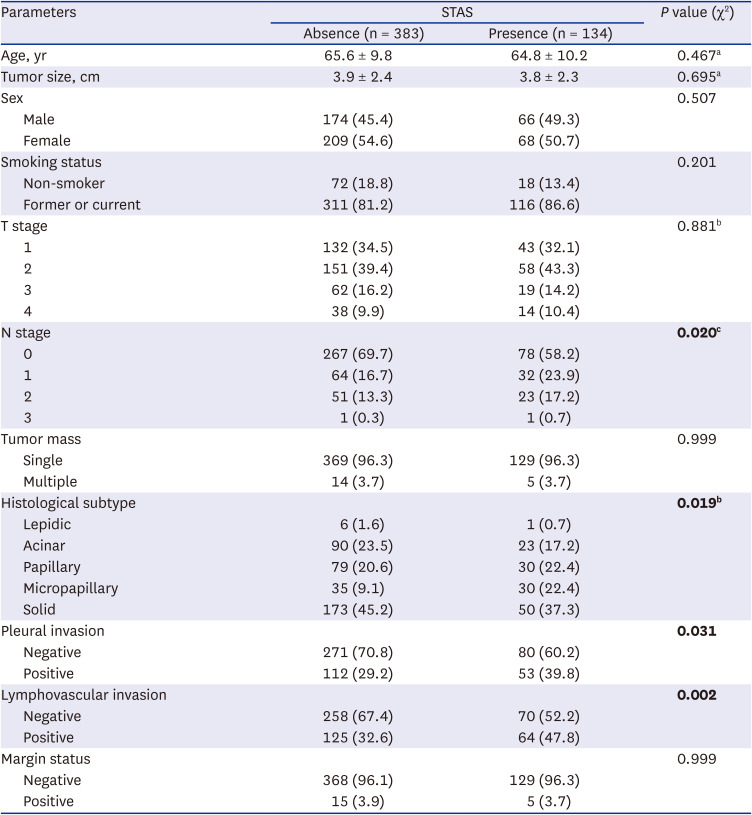
Values are presented as mean ± standard deviation or number (%).
T or N stage, AJCC 8th edition.
STAS = spread through air spaces, T = tumor (American joint committee on cancer [AJCC] staging system, 8th edition), N = lymph nodes (AJCC staging system, 8th edition).
aStudent’s t-test.
bLinear by linear association test.
cN0 vs. N1, 2 or 3.
P < 0.05 is shown in bold.
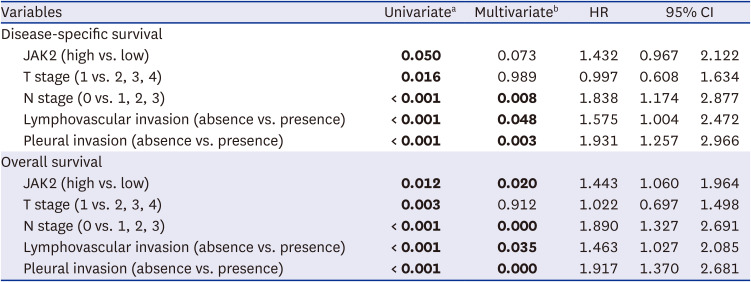
Using GSEA, we identified a JAK2 regulation-related gene set associated with the presence of STAS (Fig. 3C). In particular, JAK2 expression was lower in primary LUAD tissues than in normal lung tissues (P < 0.001) (Fig. 3D). In survival analyses of JAK2 expression, unfavorable survival was found for patients with low JAK2 expression (DSS, P = 0.050; OS, P = 0.012) compared with those with high JAK2 expression (Fig. 3E and F). The statistical significance of OS remained after adjustment for confounding factors, including T stage, N stage, pleural invasion, and lymphovascular invasion (P = 0.020). However, the statistical significance for DSS disappeared after adjustment (P = 0.073) (Table 2). In 497 patients, excluding those with positive surgical margins, low JAK2 expression was associated with worse OS (P = 0.018) and DSS (P = 0.063), with a statistically significant association observed only for OS.
Table 2
Disease-free and overall survival analyses according to JAK2 expression
Low JAK2 expression was related to large tumor size (P = 0.043), young age (P = 0.014), advanced N stage (P = 0.029), pleural invasion (P = 0.041) and lymphovascular invasion (P = 0.011) (Table 3).
Table 3
Correlation between clincopathological parameters and JAK2 in patients with lung adenocarcinoma
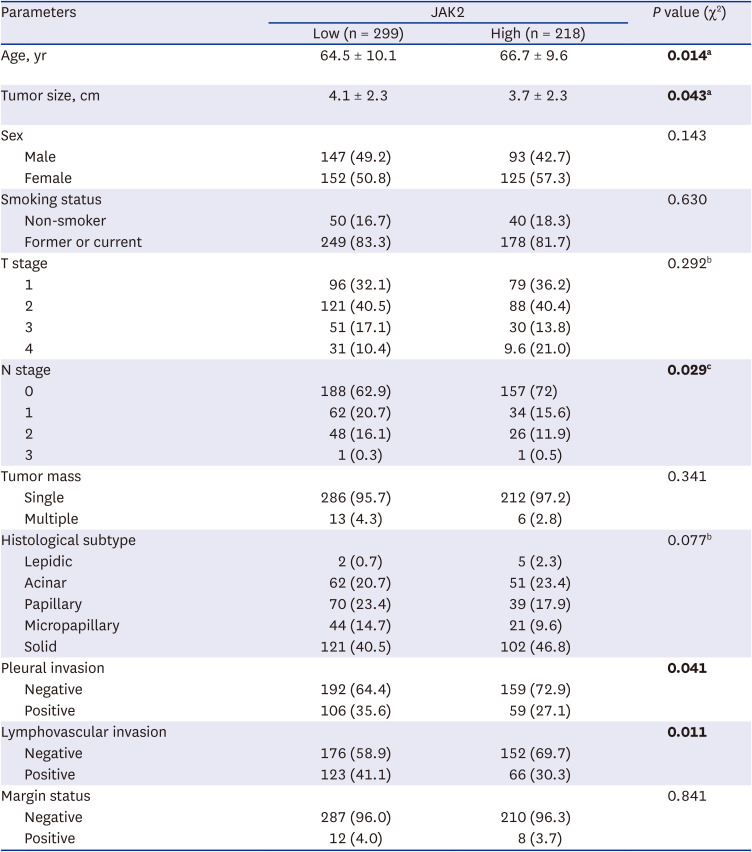
Values are presented as mean ± standard deviation or number (%).
T or N stage, AJCC 8th edition.
JAK2 = Janus kinase 2, T = tumor (American joint committee on cancer [AJCC] staging system, 8th edition), N = lymph nodes (AJCC staging system, 8th edition).
aStudent’s t-test.
bLinear by linear association test.
cN0 vs. N1, 2 or 3.
P < 0.05 is shown in bold.
Survival prediction of JAK2 using machine learning analyses
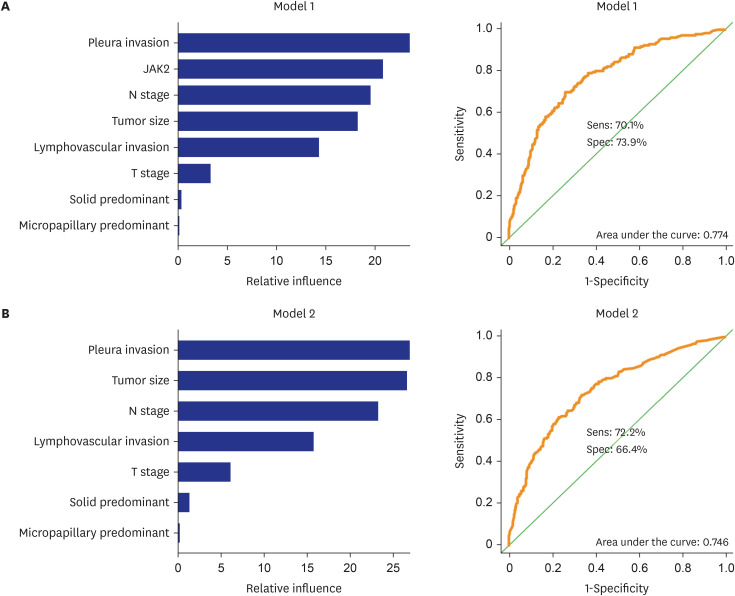
We compared the performance of two survival prediction models for predicting survival rates (Model 1; T and N stage, lymphovascular invasion, tumor size, pleural invasion, solid predominant histological subtype and micropapillary predominant histological subtype and JAK2 versus Model 2; T and N stage, lymphovascular invasion, tumor size, pleural invasion, solid predominant histological subtype, micropapillary predominant histological subtype). ROC curves were generated (area under the curve: Model 1, 0.774; Model 2, 0.746). We found that the prediction model showed improved prognostic performance when JAK2 was added (Fig. 4A and B).
Fig. 4
We applied supervised machine learning models for prognostic prediction using a GBM. The covariates included confounding factors: (A) Model 1; JAK2, T stage, N stage, tumor size, lymphovascular invasion, pleural invasion, solid predominant histological subtype and micropapillary predominant histological subtype versus (B) Model 2; T stage, N stage, tumor size, lymphovascular invasion, pleural invasion, solid predominant histological subtype and micropapillary predominant histological subtype. And their relative importance based on survival. Receiver operating characteristic curves for the GBM models were generated based on a multivariate Bernoulli model.
JAK2 = Janus kinase 2, T = tumor (American joint committee on cancer [AJCC] staging system, 8th edition), N = lymph nodes (AJCC staging system, 8th edition), GBM = gradient boosting machine.
Immune cell profiles and pathway network analysis according to JAK2
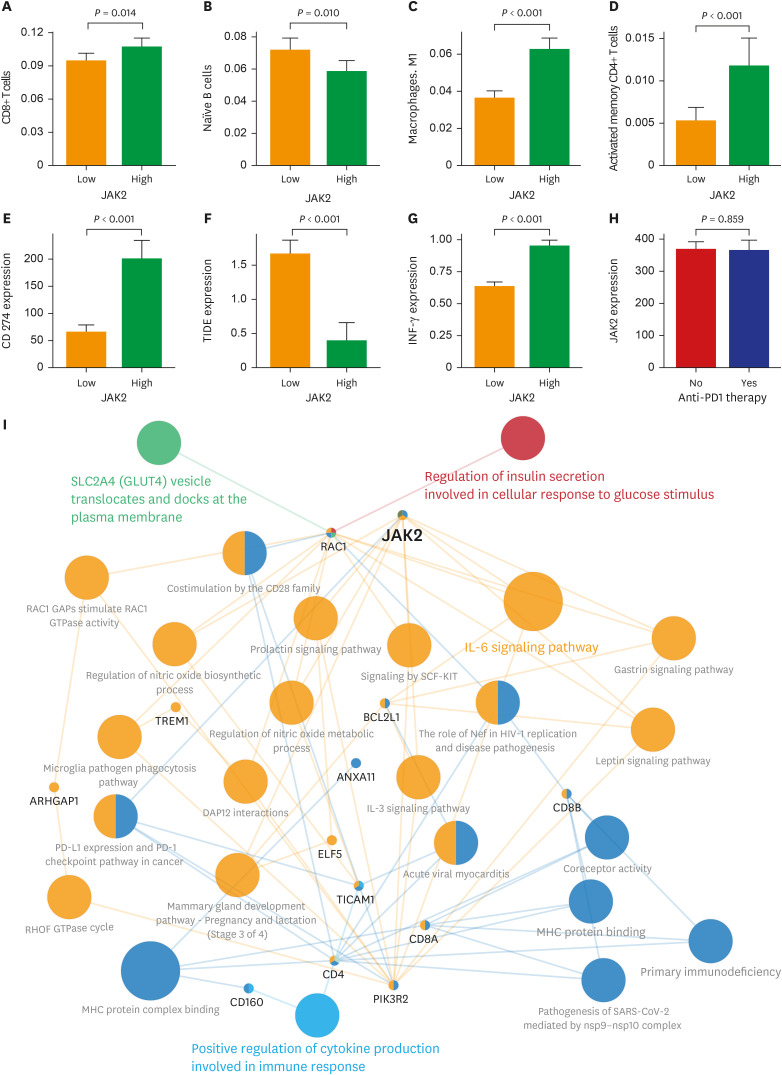
We analyzed the relationship between JAK2 expression and the immune cell fraction. Decreased CD8+ T cells (P = 0.014), M1 macrophages (P < 0.001) and CD4+ memory T cells (P < 0.001) were detected in patients with low JAK2 expression. High JAK2 expression was associated with decreased B cells (P = 0.010). CD274 expression (encoding PD-L1) was reduced in patients with low JAK2 expression (P < 0.001). Low JAK2 expression was associated with high TIDE signature score (P < 0.001) and low IFN-γ (P < 0.001). JAK2 expression was decreased in patients with anti-PD1 therapy response, but it was not statistically significant (P = 0.859). The changes in immune cell profiles related to the presence or absence of STAS did not show statistical significance (Supplementary Fig. 1).
Pathway network analyses demonstrated that JAK2 was directly or indirectly linked to pathways including SLC2A4 vesicle translocation, insulin secretion, immune response and interleukin-6 (IL-6) signaling (Fig. 5).
Fig. 5
Bar plots of JAK2 expression according to immune cells. Bar plot of (A) CD8+ T cells, (B) naïve B cells, and (C) macrophages. M1, (D) activated memory CD4+ T cells, (E) CD 274 expression, (F) TIDE signature score, (G) IFN-γ expression between samples with low (orange) and high (green) JAK2 expression (P = 0.014, = 0.010, P < 0.001, P < 0.001, P < 0.001, P < 0.001 and P < 0.001, respectively), (H) JAK2 expression between no-responder (red) and responder (blue) patients (P = 0.859) (error bars: standard errors of the mean). (I) Grouping of networks based on functionally enriched Gene Ontology (GO) terms and pathways: JAK2 was directly or indirectly linked to SLC2A4 vesicle translocation, insulin secretion, immune response and IL-6 signaling pathway.
JAK2 = Janus kinase 2, PD-1 = programmed death 1, TIDE = Tumor Immune Dysfunction and Exclusion, IFN-γ = interferon-gamma, IL-6 = interleukin-6.
Drug screening
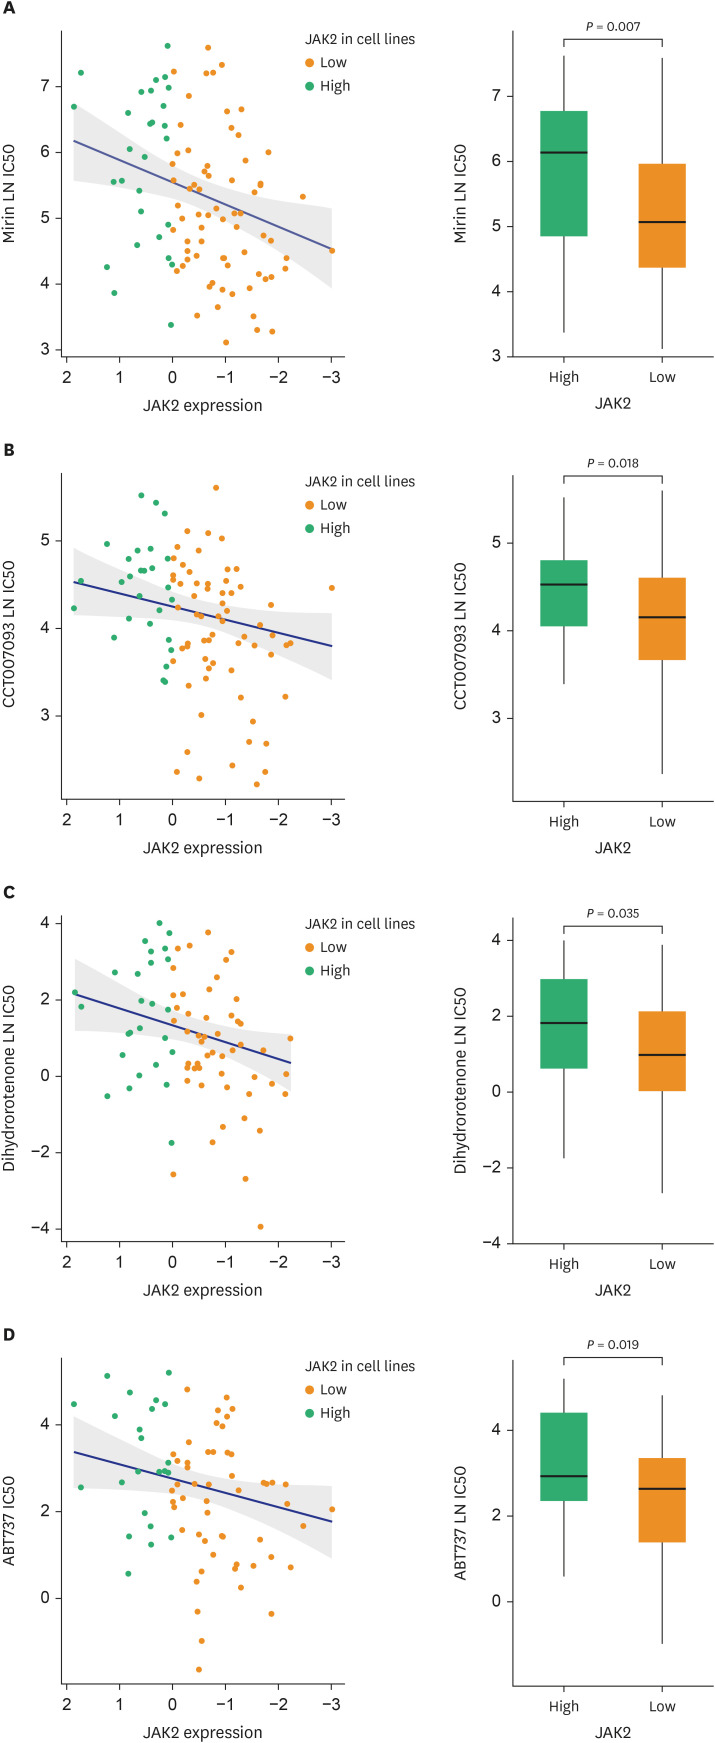
We analyzed drug sensitivity in NSCLC cell lines. Spearman’s correlation analysis showed a high positive correlation between JAK2 and the LN IC50 value for four anticancer drugs: mirin, CCT007093, dihydrorotenone and ABT737. As effective drugs targeting JAK2, these 4 drugs effectively inhibited the growth of NSCLC with low JAK2 expression (Fig. 6).
Fig. 6
Genomics of Drug Sensitivity in Cancer (GDSC) database analysis. Spearman’s correlations showing the natural log of the half-maximal inhibitory concentration (LN IC50) values of (A, left) Mirin (r = 0.275, P = 0.005), (B, left) CCT007093 (r = 0.195, P = 0.047), (C, left) dihydrorotenone (r = 0.250, P = 0.023) and (D, left) ABT737 (r = 0.222, P = 0.042) [green, high JAK2 expression; orange, low JAK2 expression]. Bar plot showing the LN IC50 values of (A, right) mirin, (B, right) CCT007093, (C, right) dihydrorotenone and (D, right) ABT737 between non-small cell lung cancer cell lines with high (green) and low (orange) JAK2 expression.
JAK2 = Janus kinase 2.
DISCUSSION
STAS has been actively investigated for its clinical significance and regarded as associated with worse clinical outcomes in NSCLC, though some controversies exist.3031 In the present study, patients with STAS had worse DFS and OS. Subsequently, we investigated genetic alterations to explain the poor clinical outcome according to STAS. GSEA suggested that JAK2 expression is associated with STAS. Thus, we focused on JAK2 expression in patients with LUAD.
JAK2 has been regarded as a biomarker for the prognosis of acute myelogenous leukemia (AML) and targeted for novel treatment in the modern AML treatment era of relapse after hematopoietic stem cell transplantation and treatment-related toxicities.32 Hepatocellular carcinoma (HCC) is a complex and problematic solid cancer. Sonohara et al.33 reported the clinical significance of JAK2 in HCC treatment, with somewhat contrary results compared to previous studies. High expression of JAK2 in background normal liver tissue of resected HCC might be a good prognostic biomarker. In addition, the clinical significance of JAK2 in cancer treatment and prognosis has been reported in pancreatic ductal adenocarcinoma and metastatic breast cancer.3435 In NSCLC, JAK2 and its related signaling pathway STAT were found to be associated with PD-L1 upregulation accompanied by simultaneous amplification.36 In our study, JAK2 expression was lower in LUAD. Following the survival curve comparison by STAS frequency, low JAK2 expression was negatively associated with LUAD survival. In clinicopathological analysis and comparison, well-known risk factors for recurrence and poor prognosis, pleural invasion and lymphovascular invasion were significantly higher in the low JAK2 expression group.2 From these findings, JAK2, which was previously regarded as an important molecular marker in solid and blood malignancies, might also have a significant role in NSCLC.
In our study, low JAK2 expression was associated with decreased CD8+ T cells and macrophages. M1, memory CD4+ T cells, and CD 274. The PD-L1-PD-1 axis is an inhibitory system that suppresses the effector functions of activated T cells and functions to inhibit the autoimmune response.36 From these findings, we assume that low JAK2 expression could be related to suppressed immune cell function via increased PD-L1. Therefore, JAK2 might be used as a target or related molecule in developing anticancer drugs and anti-PD-L1 drugs. Next, in pathway network analysis, JAK2 was directly or indirectly linked to the immune response and IL-6 signaling pathway. From these findings, we propose that JAK2 is a potent biomarker for cancer treatment and prediction of prognosis, directly or indirectly.
In vitro drug screening showed that mirin (MRE11 [DNA repair-related protein] - targeted inhibitor), CCT007093 (PPM1D [cell cycle-related protein - targeted inhibitor]), dihydroretenone (a potent mitochondrial inhibitor), and ABT737 (BCL family [apoptosis regulation] - targeted inhibitor) effectively killed NSCLC cells with low JAK2 expression. With further investigation and experiments, these potent drugs might become alternatives for lung cancer treatment in patients with low JAK2 expression.
In machine learning analyses with well-known prognostic parameters (T stage, N stage, lymphovascular invasion, pleural invasion, tumor size), JAK2 showed improved survival prediction performance when it was added to the above parameters. Again, our study shows the valuable function of JAK2 in lung cancer treatment outcome prediction and prognosis estimation.
This study has some limitations. First, this retrospective study did not consider complex genetic alterations during cancer progression. Second, our results based on in silico analyses need to be experimentally validated. Third, using machine learning, more clinicopathological parameters should be considered for optimization of the survival prediction model.
In summary, we found a significant relationship between JAK2 and STAS in LUAD patients. Low JAK2 expression was related to a shorter survival time with low CD8+ T cells, which was verified by in silico cytometry. In drug screening, mirin, CCT007093, dihydroretenone, and ABT737 suppressed the growth of NSCLC with low JAK2 expression. Our results should prompt future studies based on experiments and a larger number of LUAD patients.
 XML Download