Abstract
While arterial tone is generally determined by the phosphorylation of Ser19 in myosin light chain (p-MLC2), Thr18/Ser19 diphosphorylation of MLC2 (pp-MLC2) has been suggested to hinder the relaxation of smooth muscle. In a dual-wire myography of rodent pulmonary artery (PA) and mesenteric artery (MA), we noticed significantly slower relaxation in PA than in MA after 80 mM KCl-induced condition (80K-contraction). Thus, we investigated the MLC2 phosphorylation and the expression levels of its regulatory enzymes; soluble guanylate cyclase (sGC), Rho-A dependent kinase (ROCK) and myosin light chain phosphatase target regulatory subunit (MYPT1). Immunoblotting showed higher sGC-α and ROCK2 in PA than MA, while sGC-β and MYPT1 levels were higher in MA than in PA. Interestingly, the level of pp-MLC2 was higher in PA than in MA without stimulation. In the 80K-contraction state, the levels of p-MLC2 and pp-MLC2 were commonly increased. Treatment with the ROCK inhibitor (Y27632, 10 µM) reversed the higher pp-MLC2 in PA. In the myography study, pharmacological inhibition of sGC (ODQ, 10 µM) slowed relaxation during washout, which was more pronounced in PA than in MA. The simultaneous treatment of Y27632 and ODQ reversed the impaired relaxation in PA and MA. Although treatment of PA with Y27632 alone could increase the rate of relaxation, it was still slower than that of MA without Y27632 treatment. Taken together, we suggest that the higher ROCK and lower MYPT in PA would have induced the higher level of MLC2 phosphorylation, which is responsible for the characteristic slow relaxation in PA.
Mammalian pulmonary and systemic circulatory systems circulate the same blood volume at the same periodicity [1]. The pulmonary circulation is characterized by low resistance; lower stiffness of large conduit vessels and higher hydraulic capacitance of small vessels in the pulmonary than systemic circulation [2]. This low resistance can be attributed several factors including anatomical characteristics; such as a shorter pathway and low pressure from right ventricle at the same gravity level. Additionally, the pulmonary arteries (PAs) and capillaries are thinner and less muscular than the walls of systemic arteries and arterioles [3,4].
Physiologically, PAs respond to sympathetic activation with modest intensity, whereas the substances like TxA2, serotonin and endothelin can cause potent vasoconstriction [5-7]. Also, compared to systemic arteries, PAs show unique contractile response to hypoxia, called hypoxic pulmonary vasoconstriction (HPV) [8,9]. The mechanism of HPV is not obvious, but it does not depend on the nervous system or systemic hormone. Rather, the pulmonary vascular smooth muscle cells might sense the low oxygen levels (low Po2) through several mechanisms [10].
In vascular smooth muscle, the lever arm part of the myosin head is the key regulatory domain, which is stabilized by the tightly associated essential light chains (LC17) and the regulatory light chains (LC20, RLC or MLC2) [11]. Phosphorylation of MLC2 allows the myosin heads to interact with actin, resulting marked increase in the myosin Mg2+-ATPase activity. In general, the smooth muscle contraction is primarily activated by Ser19 phosphorylation of MLC2 (p-MLC2) catalyzed by Ca2+/calmodulin-dependent myosin light chain kinase (MLCK) [12].
Although the Ser19 phosphorylation is considered the physiological condition of vascular smooth muscle contraction, an additional phosphorylation of neighboring Thr18 (T18), i.e., diphosphorylated MLC2 (pp-MLC2) has been observed in several smooth muscle tissues stimulated by specific conditions such as renal afferent arterioles stimulated with endothelin-1 [13]. Additionally, increased pp-MLC2 has been frequently associated with pathophysiological conditions in systemic arteries such as vasospasm in cerebral arteries [14-16].
Pathological changes of contractility in pulmonary arterial hypertension (PAH) have been reported by several researchers including our own work [17,18]. In the studies of PAH rat model, significant alternations in sensitivity to agonists and the impaired relaxation following contractile stimuli have been analyzed [19]. The underlying changes in regulatory mechanisms for PA contractility include the downregulation of nitric oxide synthase III (eNOS) and its downstream pathways such as soluble guanylate cyclase (sGC), protein kinase G (PKG) and regulatory subunit (MYPT1) of myosin light chain phosphatase (MLCP). Also, the upregulation of RhoA-dependent kinase 2 (ROCK2) and pp-MLC2 were found in the PAH model PA smooth muscle [19-21].
While conducting experiments on isometric tension measurement using dual-wire myography, we have consistently observed distinguishable differential kinetics between PA and systemic arteries, such as the mesenteric artery (MA), in response to standard depolarizing stimulation (e.g., treatment with 80 mM KCl (80K) solution). Especially, in our pilot study, the PAs showed distinctively slower relaxation during the washout period after 80K-contraction when compared to the relaxation response of MAs. The basic but fundamental difference in the physiological properties between the two types of vessels could be understood in terms of the signaling pathways regulating the contraction-relaxation processes of smooth muscle. However, no previous study has precisely compared the physiological and molecular biological mechanisms to date.
Here we investigate the isometric tension responses of rat PAs and MAs to the 80K stimulation, and compare the expression levels of MLC2 and its phosphorylated forms (p-MLC2 and pp-MLC2). We also compare, the signaling enzyme regulating MLC2 phosphorylation including ROCK and MYPT1 were compared. Our results indicate that the quantitative differences of the MLC2 regulatory molecules underlie the distinguishable kinetics of physiological properties of the PA and MA.
All experimental procedures were conducted with the approval of the Institutional Animal Care and Use Committee of Seoul National University (approval number: SNU-230424-3-1). 11–12-week-old Male Sprague-Dawley rats (324 ± 11 g) were obtained from KOATECH. The animals were housed at the institution’s animal care facilities and maintained on ad libitum standard rat chow and tap water in 12:12-h light-dark cycle. Rats were administered the mixture of ketamine (90 mg/kg-1) and xylazine (10 mg/kg-1) via intraperitoneal injection for euthanasia.
Rat lung tissues and mesenteric bed were excised and stored in ice-cold normal Tyrode’s (NT) solution with the following composition: 140 mM NaCl, 5.4 mM KCl, 0.33 mM NaH2PO4, 10 mM HEPES, 10 mM glucose, 1.8 mM CaCl2 and 1 mM MgCl2, pH 7.4 was adjusted with NaOH. The PAs were revealed and collected by removing the lung and bronchial tissues under a microscope. The excised PAs were trimmed from perivascular adipose and other tissues. The isolated mesenteric bed was pinned out in a Petri dish filled with NT solution and adipose and irrelevant tissues were removed to reveal the vessels of interest, then Mas were cut longitudinally along the mesenteric veins. The endothelial layer of isolated vessels was not intentionally removed for the following experiments of isometric tension recording and immunoblotting assay.
The isometric force of the arterial ring segments was measured using dual-wire multi myograph system containing four organ chambers (620 M; DMT). The second and the third branches of PAs and MAs were carefully dissected as 2 mm long ring segments and mounted with 25 µm tungsten wire on the organ chambers filled with NT solution. Then the mounted arteries were stabilized in physiological salt solution (PSS; 118 mM NaCl, 4 mM KCl, 24 mM NaHCO3, 1 mM MgSO4, 0.44 mM NaH2PO4, 5.6 mM glucose and 1.8 mM CaCl2) equilibrated with a gas mixture (21% O2, 5% CO2, N2 balance) for at least 15 min, and the temperature was maintained at 37°C. For the experiment, 80 mM of KCl PSS (equimolar substitution of NaCl with KCl) was used to induce the contraction (80K-contraction) and confirm the integrity of arteries.
Pulmonary and mesenteric arteries were dissected and snap frozen in liquid nitrogen and kept in –80°C. The dissected PAs were homogenized with RIPA buffer (Millipore) with proteas/phosphatase inhibitor cocktail (Roche Diagnostics, Germany) and centrifuged for 30 min at 13,000 g at 4°C. Protein concentration was determined using the Pierce BCA Protein Assay Kit (Thermo Fisher Scientific). The loading samples were prepared with Laemmli sample buffer, resolved by 8% SDS-PAGE, and transferred to polyvinylidene difluoride membranes in 25 mM Tris, 192 mM glycine, 0.01% SDS, and 20% methanol. Membranes were blocked in 1× TBS containing 1% Tween-20 and 5 % skim milk (blocking solution) for 1 h at room temperature with gentle rocking and incubated overnight at 4°C with relevant primary antibodies for detecting protein expression. The primary and secondary antibodies are listed in Table 1. The signals were determined using ECL Plus Western blotting detection reagents (Amersham Biosciences) and the detected images were obtained by Amersham Imager 600 (Amersham Biosciences). The intensity of each band was measured using ImageJ analysis software.
To evaluate the phosphorylation states of MLC2 depending on the duration of membrane depolarization, the PAs and MAs were fixed with 10% trichloroacetic acid immediately after the incubation with 80 mM KCl bath solution. Arteries were fixed for 15 min and washed three times with ice-cold PBS. The fixed arteries were homogenized for detecting phosphorylation through immunoblotting as described above.
All data are expressed as mean ± SD and number of tested arteries is indicated as n. For all comparisons, arteries were obtained from at least three rats per protocol. Statistical differences between PAs and MAs were analyzed using paired or unpaired Student’s t-test. ANOVA was used to investigate more than two groups, and Tukey correction was performed for post-hoc testing for significant differences. Statistical differences were analyzed using a standard software package (Prism 8.0; GraphPad) and differences were considered when the p-value was less than 0.05
The dissected vessels of similar longitudinal lengths and diameters were used for the isometric contraction study, and the representative photos of PA and MA in the dual-wire myography are shown (Fig. 1A, B). The inner diameter of the vessels was measured when the change of passive tension was firstly detected while increasing the distance between the two jaws of myograph (Fig. 1B).
After detecting the first passive tension, to order to establish the relationship between the tension (both passive and active) and the length of arterial smooth muscle tissue (i.e., the inner circumference [I.C.]), we further increased the distance between the jaws in a stepwise manner. Following the initial increase of the tone by each stretch, spontaneous partial decrease of the passive tension was observed (Fig. 1C). Then, 80 mM KCl solution was applied as a standard condition of active contractile response (active tension by 80K). After returning to normal PSS, we applied the next level of stretch to confirm both passive tension and the active tension by 80K (Fig. 1C). The extent of passive tension increase in response to the I.C. change was higher in MA than PA. In addition, the increase in active tension in response to the I.C. increase was more sensitive in MA than PA; the maximum active tension appeared at the relatively shorter I.C. in MA (Fig. 1D). Based on the results, the subsequent experiment of isometric tension recording was conducted at the I.C. of 1,100–1,300 µm, showing the maximum active tension responses.
The active tension responses induced by step-wise increase of extracellular [K+] were compared between PA and MA. Notable, significant contraction occurred commonly when [K+] exceeded 20 mM. It was notable that MA showed more prominent spontaneous relaxation at each level of KCl application (Fig. 2A). Then, we compared the single contractile response to 80 mM KCl (80K-contraction). Although the peak amplitude of 80K-contraction was not statistically different between PA and MA (Fig. 2B, C), it was notable that the relaxation by washout, i.e., returning to the normal PSS, was markedly slower in PA than MA. The times to reach the 50% (t1/2) and 25% (t3/4) of the peak contraction after returning to PSS were consistently longer in PA than MA (Fig. 2D, E).
Previous studies suggested that a sluggish relaxation of vascular smooth muscle could be associated with pp-MLC, i.e., T18/S19 diphosphorylation state of MLC2 [22]. Therefore, we compared the levels of MLC2 and its phosphorylated states between PA and MA. Although the normalized level of MLC2 expression (MLC2/β-actin) was not different, the relative amount of pp-MLC2 (pp-MLC2/MLC2) was significantly higher in PA than MA. Interestingly, the single S19 phosphorylation level (p-MLC2/MLC2) was not different between PA and MA (Fig. 3A, B).
Then we compared the levels of regulatory molecules for MLC2 phosphorylation (Fig. 3C, D). Among the downstream targets of the NO pathway, the alpha subunit of sGC (sGC-α) was higher, while its beta subunit (sGC-β1) was slightly lower in PA than MA. The level of PKG was not different. Besides the calmodulin-dependent MLCK, it is known that the phosphorylation state of MLC2 is regulated by ROCK and MLCP [23]. Interestingly, the level of ROCK2, but not ROCK1, was higher in PA than MA. Furthermore, MYPT1, the key regulatory subunit of MLCP, was lower in PA than MA (Fig. 3C, D).
Then we analyzed the changes in MLC phosphorylation in response to 80K stimulation with or without the ROCK inhibitor (Y27632, 10 µM). The levels of p-MLC2 and pp-MLC2 were markedly increased by an exposure to 80K in both PA and MA. Although statistical significance was not evident, when treated with Y27632, the normalized level of p-MLC2 and pp-MLC2 were reduced close to the control level. Interestingly, the reverse of pp-MLC2 by Y27632 was more consistently observed in PA with statistical significance (Fig. 3E, F).
It is known that the activity of MLCP is positively regulated by the cGMP-dependent signaling pathway and negatively regulated by ROCK, with differently target for the phosphorylation of MYPT1 [24-27]. Therefore, we also examined the effects of the sGC inhibitor (ODQ, 10 µM) on the relaxation speed of the vessels. When treated with ODQ during 80K stimulation and washout period, relaxation became prolonged in both PA and MA (Fig. 4A, B). Since the levels of sGC-α and ROCK2 were commonly higher in PA than MA, it was anticipated that the effect of ODQ could be more prominent in PA. Consistent to the anticipation, their relaxation speed (t1/2 and t3/4) was still slower in PA than MA treated with ODQ (Fig. 4B). The delayed relaxation by ODQ treatment was commonly reversed by cotreatment with ROCK inhibitor, Y27632 (10 µM, Fig. 4C, D). Finally, we examined whether the slower relaxation in control PA could be shortened by ROCK inhibitor. Only the t1/2, not t3/4, of PA could be reduced by the treatment with Y27632 alone. Also, the relaxation speed of PA in the presence of Y27632 was still slower than that of MA (Fig. 4E, F).
The goal of the present study was to elucidate the differences in the expression of molecules regulating MLC phosphorylation, which could be underlie the slower relaxation of PA compared to systemic arteries like the MA. Also, we aimed to validate the correlation between relaxation kinetics and the biochemical signaling by using pharmacological inhibitors for the key signaling molecules that differ in expression between PA and MA.
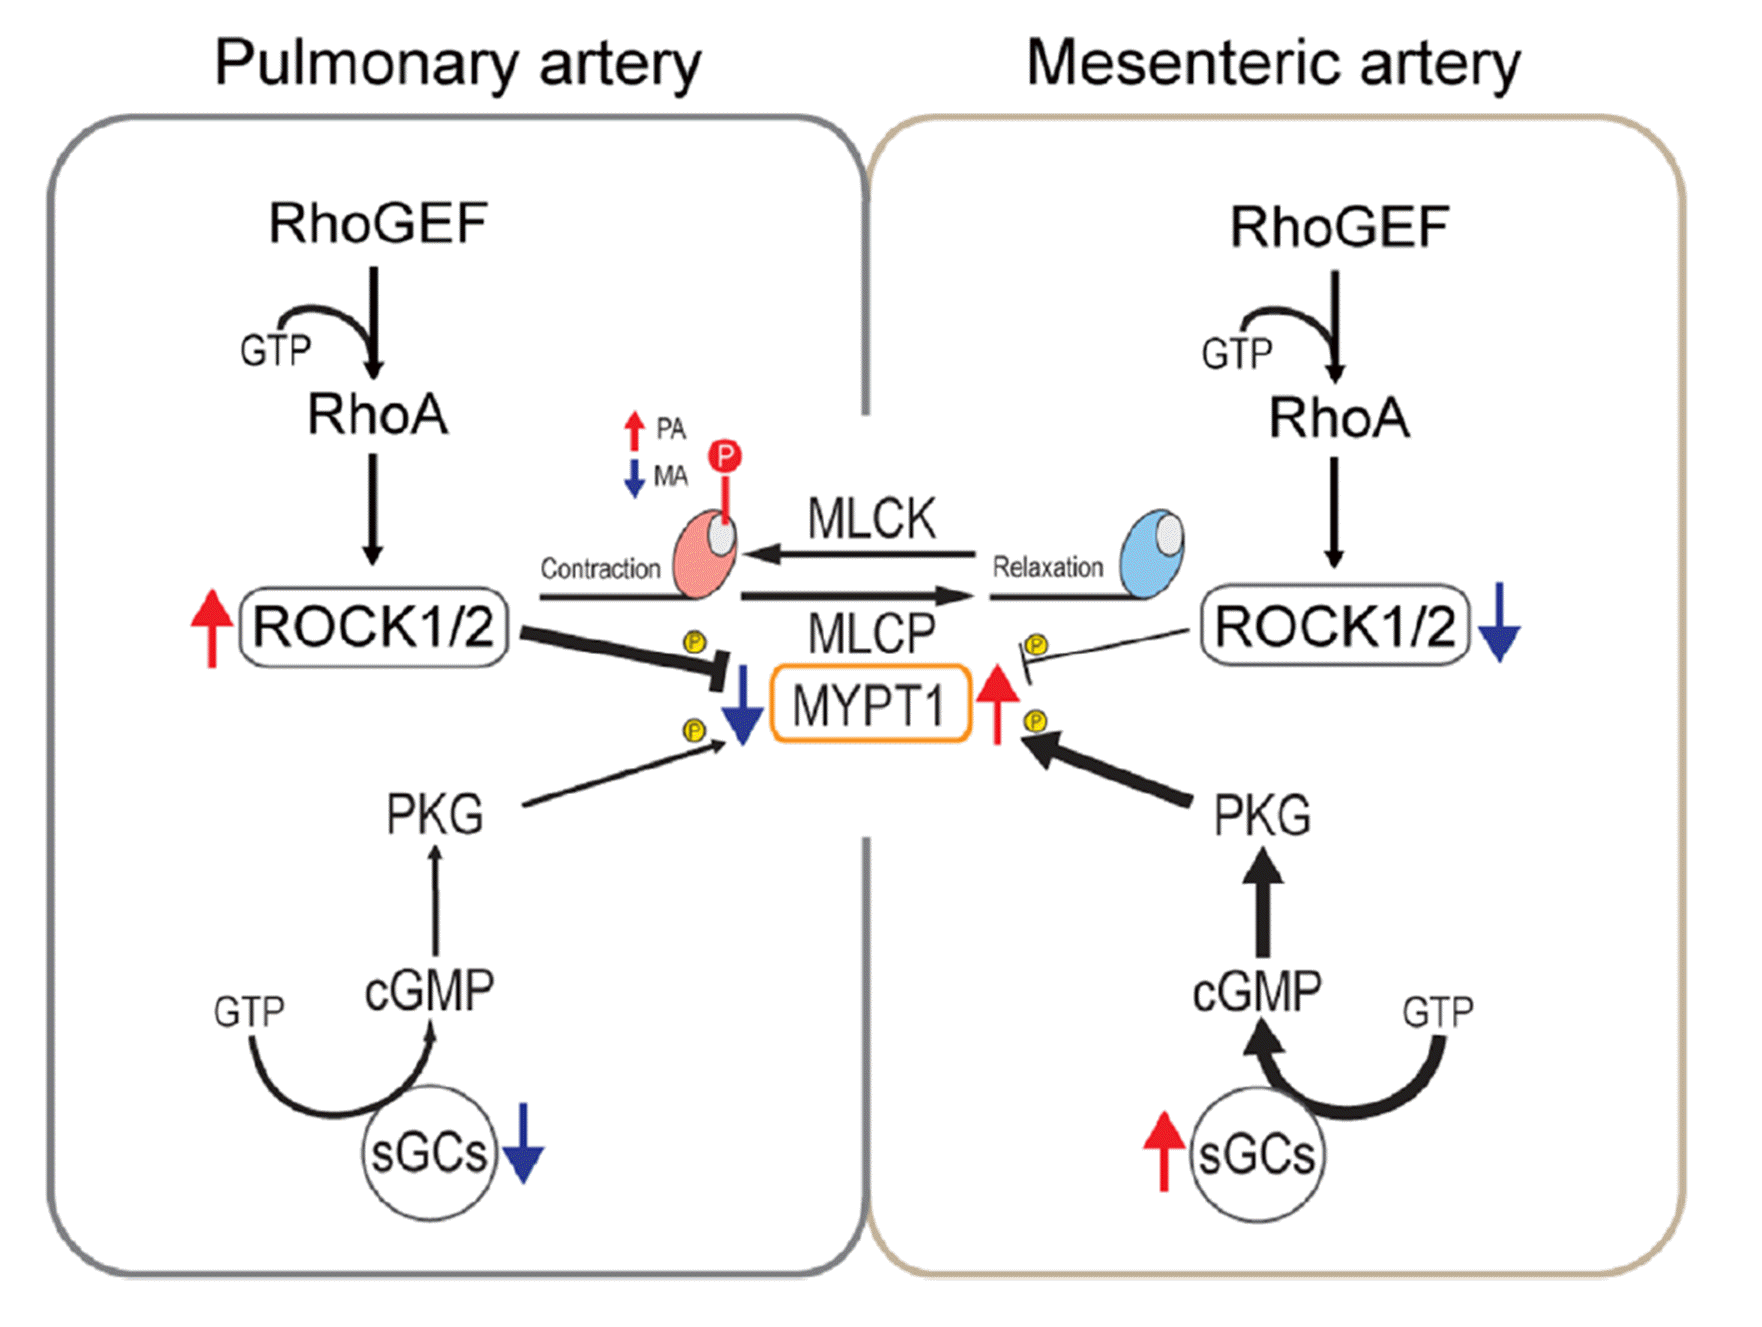
Since the physiological blood pressure in the pulmonary circulation is only 10%–15% of that in the systemic circulation, it is generally assumed PAs would exhibit lower contraction than systemic arteries of similar diameter. However, as shown in our present study, the amplitude of 80K-contraction was not significantly different. In contrast, the relaxation kinetics were markedly slower in PA compared to MA (Fig. 2). As further discussed below, it strongly suggested that the differential expression of enzymes regulating the level of pp-MLC2 is responsible for the distinguishable kinetics of relaxation (Fig. 5).
The physiological implication of the slower relaxation might be associated with the unique structure of the pulmonary capillaries surrounding the extremely thin alveolar wall. Since an abrupt increase or fluctuation in capillary pressure could be harmful to the fragile structure of the alveolar capillary net, the characteristic slow relaxation of PA might act as a damper for pressure changes in the proximal parts of the pulmonary circulation.
Firstly, we demonstrate that the di-phosphorylated state of MLC2 is intrinsically detectable and higher in the PA smooth muscle than in MA smooth muscle. Furthermore, the 80K-induced increase of pp-MLC normalized to the total MLC2 was more prominent in PA than MA (Fig. 3A, C). It is known that pp-MLC2 occurs through activation of ROCK and/or inhibition of MLCP [12].
The membrane depolarizing condition such as 80K solution, is conventionally used in experiments for Ca2+-dependent contraction via the Ca2+/calmodulin/MLCK pathway. However, apart from MLCK, however, the recruitment of ROCK has also been demonstrated in the tonic phase of high K+ contraction in arterial smooth muscle [28,29] including the rat PA [19].
The heterotrimeric MLCP is consist of a catalytic subunit that functions as a type 1c phosphoprotein phosphatase (PP1c) along with a regulatory subunit MYPT1 that is linked to M20, an accessory subunit of 20 kDa [26]. MYPT1 from smooth muscle cells target PP1cβ to myosin, thereby enhancing protein phosphatase activity towards phosphorylated myosin [30].
As mentioned earlier, MYPT1 is a common target for PKG and ROCK. The activity of MLCP is positively regulated by the cGMP-dependent signaling pathway and negatively regulated by the ROCK or by PKC/CPI-17 signaling cascades, which target the phosphorylation of MYPT1 [24-27].
In this context, the sGC-α and β subunits that form a heterodimer are encoded by separate genes, and predominant expression of sGC-α and β has been described in different cell types or tissues [31,32]. The regulation of sGC-β subunit with prosthetic heme group that constitutes the binding site for NO expression is important factor in sGC activity under physiological and pathophysiological conditions. In rat anterior pituitary, 17β-estradiol acute treatment differentially regulates sGC subunit, augmenting sGC-α1 and decreasing β1 subunit expression and decreasing sGC activity [33-35]. Therefore, the characteristics of PA, the lower sGC-β1 despite the higher sGC-α than those in MA, may result in relatively down-regulating global sGC activity and slow relaxation after 80K-contraction (Fig. 5).
Another notable difference can be observed in the length-tension relations; the active tension response can be elicited with larger increase in diameter in PA than in MA (Fig. 1C). The wider range of passive length increase allowing the active contractile response was an unexpected finding for the PA exposed to physiologically lower blood pressure. It might be physiologically relevant to the differential range of the volume change between PA and MA. Since the pulmonary circulation is equivalent to the whole components of systemic circulation comprised of numerous parallel paths to multiple organs, the relative change in blood volume during various levels of physiological activity could be larger in PA than in MA. In this respect, the wider range of circumferential stretch for the active contractile response might have a physiological implication for pulmonary blood flow regulation. However, further investigation is required to validate the hypothetical implication of the unique contractility of PA.
REFERENCES
1. Guyton AC, Hall JE. 2000. Textbook of medical physiology. 10th ed. Saunders;DOI: 10.5005/jp/books/12961.
2. Patton HD. 1989. Textbook of physiology: excitable cells and neurophysiology. W. B. Saunders.
3. Townsley MI. 2012; Structure and composition of pulmonary arteries, capillaries, and veins. Compr Physiol. 2:675–709. DOI: 10.1002/cphy.c100081. PMID: 23606929. PMCID: PMC3630377.
4. Suresh K, Shimoda LA. 2016; Lung circulation. Compr Physiol. 6:897–943. DOI: 10.1002/cphy.c140049. PMID: 27065170. PMCID: PMC7432532.
5. Nelson MT, Patlak JB, Worley JF, Standen NB. 1990; Calcium channels, potassium channels, and voltage dependence of arterial smooth muscle tone. Am J Physiol. 259:C3–C18. DOI: 10.1152/ajpcell.1990.259.1.C3. PMID: 2164782.
6. Dorn GW 2nd, Becker MW. 1993; Thromboxane A2 stimulated signal transduction in vascular smooth muscle. J Pharmacol Exp Ther. 265:447–456. PMID: 8474027.
7. Dupuis J, Jasmin JF, Prié S, Cernacek P. 2000; Importance of local production of endothelin-1 and of the ET(B)Receptor in the regulation of pulmonary vascular tone. Pulm Pharmacol Ther. 13:135–140. DOI: 10.1006/pupt.2000.0242. PMID: 10873551.
8. Muramatsu M, Rodman DM, Oka M, McMurtry IF. 1997; Endothelin-1 mediates nitro-L-arginine vasoconstriction of hypertensive rat lungs. Am J Physiol. 272:L807–L812. DOI: 10.1152/ajplung.1997.272.5.L807. PMID: 9176242.
9. Kim HJ, Yoo HY. 2016; Hypoxic pulmonary vasoconstriction and vascular contractility in monocrotaline-induced pulmonary arterial hypertensive rats. Korean J Physiol Pharmacol. 20:641–647. DOI: 10.4196/kjpp.2016.20.6.641. PMID: 27847441. PMCID: PMC5106398.
10. Boron WF, Boulpaep EL. 2016. Medical physiology. 3rd ed. Elsevier.
11. Ogut O, Brozovich FV. 2003; Regulation of force in vascular smooth muscle. J Mol Cell Cardiol. 35:347–355. DOI: 10.1016/S0022-2828(03)00045-2. PMID: 12689814.
12. Walsh MP. 2011; Vascular smooth muscle myosin light chain diphosphorylation: mechanism, function, and pathological implications. IUBMB Life. 63:987–1000. DOI: 10.1002/iub.527. PMID: 21990256.
13. Takeya K, Wang X, Sutherland C, Kathol I, Loutzenhiser K, Loutzenhiser RD, Walsh MP. 2014; Involvement of myosin regulatory light chain diphosphorylation in sustained vasoconstriction under pathophysiological conditions. J Smooth Muscle Res. 50:18–28. DOI: 10.1540/jsmr.50.18. PMID: 24770446. PMCID: PMC5137258.
14. Katsumata N, Shimokawa H, Seto M, Kozai T, Yamawaki T, Kuwata K, Egashira K, Ikegaki I, Asano T, Sasaki Y, Takeshita A. 1997; Enhanced myosin light chain phosphorylations as a central mechanism for coronary artery spasm in a swine model with interleukin-1beta. Circulation. 96:4357–4363. DOI: 10.1161/01.CIR.96.12.4357. PMID: 9416904.
15. Shimokawa H, Seto M, Katsumata N, Amano M, Kozai T, Yamawaki T, Kuwata K, Kandabashi T, Egashira K, Ikegaki I, Asano T, Kaibuchi K, Takeshita A. 1999; Rho-kinase-mediated pathway induces enhanced myosin light chain phosphorylations in a swine model of coronary artery spasm. Cardiovasc Res. 43:1029–1039. DOI: 10.1016/S0008-6363(99)00144-3. PMID: 10615430.
16. Obara K, Nishizawa S, Koide M, Nozawa K, Mitate A, Ishikawa T, Nakayama K. 2005; Interactive role of protein kinase C-delta with rho-kinase in the development of cerebral vasospasm in a canine two-hemorrhage model. J Vasc Res. 42:67–76. DOI: 10.1159/000083093. PMID: 15637442.
17. Mam V, Tanbe AF, Vitali SH, Arons E, Christou HA, Khalil RA. 2010; Impaired vasoconstriction and nitric oxide-mediated relaxation in pulmonary arteries of hypoxia- and monocrotaline-induced pulmonary hypertensive rats. J Pharmacol Exp Ther. 332:455–462. DOI: 10.1124/jpet.109.160119. PMID: 19915069. PMCID: PMC2812110.
18. Cho S, Namgoong H, Kim HJ, Vorn R, Yoo HY, Kim SJ. 2021; Downregulation of soluble guanylate cyclase and protein kinase G with upregulated ROCK2 in the pulmonary artery leads to thromboxane A2 sensitization in monocrotaline-induced pulmonary hypertensive rats. Front Physiol. 12:624967. DOI: 10.3389/fphys.2021.624967. PMID: 33613315. PMCID: PMC7886809. PMID: 00b95703ee6b4f56a2d6b576348acf9c.
19. Cho S, Oh SB, Kim HJ, Kim SJ. 2023; T18/S19 diphosphorylation of myosin regulatory light chain impairs pulmonary artery relaxation in monocrotaline-induced pulmonary hypertensive rats. Pflugers Arch. 475:1097–1112. DOI: 10.1007/s00424-023-02836-6. PMID: 37422604.
20. Schermuly RT, Stasch JP, Pullamsetti SS, Middendorff R, Müller D, Schlüter KD, Dingendorf A, Hackemack S, Kolosionek E, Kaulen C, Dumitrascu R, Weissmann N, Mittendorf J, Klepetko W, Seeger W, Ghofrani HA, Grimminger F. 2008; Expression and function of soluble guanylate cyclase in pulmonary arterial hypertension. Eur Respir J. 32:881–891. DOI: 10.1183/09031936.00114407. PMID: 18550612.
21. Shimizu T, Fukumoto Y, Tanaka S, Satoh K, Ikeda S, Shimokawa H. 2013; Crucial role of ROCK2 in vascular smooth muscle cells for hypoxia-induced pulmonary hypertension in mice. Arterioscler Thromb Vasc Biol. 33:2780–2791. DOI: 10.1161/ATVBAHA.113.301357. PMID: 24135024.
22. Sutherland C, Walsh MP. 2012; Myosin regulatory light chain diphosphorylation slows relaxation of arterial smooth muscle. J Biol Chem. 287:24064–24076. DOI: 10.1074/jbc.M112.371609. PMID: 22661704. PMCID: PMC3397833.
23. Pfitzer G. 2001; Invited review: regulation of myosin phosphorylation in smooth muscle. J Appl Physiol (1985). 91:497–503. DOI: 10.1152/jappl.2001.91.1.497. PMID: 11408468.
24. Kimura K, Ito M, Amano M, Chihara K, Fukata Y, Nakafuku M, Yamamori B, Feng J, Nakano T, Okawa K, Iwamatsu A, Kaibuchi K. 1996; Regulation of myosin phosphatase by Rho and Rho-associated kinase (Rho-kinase). Science. 273:245–248. DOI: 10.1126/science.273.5272.245. PMID: 8662509.
25. Somlyo AP, Somlyo AV. 2003; Ca2+ sensitivity of smooth muscle and nonmuscle myosin II: modulated by G proteins, kinases, and myosin phosphatase. Physiol Rev. 83:1325–1358. DOI: 10.1152/physrev.00023.2003. PMID: 14506307.
26. Butler T, Paul J, Europe-Finner N, Smith R, Chan EC. 2013; Role of serine-threonine phosphoprotein phosphatases in smooth muscle contractility. Am J Physiol Cell Physiol. 304:C485–C504. DOI: 10.1152/ajpcell.00161.2012. PMID: 23325405.
27. Grassie ME, Sutherland C, Ulke-Lemée A, Chappellaz M, Kiss E, Walsh MP, MacDonald JA. 2012; Cross-talk between Rho-associated kinase and cyclic nucleotide-dependent kinase signaling pathways in the regulation of smooth muscle myosin light chain phosphatase. J Biol Chem. 287:36356–36369. DOI: 10.1074/jbc.M112.398479. PMID: 22948155. PMCID: PMC3476302.
28. Sakamoto K, Hori M, Izumi M, Oka T, Kohama K, Ozaki H, Karaki H. 2003; Inhibition of high K+-induced contraction by the ROCKs inhibitor Y-27632 in vascular smooth muscle: possible involvement of ROCKs in a signal transduction pathway. J Pharmacol Sci. 92:56–69. DOI: 10.1254/jphs.92.56. PMID: 12832856.
29. Mita M, Yanagihara H, Hishinuma S, Saito M, Walsh MP. 2002; Membrane depolarization-induced contraction of rat caudal arterial smooth muscle involves Rho-associated kinase. Biochem J. 364:431–440. DOI: 10.1042/bj20020191. PMID: 12023886. PMCID: PMC1222588.
30. Alessi D, MacDougall LK, Sola MM, Ikebe M, Cohen P. 1992; The control of protein phosphatase-1 by targetting subunits. The major myosin phosphatase in avian smooth muscle is a novel form of protein phosphatase-1. Eur J Biochem. 210:1023–1035. DOI: 10.1111/j.1432-1033.1992.tb17508.x. PMID: 1336455.
31. Shi F, Stewart RL Jr, Perez E, Chen JY, LaPolt PS. 2004; Cell-specific expression and regulation of soluble guanylyl cyclase alpha 1 and beta 1 subunits in the rat ovary. Biol Reprod. 70:1552–1561. DOI: 10.1095/biolreprod.103.025510. PMID: 14749300.
32. Stuehr DJ, Misra S, Dai Y, Ghosh A. 2021; Maturation, inactivation, and recovery mechanisms of soluble guanylyl cyclase. J Biol Chem. 296:100336. DOI: 10.1016/j.jbc.2021.100336. PMID: 33508317. PMCID: PMC7949132.
33. Kostic TS, Andric SA, Stojilkovic SS. 2004; Receptor-controlled phosphorylation of alpha 1 soluble guanylyl cyclase enhances nitric oxide-dependent cyclic guanosine 5'-monophosphate production in pituitary cells. Mol Endocrinol. 18:458–470. DOI: 10.1210/me.2003-0015. PMID: 14630997.
34. Cabilla JP, Díaz Mdel C, Machiavelli LI, Poliandri AH, Quinteros FA, Lasaga M, Duvilanski BH. 2006; 17 beta-estradiol modifies nitric oxide-sensitive guanylyl cyclase expression and down-regulates its activity in rat anterior pituitary gland. Endocrinology. 147:4311–4318. DOI: 10.1210/en.2006-0367. PMID: 16740976.
35. Cabilla JP, Ronchetti SA, Nudler SI, Miler EA, Quinteros FA, Duvilanski BH. 2009; Nitric oxide sensitive-guanylyl cyclase subunit expression changes during estrous cycle in anterior pituitary glands. Am J Physiol Endocrinol Metab. 296:E731–E737. DOI: 10.1152/ajpendo.90795.2008. PMID: 19141686.
Fig. 1
Comparison of mechanical characteristics and length-tension property between PAs and MAs.
(A) Representative images of isolated PA and MA mounted for myography. (B) Summary of the length and inner diameter (I.D.) of PAs (n = 9, N = 3) and MAs (n = 8, N = 3). (C) Representative traces showing the active and passive tension recording procedure. Step-like increase of I.D. is indicated by upward arrow with ‘S’. After confirming a quasi-steady state passive tension, 80 mM KCl (80K) was applied to induce an active tension increase, which was reversed by washout with PSS. (D, E) The relationship between the calculated inner circumferential length (I.C.) and tension (both active and passive) of PAs (n = 9, N = 4) and MAs (n = 8, N = 4). Data are presented as means ± SD. PA, pulmonary artery; MA, mesenteric artery; PSS, physiological salt solution.
Fig. 2
Properties of the K+-induced contraction and the relaxation by washout in PAs and MAs.
(A) Representative original traces showing contractions induced by cumulative increase of [K+]ext in PA and MA. A standard contraction by 80K was commonly induced at the initial phase of each experiment. Note that MA showed more prominent spontaneous relaxation under the raised [K+]ext. (B) Representative original trace of 80K-contraction and the summary of peak amplitude of active tension increase in PAs (n = 16, N = 5) and MAs (n = 10, N = 4). Note the marked difference of the relaxation speed by washout with PSS. (C) The summary of peak amplitudes from PAs and MAs. (D) Summary of the traces of relaxation phase normalized to the peak amplitude of the 80K-contraction (Norm.T/T80K). (E) The 50% and 75% relaxation time to baseline (t1/2 and t3/4, in sec) was measured in each vessel and summarized for the comparison. Data are presented as means ± SD. PA, pulmonary artery; MA, mesenteric artery; PSS, physiological salt solution. **p < 0.01, ***p < 0.001, using two-tailed Student’s t-test.
Fig. 3
Expression of MLC2, p-MLC2, pp-MLC2 and cGMP-dependent signaling molecules in PAs and MAs.
(A) Western blot analysis of mono- and di-phosphorylated states of MLC2 in PAs and MAs. (B) Summary of total MLC2 expression normalized to β-actin and the levels of p-MLC2 (S19-p) and pp-MLC2 (T18/S19-pp) normalized to the expression of MLC2. (C) Representative immunoblot analysis of sGCα, sGCβ, PKG, ROCK1, ROCK2 and MYPT1 in PAs and Mas. (D) Summary of the protein levels normalized to β-actin. (E) Western blot analysis of phosphorylated states of MLC2 induced by 80K and the effect of pretreatment with Y27632 (10 µM) in PAs and MAs. (F) Summary of normalized levels of p-MLC2 (left panel) and pp-MLC2 (right panel). Data are means ± SD. PA, pulmonary artery; MA, mesenteric artery; PSS, physiological salt solution. *p < 0.05, **p < 0.01, using two-tailed Student’s t-test and one-way ANOVA test.
Fig. 4
Pharmacological vasodilatory response in PAs and MAs treated with sGC inhibitor and its recovery by ROCK inhibitor.
(A) Representative traces of 80K-contraction and response to washout with or without pretreatment with ODQ in the PA (left panel) and MA (right panel). (B) The relaxation times (t1/2 and t3/4, in sec) were measured in each vessel and summarized for the comparison (PA; n = 6, N = 3, MA; n = 6, N = 3). (C) Representative traces of 80K-contraction treated with ODQ and response to washout with or without pretreatment with Y27632 in the PA (left panel) and MA (right panel). (D) The relaxation time to baseline (t1/2 and t3/4, in sec) was measured in each vessel and summarized for the comparison (PA; n = 5, N = 3, MA; n = 5, N = 3). (E) Representative traces of 80K-contraction and response to washout with or without pretreatment with Y27632 in the PA. (F) The summary of t1/2 and t3/4 (sec) for PAs and further comparison with MAs (PA; n = 5, N = 2, MA; n = 9, N = 4). Data are means ± SD. PA, pulmonary artery; MA, mesenteric artery; PSS, physiological salt solution. *p < 0.05, **p < 0.01, ***p < 0.001, using two-tailed Student’s t-test and one-way ANOVA test.
Fig. 5
A schematic diagram of the regulatory pathways for MLC phosphorylation in smooth muscle comparing the relative expressions between PA and MA.
Higher level of ROCK2 with lower levels of sGC and MYPT1 in PA than MA would lead to the higher level of basal MLC diphosphorylation and slower relaxation property of PA than MA. PA, pulmonary artery; MA, mesenteric artery.


 PDF
PDF Citation
 Print
Print


 XML Download