Journal List > J Korean Med Sci > v.38(44) > 1516084563

Woo and Kim: Regional Disparities in the Infant Mortality Rate in Korea Between 2001 and 2021

Abstract

Background

The infant mortality rate (IMR) has been considered an important indicator of the overall public health level. Despite improvements in recent decades, regional inequalities in the IMR have been reported worldwide. However, there are no Korean epidemiological studies on regional disparities in the IMR.

Methods

We extracted causes of death data from the Statistics Korea through the Korean Statistical Information Service database between 2001 and 2021. The total and regional IMRs were calculated to determine regional disparities. Based on causes of death and using Seoul as a reference, the excess infant deaths and population attributable fractions (PAFs) were calculated for 15 other metropolitan cities and provinces. The average annual percent changes by region from 2001 to 2021 were obtained using a joinpoint regression program. To assess inequities in IMR trends, the rate ratios (RRs) and rate differences (RDs) of the 15 regions were calculated by dividing the study period into period 1 (2001–2007), period 2 (2008–2014), and period 3 (2015–2021).

Results

The overall IMR in Korea was 3.64 per 1,000 live births, and the IMRs in the 14 regions were relatively higher than that in Seoul, with RRs ranging from 1.15 (95% confidence interval [CI], 1.04, 1.27) in Jeju-do to 1.62 (95% CI, 1.54, 1.71) in Daegu, over the total study period. Significant differences in infant deaths by region were observed for all causes of death, with PAFs ranging from 2.2% (95% CI, 1.7, 2.6) in Gyeonggi-do to 38.4% (95% CI, 38.1, 38.6) in Daegu. The leading cause of excess infant deaths was perinatal problems. The IMR disparities in the relative and absolute measures decreased from 1.44 (1.34, 1.54) to 1.21 (1.10, 1.31) for RRs and from 0.79 (0.63, 0.96) to 0.30 (0.15, 0.45) for RDs between periods 1 and 2, followed by an increase from 1.21 (1.10, 1.31) to 1.36 (1.21, 1.53) for RRs and from 0.30 (0.15, 0.45) to 0.51(0.36, 0.67) for RDs between period 2 and 3.

Conclusion

Infant death is associated with place of residence and regional gaps have recently widened again in Korea. An in-depth investigation of the causes of regional disparities in infant mortality is required for effective governmental policies to achieve equality in infant health.

Graphical Abstract

jkms-38-e367-abf001.jpg

INTRODUCTION

The infant mortality rate (IMR) is defined as the number of infants who die within the first year of life for every 1,000 live births in a given period. The IMR is considered a key indicator of the overall public health level because it has a strong correlation with medical factors such as infection and the quality of pre- and postnatal care as well as nonmedical exogenous factors such as nutrition, culture, and socioeconomic determinants of health.1
Although the IMR has significantly declined worldwide in recent decades, it has been reported that inequalities and disparities in the IMR still exist across and even within countries, with variations by race, ethnicity, state, and region. In the United States, infants born to black, non-Hispanic women had the highest IMR, and significant differences in infant mortality by state were also observed.234 The United Kingdom, Japan, Canada and China also have substantial geographic disparities in infant deaths associated with region and rurality.5678 Therefore, governmental efforts to reduce the gap in the IMR, including understanding the differences in infant mortality due to various factors and establishing proper interventions to reduce preventable infant deaths, are ongoing challenges in many countries.
Despite homogeneity of race, ethnicity, culture and geography in Korea, regional disparities in the overall public health level have been reported.910 Although the IMR has improved over time in Korea, little is known about regional differences in the IMR.11121314 Recently, pediatric departments have been experiencing a medical crisis due to the rapidly decreasing application rate of pediatric residents, resulting in a shortage of pediatricians.1516 Many hospitals have decided to temporarily not offer pediatric emergency, intensive care or hospitalization treatment due to a lack of medical staff, especially in noncapital areas.15 This phenomenon exacerbates regional inequalities in pediatric care accessibility and, in turn, may increase regional disparities in the IMR in Korea. A better understanding of the regional differences in the IMR is essential to establish proper interventions to resolve IMR disparities and reduce preventable infant deaths as well as to indirectly estimate the differences in the overall public health level among regions. However, little is known about regional differences in the IMR, and there are no studies that have well described descriptive statistics on regional disparities in the IMR in Korea.
Therefore, in this study, we aimed to examine whether there are regional disparities in the overall and cause-specific IMR in Korea using vital statistics. We also investigated the differences in IMR trends by region in terms of both rate differences (RDs) and rate ratios (RRs).

METHODS

Data sources

All mortality and population data were extracted from the Korean Statistical Information Service database between 2001 and 2021. The number of deaths at age 0 by the underlying cause of death based on International Classification of Diseases 10th Revision codes was extracted for each year and region. Population data by region were obtained from the mid-year population for each year. The level of regional classification was limited to 17 administrative divisions (provinces and metropolitan cities) for data stability. However, Sejong was excluded from the present study, which started generating data after 2012, so we only calculated IMRs between 2012 and 2021. Since 2001, vital statistics have been supplemented through infant cremation report data and neonatal death data. Therefore, data before 2001, which were many missing infant deaths, were excluded from the analysis.9

Statistical analysis

First, the average IMRs per 1,000 population by region were calculated from 2001 to 2021 to determine whether there were regional disparities in the IMR in Korea. The relative regional disparities in the IMR were identified through the RRs using the region with the lowest IMR as a reference group. The standard errors were calculated using the Taylor series expansion method to obtain the 95% confidence intervals (CIs) of the RR.17
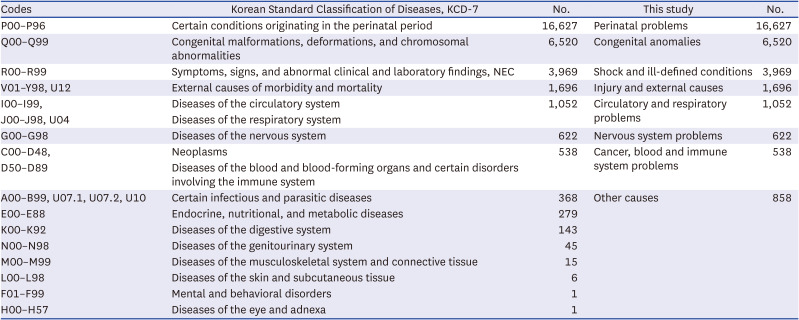
Second, infant mortality attributable to regional disparities between 2001 and 2021 was analyzed by cause of death. The cause of death was classified, considering the number of infant deaths by cause in Korea between 2001 and 2021 and clinical relevance (Table 1). The expected number of deaths was calculated by applying the IMR of the reference group by cause of death to the number of births in each region. The mortality attributable to regional disparities was presented as excess deaths and the region-specific population attributable fraction, defined as the fraction of excess deaths divided by observed deaths compared with the reference group. The 95% CIs of the fraction were obtained using Monte Carlo simulation under the assumption of a Poisson distribution.18
Table 1

Causes of death (code classification)

jkms-38-e367-i001
Codes Korean Standard Classification of Diseases, KCD-7 No. This study No.
P00–P96 Certain conditions originating in the perinatal period 16,627 Perinatal problems 16,627
Q00–Q99 Congenital malformations, deformations, and chromosomal abnormalities 6,520 Congenital anomalies 6,520
R00–R99 Symptoms, signs, and abnormal clinical and laboratory findings, NEC 3,969 Shock and ill-defined conditions 3,969
V01–Y98, U12 External causes of morbidity and mortality 1,696 Injury and external causes 1,696
I00–I99, Diseases of the circulatory system 1,052 Circulatory and respiratory problems 1,052
J00–J98, U04 Diseases of the respiratory system
G00–G98 Diseases of the nervous system 622 Nervous system problems 622
C00–D48, Neoplasms 538 Cancer, blood and immune system problems 538
D50–D89 Diseases of the blood and blood-forming organs and certain disorders involving the immune system
A00–B99, U07.1, U07.2, U10 Certain infectious and parasitic diseases 368 Other causes 858
E00–E88 Endocrine, nutritional, and metabolic diseases 279
K00–K92 Diseases of the digestive system 143
N00–N98 Diseases of the genitourinary system 45
M00–M99 Diseases of the musculoskeletal system and connective tissue 15
L00–L98 Diseases of the skin and subcutaneous tissue 6
F01–F99 Mental and behavioral disorders 1
H00–H57 Diseases of the eye and adnexa 1
Finally, an analysis of regional disparities in IMR trends was conducted. Previous studies have reported that the IMR in Korea has been continuously declining, and we analyzed the IMR trend in 16 provinces and metropolitan cities using the Joinpoint regression method to confirm whether the IMR trends in each region are similar.11121314 The annual percent change (APC) in the IMR by region was calculated. More specifically, a maximum of two join points was set for each model, and the average APCs (AAPCs) were calculated for each segment.1920 Joinpoint regression can analyze decreasing trends in infant mortality by region, but it is difficult to accurately represent regional disparities in infant mortality trends. Therefore, the 21-year period from 2001 to 2021 was divided into 3 periods of 7 years each (period 1: 2001–2007, period 2: 2008–2014, period 3: 2015–2021), and the relative and absolute difference trends were examined to obtain the RRs and RDs in the IMR trend by region compared to those of the reference group. Monte-Carlo simulation was performed using R version 4.2.2, and Joinpoint Regression Program version 4.9.1.0 (National Cancer Institute, Bethesda, MD, USA) was used for Joinpoint regression analysis.

Ethics statement

The Institutional Review Board (IRB) of Kyungpook National University Chilgok Hospital reviewed the protocol of this study and approved an exemption, the requirement for informed consent was waived because of the nature of public data from the Korean Statistical Information Service database (IRB No. 2023-02-006).

RESULTS

Regional disparities in the IMR between 2001 and 2021

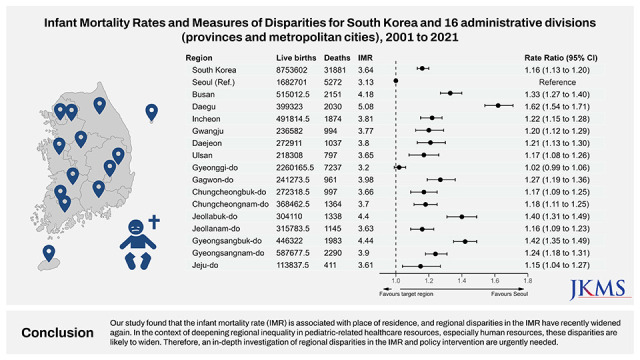
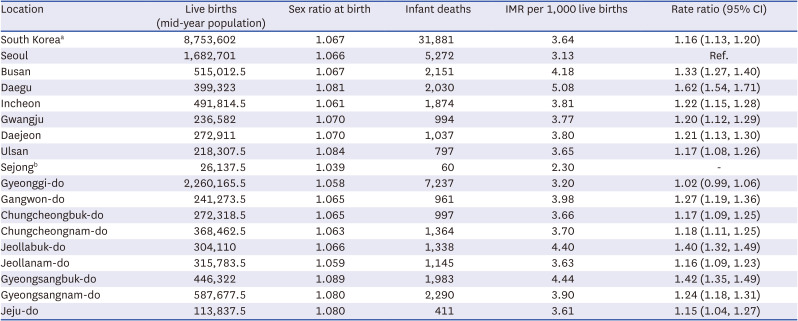
Excluding Sejong, there were a total of 8,753,602 live births and 31,881 infant deaths in Korea from 2001 to 2021. The overall IMR in Korea was 3.64 per 1,000 live births between 2001 and 2021. Significant regional differences in IMRs were observed over the study period, and the IMR in metropolitan cities and provinces ranged from 3.13 per 1,000 live births in Seoul to 5.08 per 1,000 live births in Daegu.
The relative regional disparities in the IMR in Korea were assessed with RRs and 95% CIs and compared between Seoul, which was defined as the reference group because it had the lowest IMR in Korea, and the other 15 regions. The 14 regions showed significantly higher IMRs than Seoul, with RRs ranging from 1.15 (95% CI, 1.04–1.27) in Jeju-do to 1.62 (95% CI, 1.54–1.71) in Daegu. Only the IMR in Gyonggi-do, which is located adjacent to Seoul and one of the Seoul Capital Areas, was not significantly different compared to that of Seoul (RR, 1.02; 95% CI, 0.99–1.06). Interestingly, Gyeongsangbuk-do, which is located adjacent to Daegu and often referred to as Daegu-Gyeougbuk, had the second highest IMR (4.44 per 1,000 live births) and RR (RR, 1.42; 95% CI, 1.35–1.49). The IMRs in Jeollabuk-do (RR, 1.40; 95% CI, 1.32–1.49), Busan (RR, 1.33; 95% CI, 1.27–1.40), and Gangwon-do (RR, 1.27; 95% CI, 1.19–1.36) were also relatively high (Table 2).
Table 2

IMRs and measures of disparities for South Korea and 17 administrative divisions (provinces and metropolitan cities) (2001–2021)

jkms-38-e367-i002
Location Live births (mid-year population) Sex ratio at birth Infant deaths IMR per 1,000 live births Rate ratio (95% CI)
South Koreaa 8,753,602 1.067 31,881 3.64 1.16 (1.13, 1.20)
Seoul 1,682,701 1.066 5,272 3.13 Ref.
Busan 515,012.5 1.067 2,151 4.18 1.33 (1.27, 1.40)
Daegu 399,323 1.081 2,030 5.08 1.62 (1.54, 1.71)
Incheon 491,814.5 1.061 1,874 3.81 1.22 (1.15, 1.28)
Gwangju 236,582 1.070 994 3.77 1.20 (1.12, 1.29)
Daejeon 272,911 1.070 1,037 3.80 1.21 (1.13, 1.30)
Ulsan 218,307.5 1.084 797 3.65 1.17 (1.08, 1.26)
Sejongb 26,137.5 1.039 60 2.30 -
Gyeonggi-do 2,260,165.5 1.058 7,237 3.20 1.02 (0.99, 1.06)
Gangwon-do 241,273.5 1.065 961 3.98 1.27 (1.19, 1.36)
Chungcheongbuk-do 272,318.5 1.065 997 3.66 1.17 (1.09, 1.25)
Chungcheongnam-do 368,462.5 1.063 1,364 3.70 1.18 (1.11, 1.25)
Jeollabuk-do 304,110 1.066 1,338 4.40 1.40 (1.32, 1.49)
Jeollanam-do 315,783.5 1.059 1,145 3.63 1.16 (1.09, 1.23)
Gyeongsangbuk-do 446,322 1.089 1,983 4.44 1.42 (1.35, 1.49)
Gyeongsangnam-do 587,677.5 1.080 2,290 3.90 1.24 (1.18, 1.31)
Jeju-do 113,837.5 1.080 411 3.61 1.15 (1.04, 1.27)
IMR = infant mortality rate, CI = confidence interval.
aExcept Sejong; b2012–2021.

Total and cause-specific excess infant mortality by region

Between 2001 and 2021, 14.0% (95% CI, 13.6–14.4) of infant deaths in Korea were attributable to regional disparities. If Seoul's IMR was applied to all live births in Korea, 4,455 infant deaths could have been prevented. In Korea, 16.1% of the deaths due to perinatal problems (P00–P96), 6.3% of the deaths due to congenital anomalies (Q00–Q99), 8.3% of the deaths due to shock and ill-defined conditions (R00–R99), 35.9% of the deaths due to injury and external causes (V01–Y89, U12), 19.9% of the deaths due to circulatory and respiratory problems (I00–I99, J00–J98, U04), 11.3% of the deaths due to nervous system problems (G00–G98) and 7.0% of the deaths due to cancer and blood problems (C00–D98) were attributable to regional disparities. If this is expressed as the number of excess deaths compared to Seoul, it corresponds to 2,675, 413, 328, 609, 209, 71, 38, and 114 deaths, respectively. Perinatal problems comprised the greatest portion, accounting for 60% (2,675/4,455) of all excess infant deaths. The main causes of excess infant death were perinatal problems, congenital anomalies and injury and external causes, which accounted for 83% (3,697/4455) of excess infant deaths in Korea (Table 3 and Fig. 1).
Table 3

Infant mortality attributable to regional disparities for South Korea and 16 administrative divisions (2001–2021)
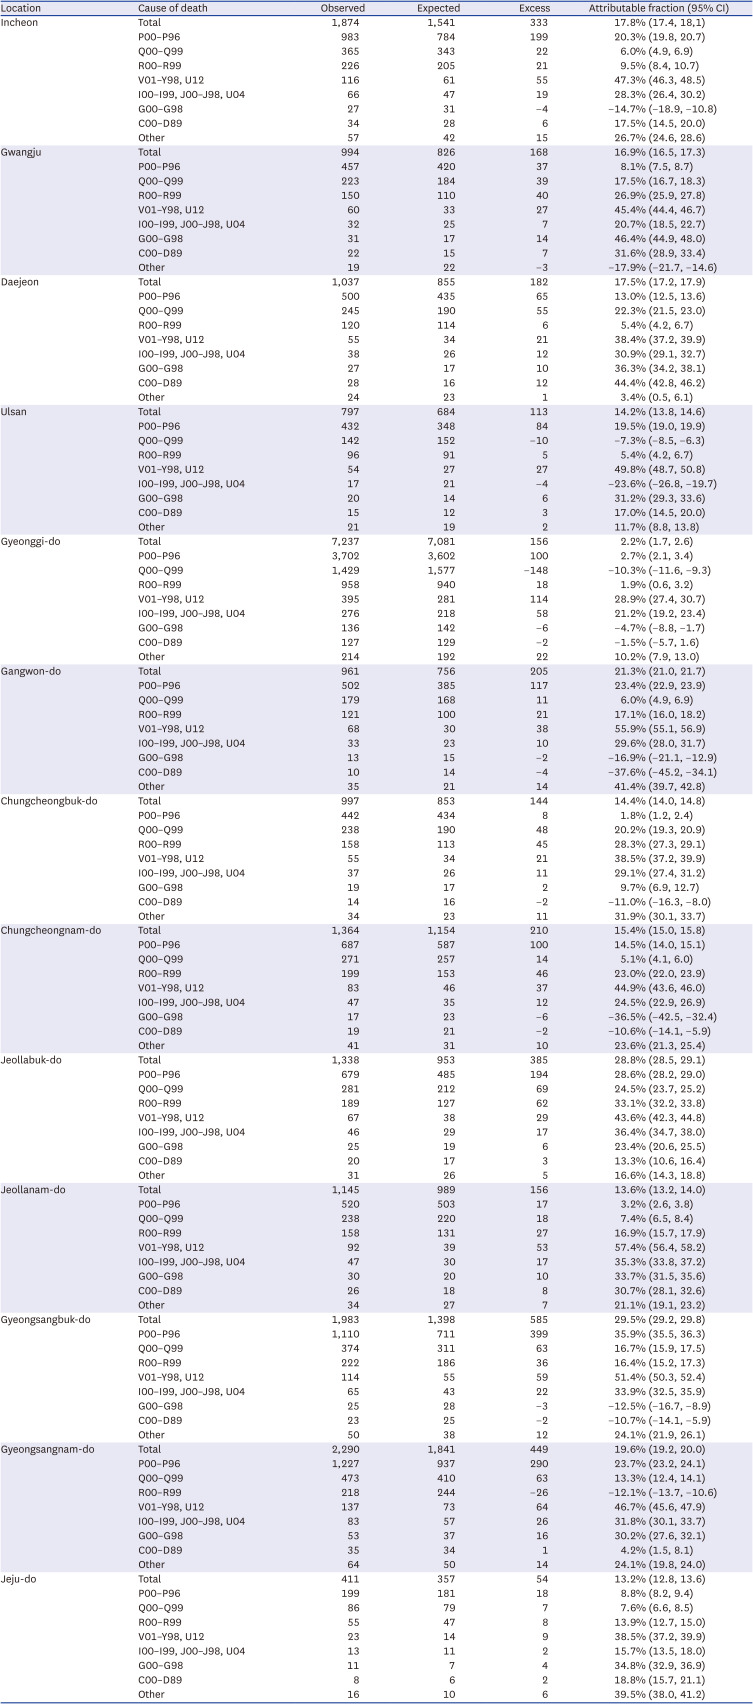
jkms-38-e367-i003
Location Cause of death Observed Expected Excess Attributable fraction (95% CI)
Korea Total 31,881 27,426 4,455 14.0% (13.6, 14.4)
P00–P96 16,627 13,952 2,675 16.1% (15.5, 16.6)
Q00–Q99 6,520 6,107 413 6.3% (5.3, 7.2)
R00–R99 3,969 3,641 328 8.3% (6.9, 9.4)
V01–Y98, U12 1,696 1,087 609 35.9% (34.6, 37.5)
I00–I99, J00–J98, U04 1,052 843 209 19.9% (17.8, 22.0)
G00–G98 622 551 71 11.3% (8.2, 14.1)
C00–D89 537 499 38 7.0% (3.2, 9.7)
Other 858 744 114 13.3% (10.7, 15.5)
Seoul Total 5,272 5,272 0 -
P00–P96 2,682 2,682 0 -
Q00–Q99 1,174 1,174 0 -
R00–R99 700 700 0 -
V01–Y98, U12 209 209 0 -
I00–I99, J00–J98, U04 162 162 0 -
G00–G98 106 106 0 -
C00–D89 96 96 0 -
Other 143 143 0 -
Busan Total 2,151 1,614 537 25.0% (24.7, 25.3)
P00–P96 1,209 821 388 32.1% (31.7, 32.5)
Q00–Q99 459 359 100 21.7% (20.9, 22.4)
R00–R99 240 214 26 10.7% (9.5, 11.9)
V01–Y98, U12 87 64 23 26.5% (24.9, 28.3)
I00–I99, J00–J98, U04 46 50 −4 −7.8% (−11.0, −4.9)
G00–G98 47 32 15 31.0% (28.4, 32.8)
C00–D89 28 29 −1 −4.9% (−9.8, −1.9)
Other 35 44 −9 −25.0% (−29.0, −21.2)
Daegu Total 2,030 1,251 779 38.4% (38.1, 38.6)
P00–P96 1,296 636 660 50.9% (50.6, 51.2)
Q00–Q99 343 279 64 18.8% (17.9, 19.5)
R00–R99 159 166 −7 −4.5% (−6.0, −3.2)
V01–Y98, U12 81 50 31 38.8% (37.5, 40.2)
I00–I99, J00–J98, U04 44 38 6 12.6% (10.4, 15.0)
G00–G98 35 25 10 28.1% (26.0, 30.5)
C00–D89 32 23 9 28.8% (26.3, 30.8)
Other 40 34 6 15.2% (12.5, 17.2)
Incheon Total 1,874 1,541 333 17.8% (17.4, 18,1)
P00–P96 983 784 199 20.3% (19.8, 20.7)
Q00–Q99 365 343 22 6.0% (4.9, 6.9)
R00–R99 226 205 21 9.5% (8.4, 10.7)
V01–Y98, U12 116 61 55 47.3% (46.3, 48.5)
I00–I99, J00–J98, U04 66 47 19 28.3% (26.4, 30.2)
G00–G98 27 31 −4 −14.7% (−18.9, −10.8)
C00–D89 34 28 6 17.5% (14.5, 20.0)
Other 57 42 15 26.7% (24.6, 28.6)
Gwangju Total 994 826 168 16.9% (16.5, 17.3)
P00–P96 457 420 37 8.1% (7.5, 8.7)
Q00–Q99 223 184 39 17.5% (16.7, 18.3)
R00–R99 150 110 40 26.9% (25.9, 27.8)
V01–Y98, U12 60 33 27 45.4% (44.4, 46.7)
I00–I99, J00–J98, U04 32 25 7 20.7% (18.5, 22.7)
G00–G98 31 17 14 46.4% (44.9, 48.0)
C00–D89 22 15 7 31.6% (28.9, 33.4)
Other 19 22 −3 −17.9% (−21.7, −14.6)
Daejeon Total 1,037 855 182 17.5% (17.2, 17.9)
P00–P96 500 435 65 13.0% (12.5, 13.6)
Q00–Q99 245 190 55 22.3% (21.5, 23.0)
R00–R99 120 114 6 5.4% (4.2, 6.7)
V01–Y98, U12 55 34 21 38.4% (37.2, 39.9)
I00–I99, J00–J98, U04 38 26 12 30.9% (29.1, 32.7)
G00–G98 27 17 10 36.3% (34.2, 38.1)
C00–D89 28 16 12 44.4% (42.8, 46.2)
Other 24 23 1 3.4% (0.5, 6.1)
Ulsan Total 797 684 113 14.2% (13.8, 14.6)
P00–P96 432 348 84 19.5% (19.0, 19.9)
Q00–Q99 142 152 −10 −7.3% (−8.5, −6.3)
R00–R99 96 91 5 5.4% (4.2, 6.7)
V01–Y98, U12 54 27 27 49.8% (48.7, 50.8)
I00–I99, J00–J98, U04 17 21 −4 −23.6% (−26.8, −19.7)
G00–G98 20 14 6 31.2% (29.3, 33.6)
C00–D89 15 12 3 17.0% (14.5, 20.0)
Other 21 19 2 11.7% (8.8, 13.8)
Gyeonggi-do Total 7,237 7,081 156 2.2% (1.7, 2.6)
P00–P96 3,702 3,602 100 2.7% (2.1, 3.4)
Q00–Q99 1,429 1,577 −148 −10.3% (−11.6, −9.3)
R00–R99 958 940 18 1.9% (0.6, 3.2)
V01–Y98, U12 395 281 114 28.9% (27.4, 30.7)
I00–I99, J00–J98, U04 276 218 58 21.2% (19.2, 23.4)
G00–G98 136 142 −6 −4.7% (−8.8, −1.7)
C00–D89 127 129 −2 −1.5% (−5.7, 1.6)
Other 214 192 22 10.2% (7.9, 13.0)
Gangwon-do Total 961 756 205 21.3% (21.0, 21.7)
P00–P96 502 385 117 23.4% (22.9, 23.9)
Q00–Q99 179 168 11 6.0% (4.9, 6.9)
R00–R99 121 100 21 17.1% (16.0, 18.2)
V01–Y98, U12 68 30 38 55.9% (55.1, 56.9)
I00–I99, J00–J98, U04 33 23 10 29.6% (28.0, 31.7)
G00–G98 13 15 −2 −16.9% (−21.1, −12.9)
C00–D89 10 14 −4 −37.6% (−45.2, −34.1)
Other 35 21 14 41.4% (39.7, 42.8)
Chungcheongbuk-do Total 997 853 144 14.4% (14.0, 14.8)
P00–P96 442 434 8 1.8% (1.2, 2.4)
Q00–Q99 238 190 48 20.2% (19.3, 20.9)
R00–R99 158 113 45 28.3% (27.3, 29.1)
V01–Y98, U12 55 34 21 38.5% (37.2, 39.9)
I00–I99, J00–J98, U04 37 26 11 29.1% (27.4, 31.2)
G00–G98 19 17 2 9.7% (6.9, 12.7)
C00–D89 14 16 −2 −11.0% (−16.3, −8.0)
Other 34 23 11 31.9% (30.1, 33.7)
Chungcheongnam-do Total 1,364 1,154 210 15.4% (15.0, 15.8)
P00–P96 687 587 100 14.5% (14.0, 15.1)
Q00–Q99 271 257 14 5.1% (4.1, 6.0)
R00–R99 199 153 46 23.0% (22.0, 23.9)
V01–Y98, U12 83 46 37 44.9% (43.6, 46.0)
I00–I99, J00–J98, U04 47 35 12 24.5% (22.9, 26.9)
G00–G98 17 23 −6 −36.5% (−42.5, −32.4)
C00–D89 19 21 −2 −10.6% (−14.1, −5.9)
Other 41 31 10 23.6% (21.3, 25.4)
Jeollabuk-do Total 1,338 953 385 28.8% (28.5, 29.1)
P00–P96 679 485 194 28.6% (28.2, 29.0)
Q00–Q99 281 212 69 24.5% (23.7, 25.2)
R00–R99 189 127 62 33.1% (32.2, 33.8)
V01–Y98, U12 67 38 29 43.6% (42.3, 44.8)
I00–I99, J00–J98, U04 46 29 17 36.4% (34.7, 38.0)
G00–G98 25 19 6 23.4% (20.6, 25.5)
C00–D89 20 17 3 13.3% (10.6, 16.4)
Other 31 26 5 16.6% (14.3, 18.8)
Jeollanam-do Total 1,145 989 156 13.6% (13.2, 14.0)
P00–P96 520 503 17 3.2% (2.6, 3.8)
Q00–Q99 238 220 18 7.4% (6.5, 8.4)
R00–R99 158 131 27 16.9% (15.7, 17.9)
V01–Y98, U12 92 39 53 57.4% (56.4, 58.2)
I00–I99, J00–J98, U04 47 30 17 35.3% (33.8, 37.2)
G00–G98 30 20 10 33.7% (31.5, 35.6)
C00–D89 26 18 8 30.7% (28.1, 32.6)
Other 34 27 7 21.1% (19.1, 23.2)
Gyeongsangbuk-do Total 1,983 1,398 585 29.5% (29.2, 29.8)
P00–P96 1,110 711 399 35.9% (35.5, 36.3)
Q00–Q99 374 311 63 16.7% (15.9, 17.5)
R00–R99 222 186 36 16.4% (15.2, 17.3)
V01–Y98, U12 114 55 59 51.4% (50.3, 52.4)
I00–I99, J00–J98, U04 65 43 22 33.9% (32.5, 35.9)
G00–G98 25 28 −3 −12.5% (−16.7, −8.9)
C00–D89 23 25 −2 −10.7% (−14.1, −5.9)
Other 50 38 12 24.1% (21.9, 26.1)
Gyeongsangnam-do Total 2,290 1,841 449 19.6% (19.2, 20.0)
P00–P96 1,227 937 290 23.7% (23.2, 24.1)
Q00–Q99 473 410 63 13.3% (12.4, 14.1)
R00–R99 218 244 −26 −12.1% (−13.7, −10.6)
V01–Y98, U12 137 73 64 46.7% (45.6, 47.9)
I00–I99, J00–J98, U04 83 57 26 31.8% (30.1, 33.7)
G00–G98 53 37 16 30.2% (27.6, 32.1)
C00–D89 35 34 1 4.2% (1.5, 8.1)
Other 64 50 14 24.1% (19.8, 24.0)
Jeju-do Total 411 357 54 13.2% (12.8, 13.6)
P00–P96 199 181 18 8.8% (8.2, 9.4)
Q00–Q99 86 79 7 7.6% (6.6, 8.5)
R00–R99 55 47 8 13.9% (12.7, 15.0)
V01–Y98, U12 23 14 9 38.5% (37.2, 39.9)
I00–I99, J00–J98, U04 13 11 2 15.7% (13.5, 18.0)
G00–G98 11 7 4 34.8% (32.9, 36.9)
C00–D89 8 6 2 18.8% (15.7, 21.1)
Other 16 10 6 39.5% (38.0, 41.2)
CI = confidence interval.
Fig. 1

Estimated excess number of deaths attributable to regional disparities and disease distribution in Korea.

jkms-38-e367-g001
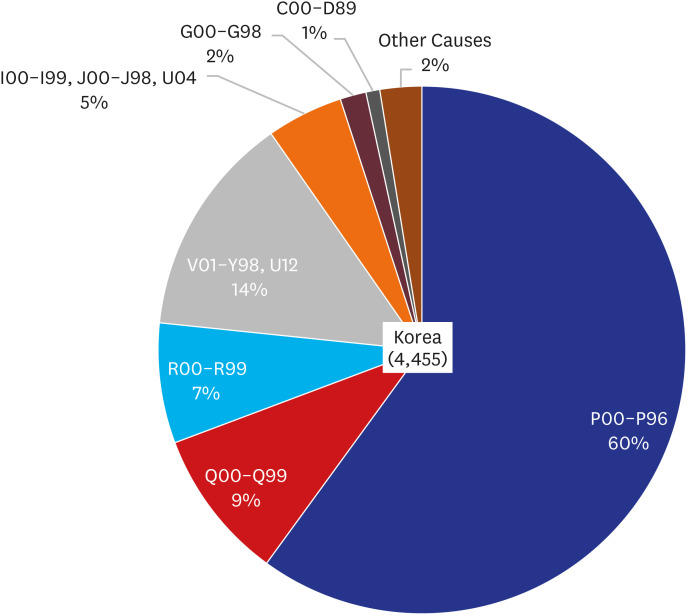
Regional disparities attributable to infant deaths ranged from 2.2% (95% CI, 1.7–2.6) in Gyeonggi-do to 38.4% (95% CI, 38.1–38.6) in Daegu. Perinatal problems were the leading cause of excess infant deaths in all regions except Gwangju, Gyeonggi-do, Chungcheongbuk-do, and Jeollanam-do. In Daegu and Gyeongsangbuk-do, where the number of excess infant deaths was the highest, perinatal problems accounted for 84.7% (660/779) and 68.2% (399/585) of the total excess infant deaths, respectively. Shock and ill-defined conditions in Gwangju, congenital anomalies in Chungcheongbuk-do, and injury and external causes in Gyeonggi-do and Jeollanam-do were the leading causes of excess infant deaths (Table 3). Overall, the proportion of excess deaths due to perinatal problems was high in the metropolitan cities (metropolitan cities: 68% vs. provinces: 53%), and the proportion of excess deaths due to injury and external causes was high in the provinces (metropolitan cities: 9% vs. provinces: 18%) (Supplementary Fig. 1).

Overall and regional trends in the IMRs between 2001 and 2021

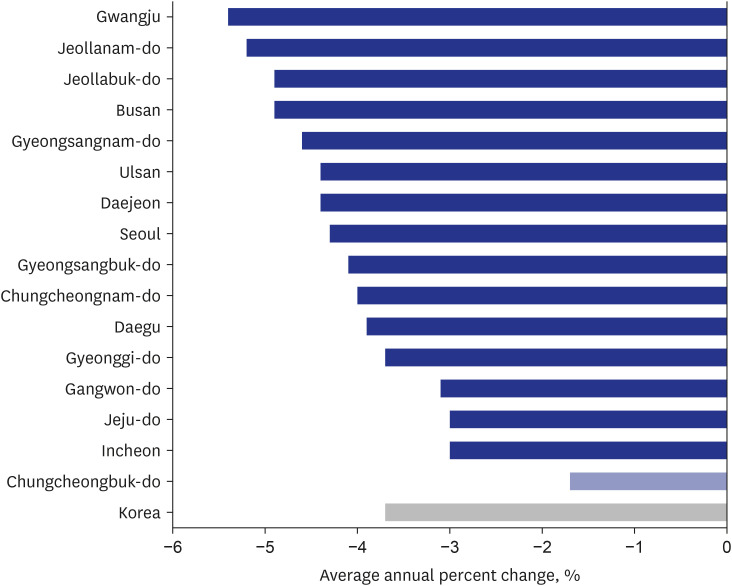
The overall IMR in Korea significantly decreased over the study period (AAPC, −3.7%, 95% CI, −4.6%, −2.7%). The IMR decreased significantly in all regions except Chungcheongbuk-do, and the AAPCs ranged from −5.4% (95% CI, −6.7%, −4.0%) in Gwangju to −3.0% (95% CI, −3.6%, 2.3%) in Incheon. Specifically, the trend of change in the overall IMR in Korea showed that the IMR decreased rapidly between 2003 and 2008 (APC, −8.0%), but the rate of decline slowed between 2008 and 2021 (APC, −2.5%). During the same period, Seoul's APC was −4.3%, which means that, on average, the overall disparity in the IMR compared to that in Seoul decreased at the beginning of the observation period, but the overall disparity in the IMR compared to that in Seoul increased again after 2008. Excluding Seoul from the calculation of infant mortality in Korea, the gap has widened slightly since 2008 (Fig. 2 and Supplementary Figs. 2, 3).
Fig. 2

Changes in the infant mortality rate in Korea (2001–2021). Dark blue and gray bars indicate statistical significance (P < 0.05).

jkms-38-e367-g002
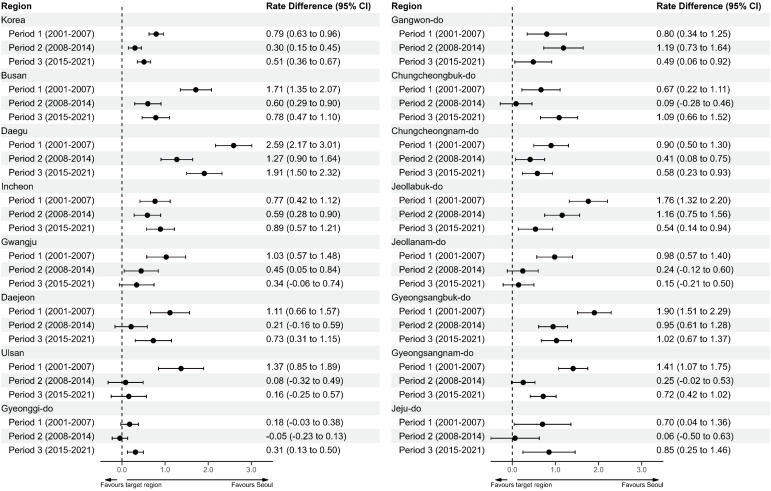
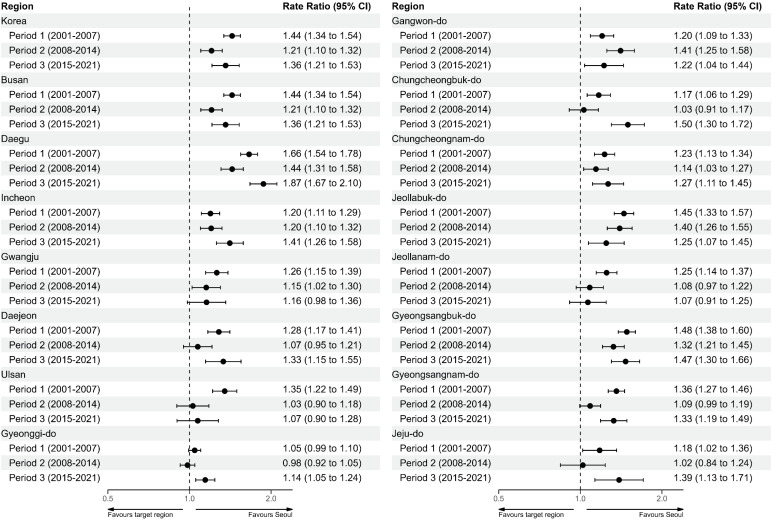
The absolute and relative regional disparities in IMR trends were compared between Seoul (reference group) and the other 15 regions using RRs and RDs with 95% CIs according to period (Figs. 3 and 4). In Korea, there was a decrease in the RD and RR from period 1 (between 2001 and 2007) to period 2 (between 2008 and 2014) followed by an increase from period 2 (between 2008 and 2014) to period 3 (between 2015 and 2021). By region, the RDs and RRs were similar to the overall trend in Korea, but in Gwangju, Jeollabuk-do, and Jeollanam-do, the RDs and RRs decreased throughout the study period. In Gangwon-do, the RD and RR increased from period 1 to period 2 and decreased from period 2 to period 1. Supplementary Figs. 4 and 5 present cause-specific IMR trends during the study period.
Fig. 3

Trends in the rate difference of infant mortality by region in Korea.

CI = confidence interval.
jkms-38-e367-g003
Fig. 4

Trends in the rate ratio of infant mortality by region in Korea.

CI = confidence interval.
jkms-38-e367-g004

DISCUSSION

We examined regional disparities in the IMR in Korea using cause of death statistics from the National Statistical Office, which covers the entire country. There have been discussions about the regional disparities in the IMR in Korea, but little is known about this issue.
We identified that regional disparities in the IMR exist in Korea. The region with the lowest IMR between 2001 and 2021 was Seoul; except for that in Gyeonggi-do during period 2, the IMR was consistently low in Seoul compared to other regions from period 1 to period 3. Considering the proportion of excess deaths due to perinatal problems in other regions, the low IMR in Seoul can be mainly explained by the lower IMR due to perinatal causes compared to those in other regions. Notably, as reported in previous studies, Korea’s IMR has been declining; the relative and absolute disparities have tended to increase in recent years.11121314 This is because the decline in IMR in other regions has slowed compared to that in Seoul, and various causes, including the distribution of medical resources, social determinants of health, and the physical environment, need to be considered to determine the cause.21
Although our study focused on the phenomenon of regional disparities in the IMR rather than on causal relationships, regional differences in the IMR can be explained indirectly through the causes contributing to excess mortality. The perinatal problems that contributed the most to excess mortality and regional disparities in this study were related to maternal causes such as age, obesity, and smoking, fetal sex and ethnicity, prenatal care, socioeconomic status, and the protocol and capacity of neonatal intensive care units (NICUs).2223242526272829 According to previous studies, the factors affecting the mortality of children and adolescents in developed countries were divided into 4 domains: intrinsic (biological and psychological) factors, the physical environment, the social environment, and service delivery.30 Applying this classification to the risk of perinatal mortality, factors related to perinatal problems are mainly related to social environment and service delivery, except for fetal sex, which is classified as an intrinsic factor. Regarding fetal sex, many studies have reported that the perinatal mortality rate of boys is higher than that of girls.2329 In Korea, the sex ratio at birth in Seoul is lower than that in other regions, and although recently alleviated, it has been reported that Daegu and Gyeongsangbuk-do, where the preference for sons is strong, have a high sex ratio at birth.31 In particular, between 2001 and 2021, which was the study period, the sex ratio at birth was high on average in the Gyeongsang province area. Although fetal sex was classified as an intrinsic factor, in a study that analyzed the sex ratio at birth and parents' social status, it was found that since the late 1990s, the higher the parents' social status, the lower the sex ratio at birth. This means that the sex ratio at birth not only acts as a biological factor but is also affected by the social environment.32 Sidebotham et al. reported that the social environment has the greatest effect on child mortality among the 4 domains.30 Regarding perinatal mortality, social determinants affect maternal pregnancy and postpartum well-being, which in turn will affect perinatal mortality.263334 A cohort study reported that the regional deprivation index correlated with the IMR in Korea, and metropolitan areas had negative excess mortality and negative deprivation indices compared to local provinces.35 In a Japanese study that analyzed trends in perinatal mortality, the reduction in perinatal mortality in Japan was largely attributed to the reduction in early neonatal mortality, which was explained by improved NICU capacity, effective interventions to save neonates, and improved quality of treatment.28 In our study, although the IMR is improving in Korea, there is still a regional gap compared to Seoul, suggesting that service delivery needs to be considered. Due to the nature of healthcare resources, which cannot be stored and are produced and consumed simultaneously, regionalization and risk-appropriate healthcare delivery are important, especially during the perinatal period when transport can be a risk factor that increases mortality.36 In addition, low accessibility due to physical distance to healthcare centers can contribute to regional disparities. Several studies have reported on the relationship between the distance to healthcare centers and neonatal prognosis.373839 Several studies have reported on regional disparities in healthcare resources related to NICUs, and although there have been improvements, regional disparities, particularly in human resources, are still a problem.164041
Disparities in the IMR at the regional level have also been studied in other countries.34567 In a study comparing IMRs between southern states and states in other regions of the United States, the southern states had a higher IMR than the states in other regions (7.37 vs. 6.19 per 1,000 live births), and the three main causes of excess mortality were sudden unexpected infant death (SUID), prematurity, and congenital anomalies.3 In another study conducted in the United States, the IMRs were 5.43 per 1,000 live births in large metropolitan areas, 6.31 in medium/small metropolitan areas, and 6.67 in counties in nonmetropolitan areas, and SUID and congenital anomalies were the main causes of excess mortality.4 Interestingly, in both studies, prematurity, not SUID, was the main cause of excess mortality in black infants, which means that regional disparities cannot simply be generalized and a contextual approach is needed. In most regions in Korea, perinatal problems accounted for the highest proportion of excess deaths, but in some regions, external causes, shock and ill-defined conditions, and congenital anomalies contributed the most to excess mortality. The contribution of external causes to excess mortality was greater in provinces than in metropolitan areas, suggesting the need for an improved physical environment in provinces.
This work has several limitations. First, there have been concerns about the validity of death certificates. Cause of death statistics from the National Statistical Office are based on death certificates and may be inaccurate because of underreporting or misreporting. However, we used infant mortality data after 2001 when underreporting was corrected using cremation data and neonatal death data. In addition, death certificates in Korea are written by a physician, and according to research, the accuracy of the cause of death was relatively accurate at 91.9%.942 Second, our analysis was limited to examining the phenomenon of disparities in IMRs among regions and only presented interpretations post hoc. Further research is needed to analyze the relationship between etiological factors, such as gestational age, birth weight, race, and statuses, and the IMR to understand the mechanism of regional disparities in the IMR and to suggest appropriate policies.
Our study found that the IMR is associated with place of residence, and regional disparities in the IMR have recently widened again. In the context of deepening regional inequality in pediatric-related healthcare resources, especially human resources, these disparities are likely to widen. Therefore, an in-depth investigation of regional disparities in the IMR and policy intervention are urgently needed.

Notes

Disclosure: The authors have no potential conflicts of interest to disclose.

Author Contributions:

  • Conceptualization: Kim JS, Woo H.

  • Data curation: Kim JS, Woo H.

  • Formal analysis: Kim JS, Woo H.

  • Investigation: Kim JS, Woo H.

  • Methodology: Woo H.

  • Validation: Kim JS.

  • Writing - original draft: Kim JS, Woo H.

  • Writing - review & editing: Kim JS, Woo H.

References

1. Reidpath DD, Allotey P. Infant mortality rate as an indicator of population health. J Epidemiol Community Health. 2003; 57(5):344–346. PMID: 12700217.
crossref
2. Singh GK, Yu SM. Infant mortality in the United States, 1915–2017: large social inequalities have persisted for over a century. Int J MCH AIDS. 2019; 8(1):19–31. PMID: 31049261.
crossref
3. Hirai AH, Sappenfield WM, Kogan MD, Barfield WD, Goodman DA, Ghandour RM, et al. Contributors to excess infant mortality in the U.S. South. Am J Prev Med. 2014; 46(3):219–227. PMID: 24512860.
crossref
4. Womack LS, Rossen LM, Hirai AH. Urban-rural infant mortality disparities by race and ethnicity and cause of death. Am J Prev Med. 2020; 58(2):254–260. PMID: 31735480.
crossref
5. Yu X, Wang Y, Kang L, Miao L, Song X, Ran X, et al. Geographical disparities in infant mortality in the rural areas of China: a descriptive study, 2010–2018. BMC Pediatr. 2022; 22(1):264. PMID: 35549888.
crossref
6. Joseph KS, Huang L, Dzakpasu S, McCourt C. Regional disparities in infant mortality in Canada: a reversal of egalitarian trends. BMC Public Health. 2009; 9(1):4. PMID: 19128489.
crossref
7. Mishina H, Hilton JF, Takayama JI. Trends and variations in infant mortality among 47 prefectures in Japan. J Eval Clin Pract. 2013; 19(5):849–854. PMID: 22639950.
crossref
8. Nath S, Hardelid P, Zylbersztejn A. Are infant mortality rates increasing in England? The effect of extreme prematurity and early neonatal deaths. J Public Health (Oxf). 2021; 43(3):541–550. PMID: 32119086.
crossref
9. Eun SJ. Trends and disparities in avoidable, treatable, and preventable mortalities in South Korea, 2001–2020: comparison of capital and non-capital areas. Epidemiol Health. 2022; 44:e2022067. PMID: 35989656.
crossref
10. Go DS, Kim YE, Radnaabaatar M, Jung Y, Jung J, Yoon SJ. Regional differences in years of life lost in Korea from 1997 to 2015. J Korean Med Sci. 2018; 34(Suppl 1):e91. PMID: 30923494.
crossref
11. Chang JY, Lee KS, Hahn WH, Chung SH, Choi YS, Shim KS, et al. Decreasing trends of neonatal and infant mortality rates in Korea: compared with Japan, USA, and OECD nations. J Korean Med Sci. 2011; 26(9):1115–1123. PMID: 21935264.
crossref
12. Choi H, Nho JH, Yi N, Park S, Kang B, Jang H. Maternal, infant, and perinatal mortality statistics and trends in Korea between 2018 and 2020. Korean J Women Health Nurs. 2022; 28(4):348–357. PMID: 36617486.
crossref
13. Chung SH, Choi YS, Bae CW. Changes in the neonatal and infant mortality rate and the causes of death in Korea. Korean J Pediatr. 2011; 54(11):443–455. PMID: 22253641.
crossref
14. Lee KJ, Sohn S, Hong K, Kim J, Kim R, et al. Vital Statistics Division, Statistics Korea, Daejeon, Korea. Maternal, infant, and perinatal mortality statistics and trends in Korea between 2009 and 2017. Obstet Gynecol Sci. 2020; 63(5):623–630. PMID: 32756294.
crossref
15. Park MS. Standing at the edge of the ‘Demographic Cliff’. J Korean Med Sci. 2022; 37(42):e318. PMID: 36325611.
crossref
16. Chang YS. Moving forward to improve safety and quality of neonatal intensive care in Korea. J Korean Med Sci. 2018; 33(9):e89. PMID: 29441743.
crossref
17. Kleinbaum DG, Kupper LL, Morgenstern H. Epidemiologic Research: Principles and Quantitative Methods. Belmont, CA, USA: Lifetime Learning Publications;1982.
18. Lewer D, Jayatunga W, Aldridge RW, Edge C, Marmot M, Story A, et al. Premature mortality attributable to socioeconomic inequality in England between 2003 and 2018: an observational study. Lancet Public Health. 2020; 5(1):e33–e41. PMID: 31813773.
crossref
19. Clegg LX, Hankey BF, Tiwari R, Feuer EJ, Edwards BK. Estimating average annual per cent change in trend analysis. Stat Med. 2009; 28(29):3670–3682. PMID: 19856324.
crossref
20. Kim HJ, Fay MP, Feuer EJ, Midthune DN. Permutation tests for joinpoint regression with applications to cancer rates. Stat Med. 2000; 19(3):335–351. PMID: 10649300.
crossref
21. Nakamura Y, Nagai M, Yanagawa H. A characteristic change in infant mortality rate decrease in Japan. Public Health. 1991; 105(2):145–151. PMID: 2068238.
crossref
22. Flenady V, Middleton P, Smith GC, Duke W, Erwich JJ, Khong TY, et al. Stillbirths: the way forward in high-income countries. Lancet. 2011; 377(9778):1703–1717. PMID: 21496907.
crossref
23. Peelen MJ, Kazemier BM, Ravelli AC, De Groot CJ, Van Der Post JA, Mol BW, et al. Impact of fetal gender on the risk of preterm birth, a national cohort study. Acta Obstet Gynecol Scand. 2016; 95(9):1034–1041. PMID: 27216473.
crossref
24. Ravelli AC, Tromp M, Eskes M, Droog JC, van der Post JA, Jager KJ, et al. Ethnic differences in stillbirth and early neonatal mortality in The Netherlands. J Epidemiol Community Health. 2011; 65(8):696–701. PMID: 20719806.
crossref
25. Pillay J, Donovan L, Guitard S, Zakher B, Gates M, Gates A, et al. Screening for gestational diabetes: updated evidence report and systematic review for the US preventive services task force. JAMA. 2021; 326(6):539–562. PMID: 34374717.
26. Joseph KS, Liston RM, Dodds L, Dahlgren L, Allen AC. Socioeconomic status and perinatal outcomes in a setting with universal access to essential health care services. CMAJ. 2007; 177(6):583–590. PMID: 17846440.
crossref
27. Rysavy MA, Li L, Bell EF, Das A, Hintz SR, Stoll BJ, et al. Between-hospital variation in treatment and outcomes in extremely preterm infants. N Engl J Med. 2015; 372(19):1801–1811. PMID: 25946279.
crossref
28. Sugai MK, Gilmour S, Ota E, Shibuya K. Trends in perinatal mortality and its risk factors in Japan: analysis of vital registration data, 1979–2010. Sci Rep. 2017; 7(1):46681. PMID: 28440334.
crossref
29. Almossawi O, O’Brien S, Parslow R, Nadel S, Palla L. A study of sex difference in infant mortality in UK pediatric intensive care admissions over an 11-year period. Sci Rep. 2021; 11(1):21838. PMID: 34750426.
crossref
30. Sidebotham P, Fraser J, Covington T, Freemantle J, Petrou S, Pulikottil-Jacob R, et al. Understanding why children die in high-income countries. Lancet. 2014; 384(9946):915–927. PMID: 25209491.
crossref
31. Chun H, Das Gupta M. Gender discrimination in sex selective abortions and its transition in South Korea. Womens Stud Int Forum. 2009; 32(2):89–97.
crossref
32. Chun H, Kim IH, Khang YH. Trends in sex ratio at birth according to parental social positions: results from vital statistics birth, 1981–2004 in Korea. J Prev Med Public Health. 2009; 42(2):143–150. PMID: 19349745.
crossref
33. Caughey AB. Association between income and perinatal mortality in The Netherlands across gestational age. Obstet Gynecol Surv. 2022; 77(5):259–261.
crossref
34. Trinh NTH, de Visme S, Cohen JF, Bruckner T, Lelong N, Adnot P, et al. Recent historic increase of infant mortality in France: a time-series analysis, 2001 to 2019. Lancet Regional Health-Europe. 2022; 16:100339. PMID: 35252944.
crossref
35. Yun JW, Kim YJ, Son M. Regional deprivation index and socioeconomic inequalities related to infant deaths in Korea. J Korean Med Sci. 2016; 31(4):568–578. PMID: 27051241.
crossref
36. Lasswell SM, Barfield WD, Rochat RW, Blackmon L. Perinatal regionalization for very low-birth-weight and very preterm infants: a meta-analysis. JAMA. 2010; 304(9):992–1000. PMID: 20810377.
crossref
37. Minion SC, Krans EE, Brooks MM, Mendez DD, Haggerty CL. Association of driving distance to maternity hospitals and maternal and perinatal outcomes. Obstet Gynecol. 2022; 140(5):812–819. PMID: 36201778.
crossref
38. Målqvist M, Sohel N, Do TT, Eriksson L, Persson LA. Distance decay in delivery care utilisation associated with neonatal mortality. A case referent study in northern Vietnam. BMC Public Health. 2010; 10(1):762. PMID: 21144058.
crossref
39. Karra M, Fink G, Canning D. Facility distance and child mortality: a multi-country study of health facility access, service utilization, and child health outcomes. Int J Epidemiol. 2017; 46(3):817–826. PMID: 27185809.
crossref
40. Shim JW, Kim MJ, Kim EK, Park HK, Song ES, Lee SM, et al. The impact of neonatal care resources on regional variation in neonatal mortality among very low birthweight infants in Korea. Paediatr Perinat Epidemiol. 2013; 27(2):216–225. PMID: 23374067.
crossref
41. Song IG, Shin SH, Kim HS. Improved regional disparities in neonatal care by government-led policies in Korea. J Korean Med Sci. 2018; 33(6):e43. PMID: 29349938.
crossref
42. Won TY, Kang BS, Im TH, Choi HJ. The study of accuracy of death statistics. J Korean Soc Emerg Med. 2007; 18(3):256–262.

SUPPLEMENTARY MATERIALS

Supplementary Fig. 1

Estimated excess number of deaths attributable to regional disparities and disease distribution for provinces and metropolitan cities (except Seoul) in Korea.
jkms-38-e367-s001.doc

Supplementary Fig. 2

Trends of infant mortality rates between 2001 and 2021. (A) Korea, (B) Seoul, (C) Busan, (D) Daegu, (E) Incheon, (F) Gwangju, (G) Daejeon, (H) Ulsan, (I) Gyeonggi-do, (J) Gangwon-do, (K) Chungcheongbuk-do, (L) Chungcheongnam-do, (M) Jeollabuk-do, (N) Jellanam-do, (O) Gyeongsangbuk-do, (P) Gyeongsangnam-do, (Q) Jeju-do.
jkms-38-e367-s002.doc

Supplementary Fig. 3

Infant mortality rates for Seoul and Korea (A) Seoul vs. Korea, (B) Seoul vs. Korea (except Seoul).
jkms-38-e367-s003.doc

Supplementary Fig. 4

Trends in the rate difference of cause-specific infant mortality by region in Korea. (A) Perinatal problems, (B) congenital anomalies, (C) shock and ill-defined conditions, (D) injury and external causes, (E) circulatory and respiratory problems, (F) nervous system problems, (G) cancer, blood and immune system problems, (H) other causes.
jkms-38-e367-s004.doc

Supplementary Fig. 5

Trends in the rate ratio of cause-specific infant mortality by region in Korea. (A) Perinatal problems, (B) congenital anomalies, (C) shock and ill-defined conditions, (D) injury and external causes, (E) circulatory and respiratory problems, (F) nervous system problems, (G) cancer, blood and immune system problems, (H) other causes.
jkms-38-e367-s005.doc
TOOLS
Similar articles