

 PDF
PDF Citation
 Print
Print


INTRODUCTION
Osteoporosis is a systemic skeletal disorder characterized by decreased bone mineral density (BMD), compromised bone strength, and increased vulnerability to fragility fractures.1 In general, BMD consistently shows an inverse relationship with osteoporotic fracture risk.23
The word secular is a descriptive word used to indicate certain activities that develop over the long period and remain consistent over time. Therefore, the secular trends are those the researchers expect to remain altering in the same direction over the long term.
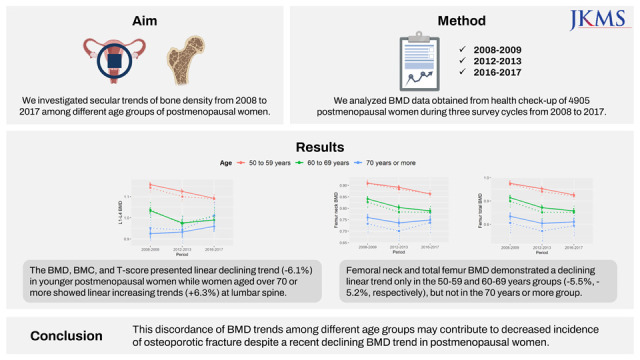
Investigating the secular trend of BMD is important to predict the future trend of osteoporotic fractures. However, prior studies were mainly preceded to clarify the trend of osteoporotic fracture rather than the trend of BMD. These series of studies conducted in many countries including the United States, Canada, Australia, Italy, and Denmark,456789 revealed a decreasing or remaining osteoporotic fracture trend in recent years. Therefore, many researchers anticipated that the trend of BMD would demonstrate an improving trend. However, a study analyzing the National Health and Nutrition Examination Survey (NHANES) data raised an interesting question with the report of a declining secular trend of BMD at the femur in postmenopausal women10 despite published evidence that age-adjusted incidence of osteoporotic fracture decreases or remains stable lately in developed countries. It is not clear whether a decrease in age-adjusted BMD is an actual occurrence, and if it is, how this trend will affect the rate of osteoporotic fracture in the future. We investigated the trend of lumbar and femoral BMD in postmenopausal women from 2008 to 2017 to predict the trajectory of osteoporotic fractures in the future. Additionally, we explored the contributors for the discrepancy between the trend of BMD and the trend of osteoporotic fracture by investigating them in different age groups during the survey period.
METHODS
Study participants
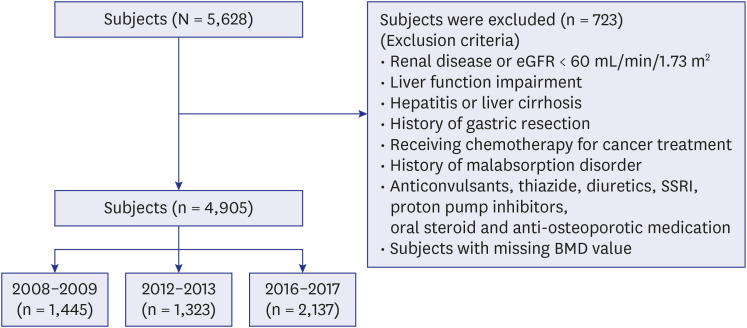
The present study analyzed the BMD data of 5,628 postmenopausal subjects aged 50 years and older, who had health check-ups in three survey cycles 2008–2009, 2012–2013, and 2016–2017 in Ajou University Hospital, Suwon, South Korea. The exclusion criteria were: subjects diagnosed with osteoporotic fractures; with renal diseases or estimated glomerular filtration rate < 60 mL/min/1.73 m2; with impaired liver function defined as a serum alanine transaminase (ALT) or serum alanine aminotransferase level three times the upper limit of the normal range or more; presence of hepatitis or cirrhosis; with endocrine disease such as hyperthyroidism and hypothyroidism; history of gastric resection; subjects receiving chemotherapy for cancer treatment; conditions associated with the malabsorption of nutrients such as inflammatory bowel disease; subjects on medications that could affect bone mineral metabolism, such as anticonvulsants, thiazides, diuretics, selective serotonin reuptake inhibitor, proton pump inhibitors, oral steroids, and anti-osteoporotic medicines; and subjects with missing BMD values (Fig. 1). Consequently, 4,905 postmenopausal women were included in this study.
Study procedures
Body mass index (BMI) was calculated as body weight in kilograms divided by height in meters squared. Height and weight were measured with the Inbody® scale (BSM-330; Biospace®, Seoul, Korea). Laboratory tests such as serum creatinine, ALT, aspartate transaminase (AST), and fasting blood glucose were performed on the blood sample. Cigarette smoking habits and calcium supplementation were assessed with a survey questionnaire. BMD, bone mineral content (BMC), and T-score at the lumbar spine and proximal femur were measured by DXA scan (Lunar iDXA; General Electric®, Boston, MA, USA) performed in standard mode. Spine and hip scans were analyzed using enCORE (2007, Version 11.4; General Electric Company, Madison, WI, USA) in 2008–2009, and enCORE (Version 15.0) in 2012–2013 and 2016–2017. Quality control for calibration of DXA scan was conducted once a week using the aluminum spine phantom model.
Data analysis
Statistical analyses were performed by using R Statistical Software (version 4.0.2; R Foundation for Statistical Computing, Vienna, Austria). Continuous variables were presented as means ± standard deviation. We examined whether the change in secular BMD trend remained significant after adjusting for multiple BMD-associated factors such as BMI, serum creatinine, AST, ALT, fasting blood sugar, smoking habit, and calcium supplementation. Thus, the least-square means, which were adjusted for means of the aforementioned factors in the multiple regression model, and their 95% confidence intervals were calculated to plot our figures. Categorical variables were transformed into dummy variables so that they could be analyzed by multiple linear regression analysis. P values were obtained after Bonferroni adjustment, which are significant when < 0.05.
RESULTS
General characteristics
General characteristics of the subjects in each period are demonstrated in Table 1. The mean ages of the subjects and the mean serum creatinine values declined during the survey period, while the values of mean body weight, mean AST, mean ALT, and calcium supplementation rate increased. The proportion of subjects aged 50–59 years was higher in 2016–2017 (73.59%) compared with those in other periods, while the proportion of subjects aged 70 years or more was highest in 2008–2009.
Table 1
Demographic and clinical characteristics of the study group
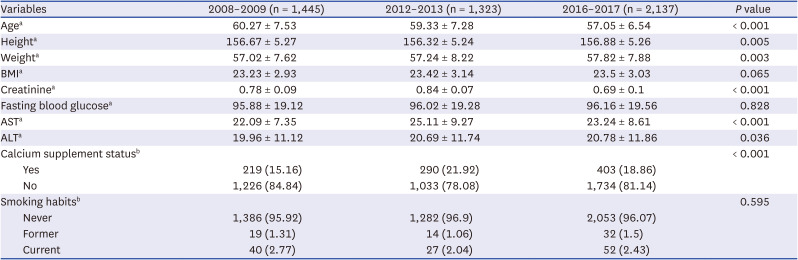
Data are presented as mean ± standard deviation and number (%) for the categorical variables.
Kruskal-Wallis rank-sum test was used for continuous variables and χ2 test was used for categorical variables, as appropriate.
BMI = body mass index, AST = aspartate transaminase, ALT = alanine transaminase.
aEvaluated by Kruskal-Wallis test; bEvaluated by χ2 test.
Trend of BMD, BMC and T-score across whole population
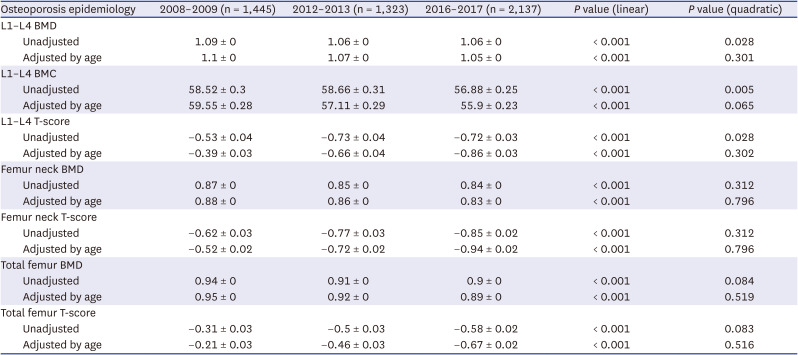
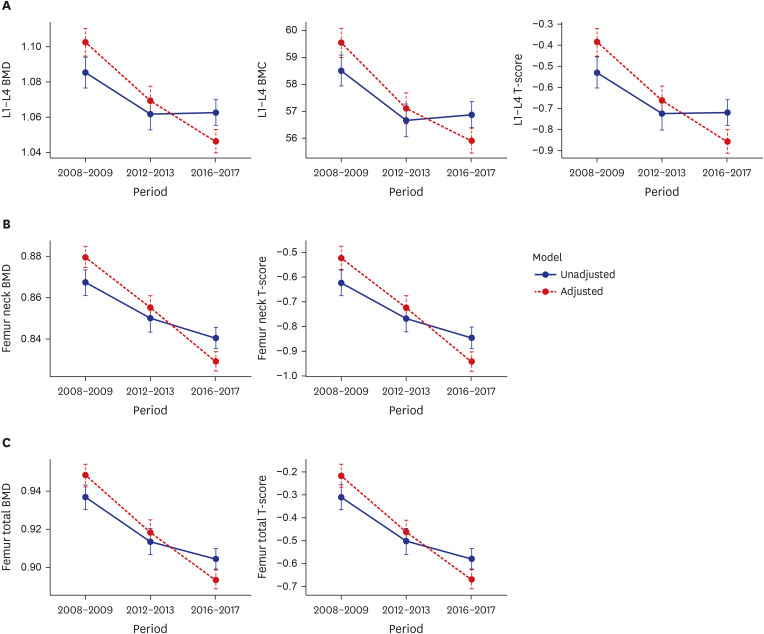
The BMD, BMC and T-score of the lumbar spine demonstrated a declining trend over the survey period. The BMD and T-score of the femur neck and femur total also showed a declining trend over the survey period. These declining trends became more apparent both for the lumbar spine and the femur after adjusting for age (Table 2, Fig. 2).
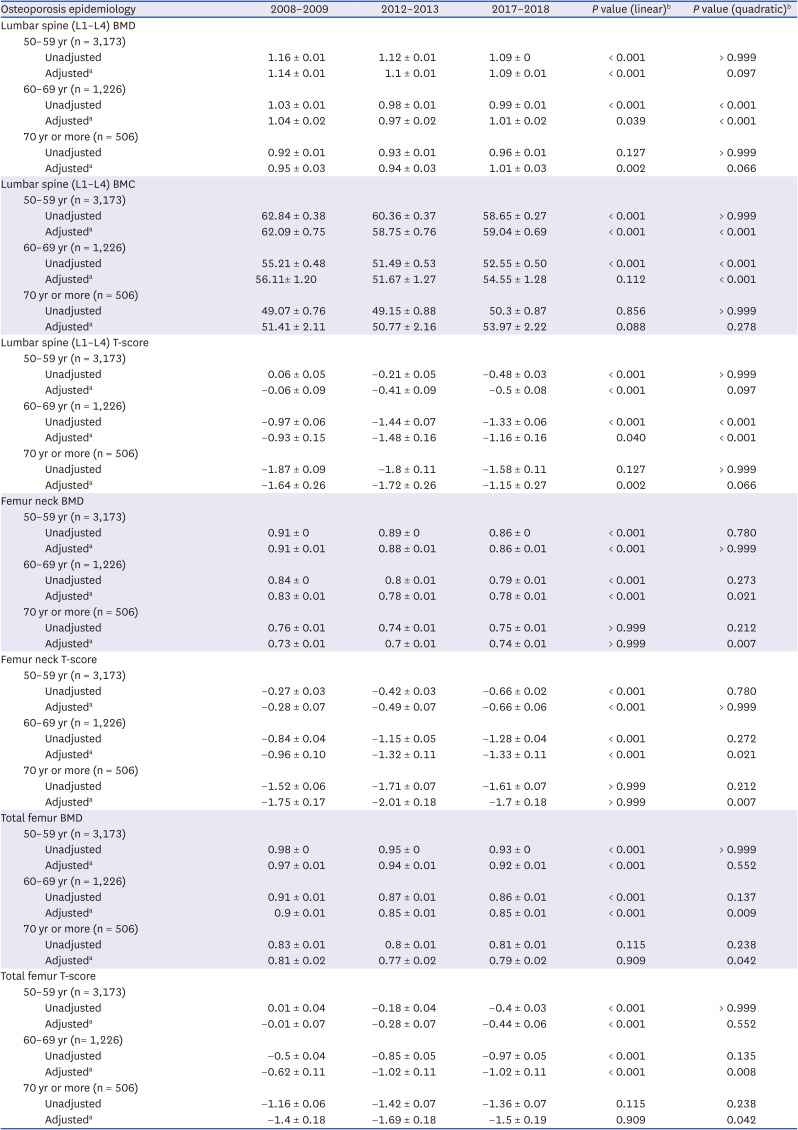
Table 2
Lumbar spine and femur bone density during the survey periods (before division into age groups)
Trend of BMD, BMC and T-score in different age groups
Subjects were divided into different age groups (50–59 years, 60–69 years, 70 years and more), and the outcomes of bone density analysis of the lumbar spine and the femur for each of the groups were calculated as demonstrated in Table 3. We found a declining linear trend of BMD, BMC, and T-scores in the 50–59 years age group and a quadratic declining trend in the 60–69 years age group during the survey periods. These declining trends of BMD, BMC and T-score in the 50–59 years and the 60–69 years age groups remained statistically significant even after adjusting for BMI, renal function, liver function, fasting blood glucose, cigarette smoking, and calcium supplementation. On the contrary, BMD and T-score of the lumbar spine demonstrated linear increasing trends during the survey periods in the 70 years or more age group. These linear increasing trends of BMD and T-scores changed to quadratic trends after applying the same adjustments but remained statistically significant (Table 3, Fig. 3A).
Table 3
Lumbar spine and femur bone density during the survey periods and for each age group
Data are presented as mean ± standard deviation.
BMD = bone mineral density, BMC = bone mineral content.
aAdjusted for BMI, serum creatinine, AST, ALT, fasting blood glucose, smoking habit, calcium supplementation status.
bP values were obtained after Bonferroni adjustment, which are significant when < 0.05.
Fig. 3
Secular trend of lumbar spine and femur bone density of each age group.
BMD = bone mineral density, BMC = bone mineral content.
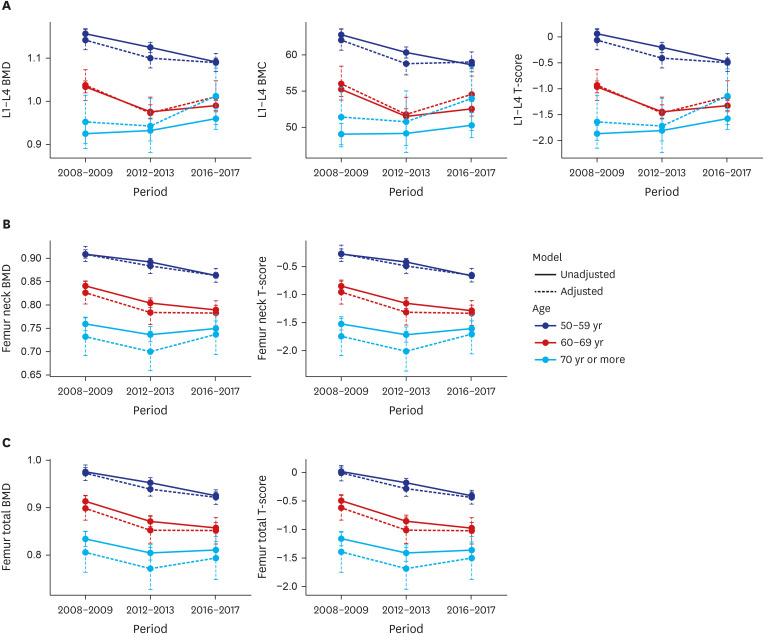
For the femoral neck and the total femur bone, we identified declining linear trends during the survey periods in the 50–59 years and the 60–69 years age group. The declining trends of BMD and T-score were persistently statistically significant even after adjusting for BMI, renal function, liver function, fasting blood glucose, cigarette smoking, and calcium supplementation in each age group. In women aged 70 years or more, U shape trends in BMD and T-score were seen but those trends were not statistically significant before or after the adjustment (Table 3, Fig. 3B and C).
DISCUSSION
In this study, we demonstrated that the BMD values of the lumbar spine and proximal femur in postmenopausal women have been decreasing from 2008 to 2017. However, the analysis conducted in different age groups revealed a discrepancy in the secular trend of BMD. The decrease in BMD values over the survey periods was more apparent in younger postmenopausal women, whereas women aged over 70 years showed increasing values of BMD at the lumbar spine and unchanged values for the proximal femur during the survey period.
Previous studies have reported that hip fracture incidence has decreased in developed countries.456789 This declining trend of fragility fracture was also observed among Asian countries,1112 including Korea.13 However, a recent study regarding the BMD trend in the United States reported an unexpected finding for hip fracture incidence. The prevalence of osteoporosis in the United States defined by the femur neck BMD and T score under −2.5 increased from 2007–2008 to 2013–2014 based on data from NHANES,10 and it also detailed a declining quadratic trend of femoral neck BMD during the same period.14 This finding is consistent with the present study. However, the background of the discordance between trends of BMD and fracture incidence reported in NHANES has not been clearly elucidated yet. The attempt to analyze BMD trends by dividing the study group into different age groups may shed light on the variations in BMD trends following age and may discover transition of BMD trends between those age groups as our analysis did.
Age is the most powerful and independent risk factor for osteoporotic fractures.1516 Fragility fracture, especially hip fracture, is more common in elderly postmenopausal women than that in young postmenopausal women with the same BMD.1718 The BMD trend in the younger ages may have a lesser impact on the incidence of osteoporotic fractures compared to that in the elderly. According to the National Osteoporosis Risk Assessment (NORA) study, the overall fracture incidence increases about 8 per 1,000 person-years as T-score changes from −1.0–−2.0 to less than −2.0 in ages of 50–69 years while it increases 13 per 1,000 person-years in ages of 70–79 years and even 15 per 1,000 person-year in ages over 80 years with the same T-score change.19 Accounting for the NORA study and our observation, the discordance between decreased fracture incidence and increasing BMD trend may have originated from the discrepancy of BMD trends across different age groups.
To figure out plausible causes for the observed differences in BMD trends among different age groups, we explored the changes in BMD-related factors such as BMI, renal function, liver function, fasting blood glucose, smoking habit, and calcium supplementation.202122 Surprisingly, these factors had shown a favorable change for BMD in the younger age group during the survey periods (Supplementary Table 1). However, a previous study revealed that changes in BMD-related factors may cause very little effect on the actual BMD change. Looker et al stated that adjustments for BMI and smoking habit failed to make a meaningful difference on BMD.10
This discordance in BMD trends may have originated from physical inactivity in younger women relative to the elderly.23 The sedentary lifestyle has become more pervasive in Korea lately, physical activity of adults has decreased by 13.1% as reported in Korea NHANES 2008 to 2014.24 And similarly, a study based on data from the 2020 National Health and Nutrition Survey, published in 2022, found that physical activity in the age group under 19–64 was significantly lower than those over 64.25 The level of physical activity is an important factor to maintain adequate bone mass. Especially, increased exercise or physical activity can reduce accelerated bone loss during the early menopausal period.2627 Another possible explanation is that in Korea, not like other countries, vitamin D deficiency is more prominent among young people. As is well known, vitamin D deficiency is significantly associated with decreased bone density.28
The increasing secular trend of BMD of the lumbar spine in the over 70 years age group shown in this study may contribute to the declining trend in vertebral compression fracture.29 In a study that reports the incidence of vertebral fracture in different age groups in Korea from 2012 to 2016, a substantial decline in vertebral fracture trend from 2013 to 2016 was observed only in the 70–74 age group. In other age groups, the incidence of vertebral fracture showed increasing trends, which supports our findings.
The strength of this study is that a substantial number of participants were included to probe the secular trends of BMD. The average number of subjects for each time period to find the secular trend of BMD in the United States was about 2,000 and 3,500 participants, respectively.1014 The population of the US is approximately 6 times larger than that of Korea, so an average of 1635 subjects for each time period in our study is relatively substantial, to analyze secular BMD trends. Moreover, the large number of subjects enabled us to perform an age-based analysis of participants, which revealed the discrepancy in BMD trends between younger and older postmenopausal women.
This study should be viewed in the light of its limitations. This research was conducted in a single institution in a single ethnic group. Due to the nature of these samples, some bias may occur in the sampling of participants between periods. In addition, since this study is a cross-sectional study and was not conducted on the same patients, there is a limitation that causality may not be evident. Another limitation is that the software version of the bone density measurement equipment used in this study is different between the data for 2008–2009 and the data for 2012–2013 and 2016-2017. Although this is a very subtle difference, it cannot be ruled out that it may have influenced the results of the study. And, this study was unable to completely address the causes of varying trends of BMD among the age groups due to lack of additional information such as serum vitamin D values.
In conclusion, our study indicated that BMD in postmenopausal women has declined significantly from 2008 to 2017 despite the increasing trends in elderly women. Our findings explain the recent discovery of the discrepancy between trends of BMD and fragility fracture. This data may help predict the trajectory of osteoporotic fractures in the future.
 XML Download