Journal List > J Korean Med Sci > v.38(40) > 1516084201

Oh and Song: Preoperative Body Mass Index, Waist Circumference, and Mortality After Major Cancer Surgery: A Nationwide Cohort Study in Korea

Abstract

Background

Body mass index (BMI) and waist circumference (WC) were used to evaluate nutritional status and obesity. We aimed to examine whether preoperative BMI or WC was associated with mortality after cancer surgery.

Methods

This population-based cohort study used data extracted from the National Health Insurance Service database of South Korea. We included adult patients who underwent major cancer surgery with curative intent between January 1, 2016, and December 31, 2020.

Results

A total of 87,220 patients were included in the final analysis, and 1,374 (1.6%) died within 90 days after cancer surgery. In the multiple logistic regression model, the BMI < 18.5/kg/m2 and > 35 kg/m2 groups showed 1.98-fold (odds ratio [OR], 1.98; 95% confidence interval [CI], 1.58–2.49; P < 0.001) and 2.60-fold (OR, 2.60; 95% CI, 1.25–5.40; P < 0.001) higher 90-day mortality after cancer surgery than did the BMI 18.5–24.9 kg/m2 group. The 25.0–29.9 kg/m2 (P = 0.144) and 30.0–34.9 kg/m2 (P = 0.105) BMI groups did not show significant differences compared to the BMI 18.5–24.9 kg/m2 group. Compared with the normal WC group, the high (P = 0.052) and very high (P = 0.232) WC groups also did not show significant differences in terms of 90-day mortality.

Conclusions

Preoperative BMI < 18.5 kg/m2 and > 35 kg/m2 is associated with an elevated risk of 90-day mortality after major cancer surgery. However, preoperative WC was not significantly associated with 90-day mortality after cancer surgery.

Graphical Abstract

jkms-38-e310-abf001.jpg

INTRODUCTION

Cancer is one of the major causes of death, and its burden has been continuously increasing worldwide.123 With curative intention, the most common treatment option for solid cancer is long surgery.4 In 2015, there were 15.2 million new cases of cancer worldwide, over 80% of which required surgery.5 Therefore, the management of patients with cancer who underwent cancer surgery is an important health issue.
Body mass index (BMI) and waist circumference (WC) have been used to evaluate nutritional status and obesity among populations.67 As obesity, overweight, or malnutrition affect clinical outcomes,8 BMI and WC could be used as prognostic factors in the population. Several recent reports have explained the impact of BMI and WC on mortality outcomes.91011 A previous study reported that a lower BMI was associated with a higher risk of mortality, whereas WC and lower BMI were not associated with mortality.11 Another study has reported a linear relationship between WC and all-cause mortality.9 For patients who underwent cancer surgery, a lower BMI was associated with increased postoperative mortality, while a higher BMI was not a significant risk factor for postoperative mortality.121314 However, no study has focused on the impact of preoperative WC and BMI on the mortality of patients who underwent cancer surgery.
This study aimed to examine whether preoperative BMI or WC is associated with mortality after cancer surgery in South Korea.

METHODS

Data source

Data were extracted from the National Health Insurance Service (NHIS) database. As a single public health insurance in South Korea, the NHIS contains and manages data on disease diagnoses and prescriptions for procedures and drugs. Disease diagnoses were registered using the International Classification of Diseases, External 10th Revision (ICD-10 codes). Additionally, the NHIS database contains demographic and socioeconomic status-related information for all patients in South Korea.

Study population

We initially included patients who were admitted to the hospital from January 1, 2016 to December 31, 2020 and underwent major cancer surgery with curative intent. Major cancers included lung, gastric, colorectal, esophageal, small bowel, liver, pancreatic, and bile duct or gallbladder cancers. In South Korea, patients with cancer are registered in the NHIS database to receive financial coverage for treatment expenses. In particular, the government supports most (approximately 95%) of the treatment costs of cancer patients. Among the patients who underwent major cancer surgery, we included those who had undergone standardized health examinations in the year prior to cancer surgery. In South Korea, NHIS subscribers aged ≥ 40 years are recommended to undergo standardized health examinations every two years.15

Preoperative BMI and WC (independent variable)

BMI and WC, which were measured in the year prior to cancer surgery, were obtained from the standardized health examination. Therefore, the average time interval from the date when BMI and WC were measured to the date of surgery was one year. Patients were categorized into five groups according to their BMI: < 18.5, 18.5–24.9, 25.0–29.9, 30.0–34.9, and > 35.0 kg/m2. WC was categorized into three groups (normal, high, and very high). According to a previous study,16 the WC in the normal, high, and very high groups was < 94 cm, 94–101.9 cm, and ≥ 102 cm for men and < 80 cm, 80–87.9 cm, and ≥ 88 cm for women, respectively.

Endpoints

The primary endpoint was 90-day mortality, which was defined as death within 90 days after the date of cancer surgery. The secondary endpoint was 30-day mortality, which was defined as death within 30 days after the date of cancer surgery. The 90-day mortality was determined as the primary endpoint because it reflects mortality from multiple causes, such as complications after surgery, whereas the 30-day mortality reflects surgery-related deaths.17

Covariates

Age and sex were collected as demographic information. Data on employment status, household income level, and residence were collected to reflect the preoperative socioeconomic status of the patients. The NHIS contains data on patients’ household income levels to determine the insurance premiums for the year, and approximately 67% of the medical expenses are subsidized by the government.18 However, individuals from low-income households are enrolled in the Medical Aid Program, wherein the government covers nearly all medical expenses to minimize the financial burden of medical costs. The patients were divided into five groups based on quartile ratios: Q1–Q4 and Medical Aid Program groups. Residences were classified as urban (those residing in Seoul and other metropolitan cities) or rural (those from all other areas). Hospitals in which patients underwent cancer surgery were classified into two groups: tertiary general hospitals and general hospitals. Surgical cases from video-assisted laparoscopic surgery and laparoscopy were collected as covariates. The Charlson comorbidity index was calculated using the ICD-10 codes to determine the comorbidity status of the patients (Supplementary Table 1). All individuals with disabilities must be registered in the NHIS database to receive benefits from South Korea social welfare system. In the database, the patients were divided into six groups according to the severity of their disability. Meanwhile, we divided the patients into two severity groups: patients with grades 1–3 disabilities were assigned to the severe disability group, whereas those with grades 4–6 were assigned to the mild-to-moderate disability group.

Statistical analysis

The clinicopathological characteristics of all patients were presented as median values with interquartile range (IQR) for continuous variables and numbers with percentages for categorical variables. First, the log odds of 30- or 90-day mortality after cancer surgery according to preoperative BMI or WC (continuous variables) were examined using restricted cubic splines (RCSs). Next, we performed univariate analyses for 30- or 90-day mortality after cancer surgery to examine individual association between many covariates and 30- or 90-day mortality. Then, we selected covariates with P values less than 0.1 and included them in the multiple logistic regression analyses in addition to preoperative BMI and WC. The results were presented as odds ratios (ORs) with 95% confidence intervals (CIs). We performed subgroup analyses for 90-day mortality according to the type of cancer surgery to examine whether the type of cancer surgery affected the main results. There was no multicollinearity between variables in the models with the criterion of variance inflation factors < 2.0. All statistical analyses were performed using R software (version 4.0.3; R Foundation for Statistical Computing, Vienna, Austria), and statistical significance was set at P < 0.05.

Ethics statement

This study involved human participants, and all procedures were conducted in accordance with the guidelines provided by the relevant ethics boards. The study protocol was reviewed and approved by the relevant Institutional Review Board (X-2105-686-904) and the NHIS (NHIS-2022-1-336). The requirement for informed consent was waived because data analyses were performed retrospectively using anonymous data derived from the South Korean NHIS database.

RESULTS

Study population

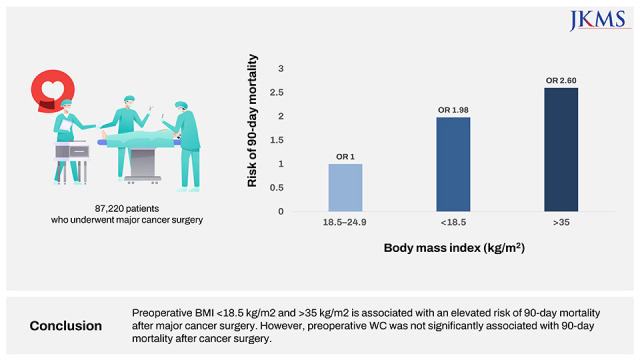
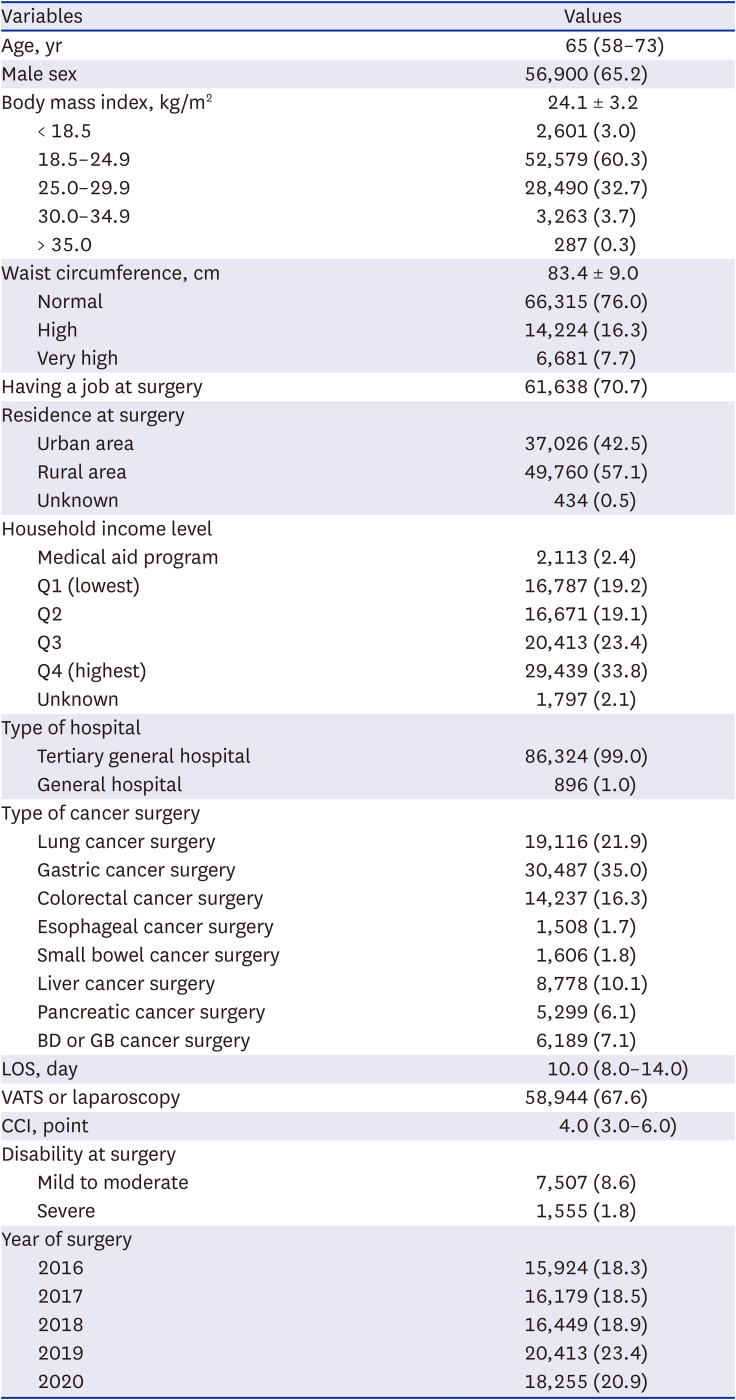
Fig. 1 shows a flowchart depicting the patient selection process in this study. From January 1, 2016 to December 31, 2020, 253,538 patients underwent major cancer surgery with curative intent in South Korea. Among them, 166,311 patients who did not have data regarding standardized health examinations in the year prior to cancer surgery and seven patients who did not have WC data were excluded from the final analysis. Thus, 87,220 patients were included in the final analysis. A total of 454 (0.6%) and 1,374 (1.6%) patients died within 30 days and 90 days after the date of cancer surgery, respectively. Table 1 shows the clinicopathological characteristics of patients. The median age was 65.0 years old (IQR, 58–73 years), and the proportion of males was 65.2% (56,900/87,220).
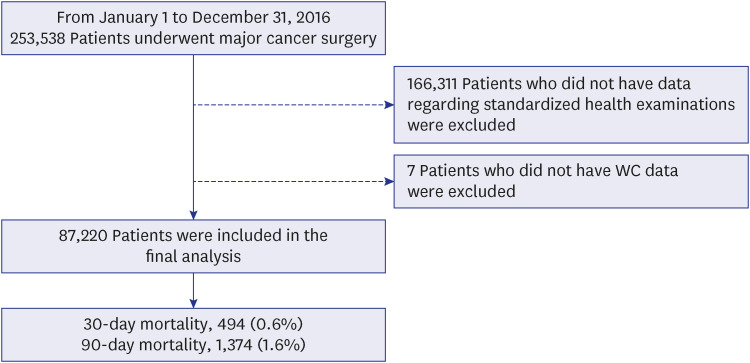
Fig. 1

Flow chart depicting patients’ selection process.

WC = waist circumference.
jkms-38-e310-g001
Table 1

Clinicopathological characteristics of patients

jkms-38-e310-i001
Variables Values
Age, yr 65 (58–73)
Male sex 56,900 (65.2)
Body mass index, kg/m2 24.1 ± 3.2
< 18.5 2,601 (3.0)
18.5–24.9 52,579 (60.3)
25.0–29.9 28,490 (32.7)
30.0–34.9 3,263 (3.7)
> 35.0 287 (0.3)
Waist circumference, cm 83.4 ± 9.0
Normal 66,315 (76.0)
High 14,224 (16.3)
Very high 6,681 (7.7)
Having a job at surgery 61,638 (70.7)
Residence at surgery
Urban area 37,026 (42.5)
Rural area 49,760 (57.1)
Unknown 434 (0.5)
Household income level
Medical aid program 2,113 (2.4)
Q1 (lowest) 16,787 (19.2)
Q2 16,671 (19.1)
Q3 20,413 (23.4)
Q4 (highest) 29,439 (33.8)
Unknown 1,797 (2.1)
Type of hospital
Tertiary general hospital 86,324 (99.0)
General hospital 896 (1.0)
Type of cancer surgery
Lung cancer surgery 19,116 (21.9)
Gastric cancer surgery 30,487 (35.0)
Colorectal cancer surgery 14,237 (16.3)
Esophageal cancer surgery 1,508 (1.7)
Small bowel cancer surgery 1,606 (1.8)
Liver cancer surgery 8,778 (10.1)
Pancreatic cancer surgery 5,299 (6.1)
BD or GB cancer surgery 6,189 (7.1)
LOS, day 10.0 (8.0–14.0)
VATS or laparoscopy 58,944 (67.6)
CCI, point 4.0 (3.0–6.0)
Disability at surgery
Mild to moderate 7,507 (8.6)
Severe 1,555 (1.8)
Year of surgery
2016 15,924 (18.3)
2017 16,179 (18.5)
2018 16,449 (18.9)
2019 20,413 (23.4)
2020 18,255 (20.9)
Values are presented as median (interquartile range), number (%), or mean ± standard deviation.
BD = bile duct, GB = gallbladder, LOS = length of hospital stays, VATS = video assisted thoracoscopic surgery, CCI = Charlson comorbidity index.

RCS

Supplementary Figs. 1 and 2 show the RCS, which represents log odds of 90- or 30-day mortality after cancer surgery according to preoperative BMI or WC. Both the log odds of 90- and 30-day mortality increased with lower BMI. Compared to BMI, WC did not show a significant trend for log odds in both 90- and 30-day mortality.

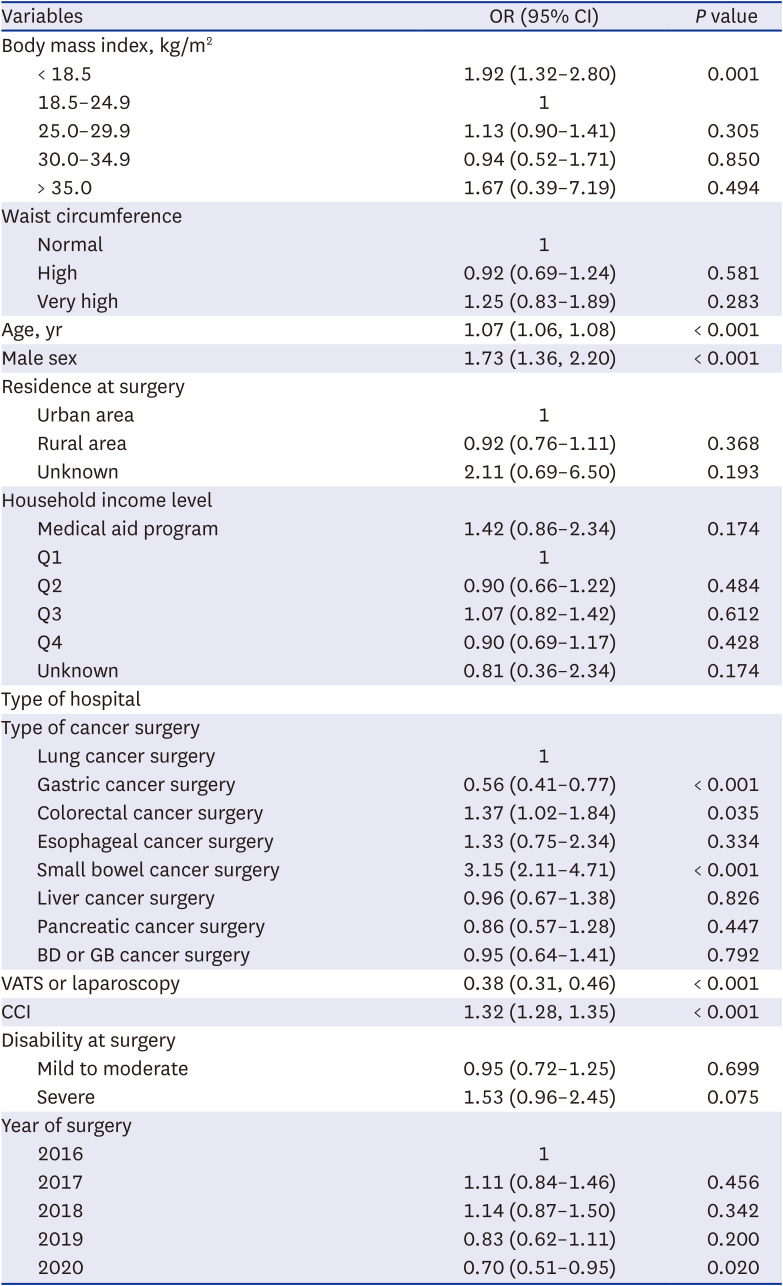
BMI, WC and mortality

Supplementary Tables 2 and 3 present the results of univariate logistic regression analyses for 90- and 30-day mortality after cancer surgery. Table 2 shows the results of the multiple logistic regression model for 90-day mortality after cancer surgery. Compared to the BMI 18.5–24.9 kg/m2 group, the BMI < 18.5 kg/m2 and > 35 kg/m2 groups show 1.98-fold (OR, 1.98; 95% CI, 1.58–2.49; P < 0.001) and 2.60-fold (OR, 2.60; 95% CI, 1.25–5.40; P < 0.001) higher 90-day mortality after cancer surgery. The BMI 25.0–29.9 kg/m2 (P = 0.144) and 30.0–34.9 kg/m2 (P = 0.105) groups did not show significant differences compared to the BMI 18.5–24.9 kg/m2 group. The high WC group (P = 0.052) and very high WC group (P = 0.232) also did not show significant differences in terms of 90-day mortality compared with the normal WC group. Table 3 shows the results of the multiple logistic regression model for 30-day mortality after cancer surgery. Compared to the BMI 18.5–24.9 kg/m2 group, the BMI < 18.5 kg/m2 group shows 1.92-fold (OR, 1.92; 95% CI, 1.32–2.80; P < 0.001) higher 30-day mortality after cancer surgery. The BMI 25.0–29.9 kg/m2 (P = 0.305), 30.0–34.9 kg/m2 (P = 0.850), and > 35 kg/m2 (P = 0.494) groups did not show significant differences compared to the BMI 18.5–24.9 kg/m2 group. The high (P = 0.581) and very high WC groups also did not show significant differences in terms of 30-day mortality compared with the normal WC group (P = 0.283).
Table 2

Multiple logistic regression model for 90-day mortality after cancer surgery
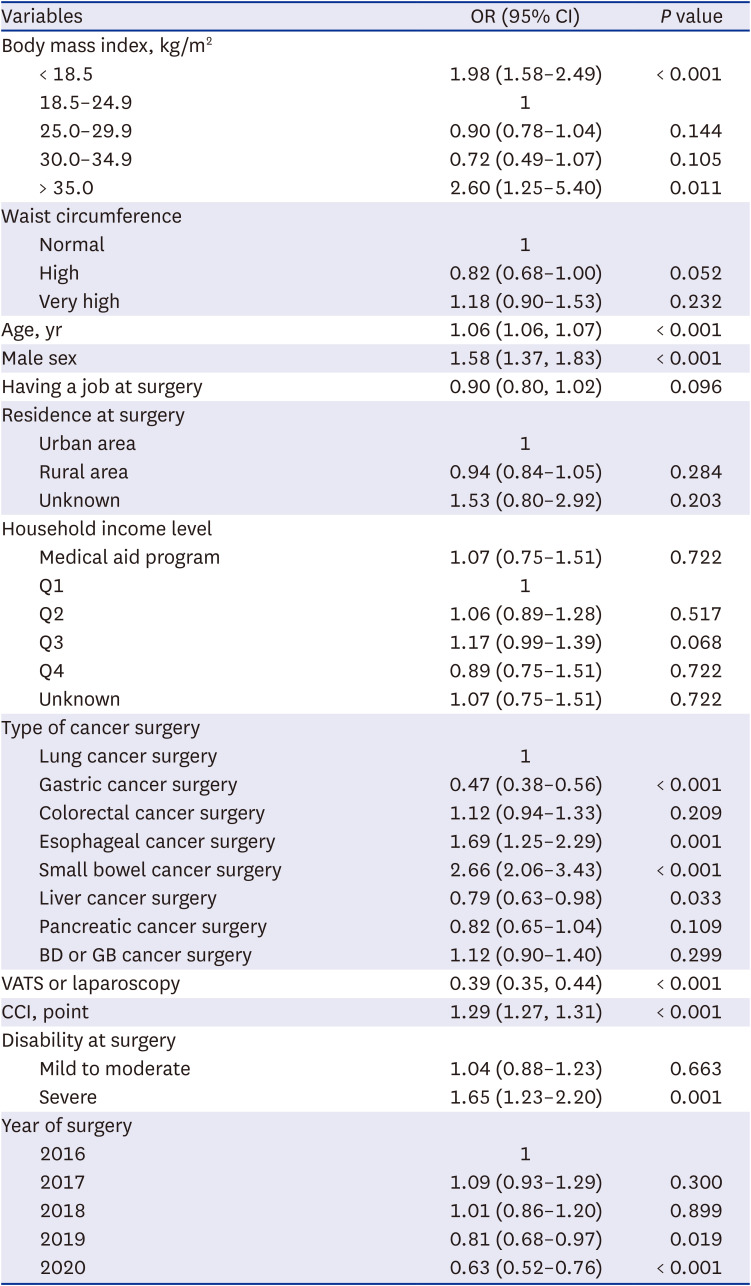
jkms-38-e310-i002
Variables OR (95% CI) P value
Body mass index, kg/m2
< 18.5 1.98 (1.58–2.49) < 0.001
18.5–24.9 1
25.0–29.9 0.90 (0.78–1.04) 0.144
30.0–34.9 0.72 (0.49–1.07) 0.105
> 35.0 2.60 (1.25–5.40) 0.011
Waist circumference
Normal 1
High 0.82 (0.68–1.00) 0.052
Very high 1.18 (0.90–1.53) 0.232
Age, yr 1.06 (1.06, 1.07) < 0.001
Male sex 1.58 (1.37, 1.83) < 0.001
Having a job at surgery 0.90 (0.80, 1.02) 0.096
Residence at surgery
Urban area 1
Rural area 0.94 (0.84–1.05) 0.284
Unknown 1.53 (0.80–2.92) 0.203
Household income level
Medical aid program 1.07 (0.75–1.51) 0.722
Q1 1
Q2 1.06 (0.89–1.28) 0.517
Q3 1.17 (0.99–1.39) 0.068
Q4 0.89 (0.75–1.51) 0.722
Unknown 1.07 (0.75–1.51) 0.722
Type of cancer surgery
Lung cancer surgery 1
Gastric cancer surgery 0.47 (0.38–0.56) < 0.001
Colorectal cancer surgery 1.12 (0.94–1.33) 0.209
Esophageal cancer surgery 1.69 (1.25–2.29) 0.001
Small bowel cancer surgery 2.66 (2.06–3.43) < 0.001
Liver cancer surgery 0.79 (0.63–0.98) 0.033
Pancreatic cancer surgery 0.82 (0.65–1.04) 0.109
BD or GB cancer surgery 1.12 (0.90–1.40) 0.299
VATS or laparoscopy 0.39 (0.35, 0.44) < 0.001
CCI, point 1.29 (1.27, 1.31) < 0.001
Disability at surgery
Mild to moderate 1.04 (0.88–1.23) 0.663
Severe 1.65 (1.23–2.20) 0.001
Year of surgery
2016 1
2017 1.09 (0.93–1.29) 0.300
2018 1.01 (0.86–1.20) 0.899
2019 0.81 (0.68–0.97) 0.019
2020 0.63 (0.52–0.76) < 0.001
OR = odds ratio, CI = confidence interval, BD = bile duct, GB = gallbladder, VATS = video assisted thoracoscopic surgery, CCI = Charlson comorbidity index.
Table 3

Multiple logistic regression model for 30-day mortality after cancer surgery
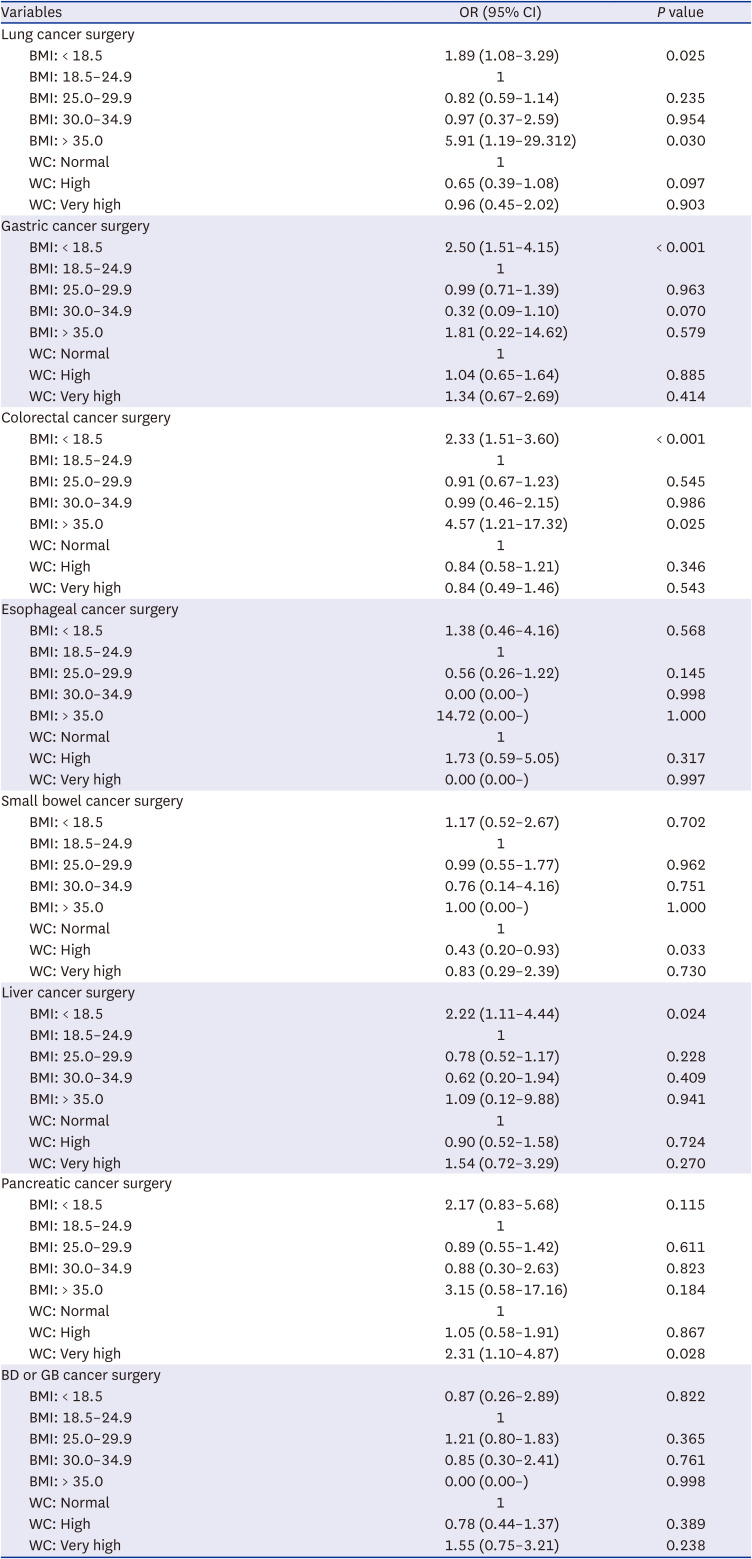
jkms-38-e310-i003
Variables OR (95% CI) P value
Body mass index, kg/m2
< 18.5 1.92 (1.32–2.80) 0.001
18.5–24.9 1
25.0–29.9 1.13 (0.90–1.41) 0.305
30.0–34.9 0.94 (0.52–1.71) 0.850
> 35.0 1.67 (0.39–7.19) 0.494
Waist circumference
Normal 1
High 0.92 (0.69–1.24) 0.581
Very high 1.25 (0.83–1.89) 0.283
Age, yr 1.07 (1.06, 1.08) < 0.001
Male sex 1.73 (1.36, 2.20) < 0.001
Residence at surgery
Urban area 1
Rural area 0.92 (0.76–1.11) 0.368
Unknown 2.11 (0.69–6.50) 0.193
Household income level
Medical aid program 1.42 (0.86–2.34) 0.174
Q1 1
Q2 0.90 (0.66–1.22) 0.484
Q3 1.07 (0.82–1.42) 0.612
Q4 0.90 (0.69–1.17) 0.428
Unknown 0.81 (0.36–2.34) 0.174
Type of hospital
Type of cancer surgery
Lung cancer surgery 1
Gastric cancer surgery 0.56 (0.41–0.77) < 0.001
Colorectal cancer surgery 1.37 (1.02–1.84) 0.035
Esophageal cancer surgery 1.33 (0.75–2.34) 0.334
Small bowel cancer surgery 3.15 (2.11–4.71) < 0.001
Liver cancer surgery 0.96 (0.67–1.38) 0.826
Pancreatic cancer surgery 0.86 (0.57–1.28) 0.447
BD or GB cancer surgery 0.95 (0.64–1.41) 0.792
VATS or laparoscopy 0.38 (0.31, 0.46) < 0.001
CCI 1.32 (1.28, 1.35) < 0.001
Disability at surgery
Mild to moderate 0.95 (0.72–1.25) 0.699
Severe 1.53 (0.96–2.45) 0.075
Year of surgery
2016 1
2017 1.11 (0.84–1.46) 0.456
2018 1.14 (0.87–1.50) 0.342
2019 0.83 (0.62–1.11) 0.200
2020 0.70 (0.51–0.95) 0.020
OR = odds ratio, CI = confidence interval, BD = bile duct, GB = gallbladder, VATS = video assisted thoracoscopic surgery, CCI = Charlson comorbidity index.

Subgroup analyses

Table 4 shows the results of the subgroup analyses for 90-day mortality according to cancer surgery type. Compared to the BMI 18.5–24.9 kg/m2 group, the BMI < 18.5 kg/m2 group showed higher 90-day mortality after lung (OR, 1.89; 95% CI, 1.08–3.29; P = 0.025), gastric (OR, 2.50; 95% CI, 1.51–4.15; P < 0.001), colorectal (OR, 2.33; 95% CI, 1.51–3.60; P < 0.001), and liver (OR, 2.22; 95% CI, 1.11–4.44; P = 0.024) cancer surgeries. Preoperative WC did not affect the 90-day mortality after all types of cancer surgery (all P > 0.05).
Table 4

Subgroup analyses for 90-day mortality according to cancer surgery type

jkms-38-e310-i004
Variables OR (95% CI) P value
Lung cancer surgery
BMI: < 18.5 1.89 (1.08–3.29) 0.025
BMI: 18.5–24.9 1
BMI: 25.0–29.9 0.82 (0.59–1.14) 0.235
BMI: 30.0–34.9 0.97 (0.37–2.59) 0.954
BMI: > 35.0 5.91 (1.19–29.312) 0.030
WC: Normal 1
WC: High 0.65 (0.39–1.08) 0.097
WC: Very high 0.96 (0.45–2.02) 0.903
Gastric cancer surgery
BMI: < 18.5 2.50 (1.51–4.15) < 0.001
BMI: 18.5–24.9 1
BMI: 25.0–29.9 0.99 (0.71–1.39) 0.963
BMI: 30.0–34.9 0.32 (0.09–1.10) 0.070
BMI: > 35.0 1.81 (0.22–14.62) 0.579
WC: Normal 1
WC: High 1.04 (0.65–1.64) 0.885
WC: Very high 1.34 (0.67–2.69) 0.414
Colorectal cancer surgery
BMI: < 18.5 2.33 (1.51–3.60) < 0.001
BMI: 18.5–24.9 1
BMI: 25.0–29.9 0.91 (0.67–1.23) 0.545
BMI: 30.0–34.9 0.99 (0.46–2.15) 0.986
BMI: > 35.0 4.57 (1.21–17.32) 0.025
WC: Normal 1
WC: High 0.84 (0.58–1.21) 0.346
WC: Very high 0.84 (0.49–1.46) 0.543
Esophageal cancer surgery
BMI: < 18.5 1.38 (0.46–4.16) 0.568
BMI: 18.5–24.9 1
BMI: 25.0–29.9 0.56 (0.26–1.22) 0.145
BMI: 30.0–34.9 0.00 (0.00–) 0.998
BMI: > 35.0 14.72 (0.00–) 1.000
WC: Normal 1
WC: High 1.73 (0.59–5.05) 0.317
WC: Very high 0.00 (0.00–) 0.997
Small bowel cancer surgery
BMI: < 18.5 1.17 (0.52–2.67) 0.702
BMI: 18.5–24.9 1
BMI: 25.0–29.9 0.99 (0.55–1.77) 0.962
BMI: 30.0–34.9 0.76 (0.14–4.16) 0.751
BMI: > 35.0 1.00 (0.00–) 1.000
WC: Normal 1
WC: High 0.43 (0.20–0.93) 0.033
WC: Very high 0.83 (0.29–2.39) 0.730
Liver cancer surgery
BMI: < 18.5 2.22 (1.11–4.44) 0.024
BMI: 18.5–24.9 1
BMI: 25.0–29.9 0.78 (0.52–1.17) 0.228
BMI: 30.0–34.9 0.62 (0.20–1.94) 0.409
BMI: > 35.0 1.09 (0.12–9.88) 0.941
WC: Normal 1
WC: High 0.90 (0.52–1.58) 0.724
WC: Very high 1.54 (0.72–3.29) 0.270
Pancreatic cancer surgery
BMI: < 18.5 2.17 (0.83–5.68) 0.115
BMI: 18.5–24.9 1
BMI: 25.0–29.9 0.89 (0.55–1.42) 0.611
BMI: 30.0–34.9 0.88 (0.30–2.63) 0.823
BMI: > 35.0 3.15 (0.58–17.16) 0.184
WC: Normal 1
WC: High 1.05 (0.58–1.91) 0.867
WC: Very high 2.31 (1.10–4.87) 0.028
BD or GB cancer surgery
BMI: < 18.5 0.87 (0.26–2.89) 0.822
BMI: 18.5–24.9 1
BMI: 25.0–29.9 1.21 (0.80–1.83) 0.365
BMI: 30.0–34.9 0.85 (0.30–2.41) 0.761
BMI: > 35.0 0.00 (0.00–) 0.998
WC: Normal 1
WC: High 0.78 (0.44–1.37) 0.389
WC: Very high 1.55 (0.75–3.21) 0.238
OR = odds ratio, CI = confidence interval, BMI = body mass index, WC = waist circumference, BD = bile duct, GB = gallbladder.

DISCUSSION

This population-based cohort study showed that a preoperative BMI < 18.5 kg/m2 and > 35 kg/m2 groups has an increased risk of 90-day mortality after major cancer surgery. However, preoperative WC was not significantly associated with the 90-day mortality after cancer surgery. Moreover, this association was more evident in patients who underwent lung, gastric, colorectal, and liver cancer surgeries. Our results suggest that having low or very high preoperative BMI might be risk factors for increased mortality after cancer surgery unlike preoperative WC.
Patients who are underweight, with a BMI < 18.5 kg/m2, were reported as a high-risk group for increased postoperative mortality in several previous studies.121314 Low BMI is a well-known factor reflecting malnutrition; a BMI of 17.0 kg/m2 and 17.8 kg/m2 defines malnutrition for younger and older patients, respectively.19 The BMI < 18.5 kg/m2 used in this study is similar to the value of 17.0–17.8 kg/m2, and reflects preoperative malnutrition in patients who underwent major cancer surgeries. Interestingly, a preoperative BMI < 18.5 kg/m2 was associated with higher 90-day mortality in patients who underwent lung, gastric, colorectal, and liver cancer surgeries. Gastric, colorectal, and liver cancers are important gastrointestinal tract cancers that might have a higher risk for malnutrition than do other types of cancer.20 Preoperative malnutrition is associated with a higher risk of mortality and morbidity after major intra-abdominal, gastric, colorectal, and liver cancer.12131421
A BMI > 35 kg/m2 was associated with a higher risk of 90-day mortality after major cancer surgery. The BMI ≥ 35 kg/m2 group classified as having grades 2 and 3 obesity was associated with significantly higher all-cause mortality, whereas a BMI of 30–35 kg/m2 (grade 1 obesity) was not associated with mortality.22 Moreover, a recent meta-analysis reported that being underweight (BMI < 18.5 kg/m2) or having class II/III obesity (BMI > 35 kg/m2) at the time of colorectal cancer surgery may result in worse long-term survival outcomes,23 which is similar to the results of our study. Thus, our results suggest that patients with class II/III obesity (BMI > 35 kg/m2) need to optimize BMI before undergoing major cancer surgery. However, another recent cohort study in South Korea reported that a BMI ≥ 30 kg/m2 (obese) was associated with a lower risk of mortality after cancer surgery.24 As the study did not evaluate the impact of preoperative BMI > 35 kg/m2 on mortality after cancer surgery,24 additional studies are needed to confirm the effect of high preoperative BMI on mortality after cancer surgery.
In the subgroup analyses, BMI ≥ 35 kg/m2 was significantly associated with increased 90-day mortality in patients who underwent lung cancer or colorectal cancer surgery. Obesity is a known risk factor for postoperative lung complications, such as pneumonia, prolonged mechanical ventilation, and respiratory failure.2526 As postoperative pulmonary events are known complications after lung cancer surgery,27 the impact of severe obesity (BMI ≥ 35 kg/m2) might be significant in patients undergoing this surgery. Moreover, a nationwide inpatient sample study in the United States reported that morbid obesity (BMI ≥ 40 kg/m2) was associated with increased surgical complications and postoperative mortality.28 In an Asian colorectal cancer surgery, BMI ≥ 30 kg/m2 was associated with longer operation time, longer postoperative hospital stays, and higher conversion rate. Hence, obesity could be an independent risk factor for postoperative complications in patients undergoing colorectal surgery, possibly influencing the results in this study.
The novel finding of our study is that preoperative WC was not a significant predictor of mortality after major cancer surgery. Although BMI has been traditionally used to measure body size and nutritional status, WC, which reflects central obesity, has been suggested to be superior than BMI in predicting risk for cardiovascular disease.29 WC is strongly correlated with abdominal obesity and is the most commonly used clinical measure for body fat distribution.30 A previous pooled analysis of 650,000 adults showed that a higher WC was positively associated with higher mortality at all levels of BMI.31 However, no study has reported the effect of preoperative WC on mortality after cancer surgery, and our results suggest that preoperative WC should not be considered in predicting mortality after cancer surgery.
Our study has several limitations. First, the stages of tumors among patients with major cancers were not evaluated, which could affect mortality after cancer surgery. Moreover, the prevalence of malnutrition in patients with advanced stage tumor is high and may affect the preoperative BMI of patients who undergo cancer surgery.32 Second, there might be some residual confounders in this study, which might have affected the results. Third, the generalizability of the results may be limited because the environment or health policies for patients with cancer differ in each country. Fourth, information on the duration of cancer surgery or anesthetic technique was not included in this study because such information was not present in the NHIS database. Lastly, since we measured the BMI and WC a year prior to the surgery, there may have been changes in the measurement prior to the date of the actual surgery.
In conclusion, in South Korea, preoperative BMI < 18.5 kg/m2 and > 35 kg/m2 are associated with an elevated risk of 90-day mortality after major cancer surgery. However, preoperative WC was not significantly associated with 90-day mortality after cancer surgery. This association was more evident in patients who underwent lung, gastric, colorectal, and liver cancer surgery. Our results suggest that preoperative BMI must be optimized for better survival outcomes in major cancer surgery, whereas preoperative WC does not require optimization.

Notes

Disclosure: The authors have no potential conflicts of interest to disclose.

Author Contributions:

  • Conceptualization: Oh TK, Song IA.

  • Data curation: Oh TK.

  • Formal analysis: Oh TK.

  • Methodology: Song IA.

  • Writing - original draft: Oh TK.

  • Writing - review & editing: Song IA.

References

1. Bray F, Jemal A, Grey N, Ferlay J, Forman D. Global cancer transitions according to the Human Development Index (2008-2030): a population-based study. Lancet Oncol. 2012; 13(8):790–801. PMID: 22658655.
2. Foreman KJ, Marquez N, Dolgert A, Fukutaki K, Fullman N, McGaughey M, et al. Forecasting life expectancy, years of life lost, and all-cause and cause-specific mortality for 250 causes of death: reference and alternative scenarios for 2016-40 for 195 countries and territories. Lancet. 2018; 392(10159):2052–2090. PMID: 30340847.
3. Global Burden of Disease 2019 Cancer Collaboration. Kocarnik JM, Compton K, Dean FE, Fu W, Gaw BL, et al. Cancer incidence, mortality, years of life lost, years lived with disability, and disability-adjusted life years for 29 cancer groups from 2010 to 2019: a systematic analysis for the global burden of disease study 2019. JAMA Oncol. 2022; 8(3):420–444. PMID: 34967848.
4. Wyld L, Audisio RA, Poston GJ. The evolution of cancer surgery and future perspectives. Nat Rev Clin Oncol. 2015; 12(2):115–124. PMID: 25384943.
5. Sullivan R, Alatise OI, Anderson BO, Audisio R, Autier P, Aggarwal A, et al. Global cancer surgery: delivering safe, affordable, and timely cancer surgery. Lancet Oncol. 2015; 16(11):1193–1224. PMID: 26427363.
6. Janssen I, Katzmarzyk PT, Ross R. Body mass index, waist circumference, and health risk: evidence in support of current National Institutes of Health guidelines. Arch Intern Med. 2002; 162(18):2074–2079. PMID: 12374515.
7. Wong TJ, Yu T. Trends in the distribution of body mass index, waist circumference and prevalence of obesity among Taiwanese adults, 1993-2016. PLoS One. 2022; 17(9):e0274134. PMID: 36084122.
8. Olson CM. Nutrition and health outcomes associated with food insecurity and hunger. J Nutr. 1999; 129(2S):Suppl. 521S–4S. PMID: 10064322.
9. Kim YH, Kim SM, Han KD, Jung JH, Lee SS, Oh SW, et al. Waist circumference and all-cause mortality independent of body mass index in Korean population from the National Health Insurance Health Checkup 2009-2015. J Clin Med. 2019; 8(1):72. PMID: 30634601.
10. Liu R, Dang S, Zhao Y, Yan H, Han Y, Mi B. Long-term waist circumference trajectories and body mass index with all-cause mortality in older Chinese adults: a prospective nationwide cohort study. Arch Public Health. 2022; 80(1):94. PMID: 36088350.
11. O’Súilleabháin PS, Sutin AR, Gerstorf D. Body mass index, waist circumference, and mortality risks over 27 years of follow-up in old age. Ann Epidemiol. 2020; 46:20–23. PMID: 32532369.
12. Mullen JT, Davenport DL, Hutter MM, Hosokawa PW, Henderson WG, Khuri SF, et al. Impact of body mass index on perioperative outcomes in patients undergoing major intra-abdominal cancer surgery. Ann Surg Oncol. 2008; 15(8):2164–2172. PMID: 18548313.
13. Lee JH, Park B, Joo J, Kook MC, Kim YI, Lee JY, et al. Body mass index and mortality in patients with gastric cancer: a large cohort study. Gastric Cancer. 2018; 21(6):913–924. PMID: 29651648.
14. Fuchs J, Schellerer VS, Brunner M, Geppert CI, Grützmann R, Weber K, et al. The impact of body mass index on prognosis in patients with colon carcinoma. Int J Colorectal Dis. 2022; 37(5):1107–1117. PMID: 35426079.
15. Song SO, Jung CH, Song YD, Park CY, Kwon HS, Cha BS, et al. Background and data configuration process of a nationwide population-based study using the Korean National Health Insurance system. Diabetes Metab J. 2014; 38(5):395–403. PMID: 25349827.
16. Lean ME, Han TS, Morrison CE. Waist circumference as a measure for indicating need for weight management. BMJ. 1995; 311(6998):158–161. PMID: 7613427.
17. Damhuis RA, Wijnhoven BP, Plaisier PW, Kirkels WJ, Kranse R, van Lanschot JJ. Comparison of 30-day, 90-day and in-hospital postoperative mortality for eight different cancer types. Br J Surg. 2012; 99(8):1149–1154. PMID: 22718521.
18. Song YJ. The South Korean health care system. Japan Med Assoc J. 2009; 52(3):206–209.
19. Maeda K, Ishida Y, Nonogaki T, Mori N. Reference body mass index values and the prevalence of malnutrition according to the Global Leadership Initiative on Malnutrition criteria. Clin Nutr. 2020; 39(1):180–184. PMID: 30712782.
20. Yoon SH, Kye BH, Kim HJ, Jun KH, Cho HM, Chin HM. Risk of malnutrition after gastrointestinal cancer surgery: a propensity score matched retrospective cohort study. Surg Metab Nutr. 2018; 9(1):16–25.
21. Huang TH, Hsieh CC, Kuo LM, Chang CC, Chen CH, Chi CC, et al. Malnutrition associated with an increased risk of postoperative complications following hepatectomy in patients with hepatocellular carcinoma. HPB. 2019; 21(9):1150–1155. PMID: 30765200.
22. Flegal KM, Kit BK, Orpana H, Graubard BI. Association of all-cause mortality with overweight and obesity using standard body mass index categories: a systematic review and meta-analysis. JAMA. 2013; 309(1):71–82. PMID: 23280227.
23. Simillis C, Taylor B, Ahmad A, Lal N, Afxentiou T, Powar MP, et al. A systematic review and meta-analysis assessing the impact of body mass index on long-term survival outcomes after surgery for colorectal cancer. Eur J Cancer. 2022; 172:237–251. PMID: 35797761.
24. Park J, Lee SH, Lee JH, Min JJ, Oh AR, Kim K, et al. Association between high preoperative body mass index and mortality after cancer surgery. PLoS One. 2022; 17(7):e0270460. PMID: 35802728.
25. Newell MA, Bard MR, Goettler CE, Toschlog EA, Schenarts PJ, Sagraves SG, et al. Body mass index and outcomes in critically injured blunt trauma patients: weighing the impact. J Am Coll Surg. 2007; 204(5):1056–1061. PMID: 17481540.
26. Bamgbade OA, Rutter TW, Nafiu OO, Dorje P. Postoperative complications in obese and nonobese patients. World J Surg. 2007; 31(3):556–560. PMID: 16957821.
27. Uhlig C, Neto AS, van der Woude M, Kiss T, Wittenstein J, Shelley B, et al. Intraoperative mechanical ventilation practice in thoracic surgery patients and its association with postoperative pulmonary complications: results of a multicenter prospective observational study. BMC Anesthesiol. 2020; 20(1):179. PMID: 32698775.
28. Hussan H, Gray DM 2nd, Hinton A, Krishna SG, Conwell DL, Stanich PP. Morbid obesity is associated with increased mortality, surgical complications, and incremental health care utilization in the peri-operative period of colorectal cancer surgery. World J Surg. 2016; 40(4):987–994. PMID: 26643515.
29. Huxley R, Mendis S, Zheleznyakov E, Reddy S, Chan J. Body mass index, waist circumference and waist:hip ratio as predictors of cardiovascular risk--a review of the literature. Eur J Clin Nutr. 2010; 64(1):16–22. PMID: 19654593.
30. Janssen I, Heymsfield SB, Allison DB, Kotler DP, Ross R. Body mass index and waist circumference independently contribute to the prediction of nonabdominal, abdominal subcutaneous, and visceral fat. Am J Clin Nutr. 2002; 75(4):683–688. PMID: 11916754.
31. Cerhan JR, Moore SC, Jacobs EJ, Kitahara CM, Rosenberg PS, Adami HO, et al. A pooled analysis of waist circumference and mortality in 650,000 adults. Mayo Clin Proc. 2014; 89(3):335–345. PMID: 24582192.
32. Wie GA, Cho YA, Kim SY, Kim SM, Bae JM, Joung H. Prevalence and risk factors of malnutrition among cancer patients according to tumor location and stage in the National Cancer Center in Korea. Nutrition. 2010; 26(3):263–268. PMID: 19665873.

SUPPLEMENTARY MATERIALS

Supplementary Table 1

The ICD-10 codes used by comorbidity to compute the Charlson comorbidity index
jkms-38-e310-s001.doc

Supplementary Table 2

Univariate regression analysis for 90-day mortality after cancer surgery
jkms-38-e310-s002.doc

Supplementary Table 3

Univariate logistic regression analysis for 30-day mortality after cancer surgery
jkms-38-e310-s003.doc

Supplementary Fig. 1

Restricted Cubic Splines which represents log odds of 90- or 30-day mortality after cancer surgery according to preoperative body mass index.
jkms-38-e310-s004.doc

Supplementary Fig. 2

Restricted Cubic Splines which represents log odds of 90- or 30-day mortality after cancer surgery according to preoperative waist circumference.
jkms-38-e310-s005.doc
TOOLS
Similar articles