

 PDF
PDF Citation
 Print
Print


INTRODUCTION
Glioblastoma is the most lethal and common malignant tumor of the central nervous system (CNS), accounting for approximately 12–15% of all primary brain tumors and 60–75% of all glial tumors.123 According to epidemiological reports, the annual incidence of glioblastoma in Europe, North America, and Australia is approximately 3–4 cases per 100,000 people.1 Glioblastoma is classified by the World Health Organization (WHO) as a grade IV tumor based on its histopathological features. It is defined as a diffuse glioma characterized by a high ability to infiltrate the surrounding brain tissue.2 A randomized phase III clinical trial showed that concomitant chemoradiotherapy with temozolomide followed by adjuvant temozolomide treatment improved the survival of glioblastoma patients compared to conventional postoperative radiotherapy alone.4 After a long-term follow-up, the final results of this trial, which were published in 20095 revealed an increase in the median length of survival (up to 12–15 months) and better out-comes in patients with the methylated promoter of the O6-methyl guanine DNA methyl-transferase (MGMT) gene; thus, this treatment method with temozolomide was considered as the current standard method for patients with glioblastoma.
Despite the increase in the number of experimental studies focusing on various treatment methods for patients with glioblastoma and the recent improvements in therapeutic strategies, glioblastoma continues to remain essentially incurable, with an overall survival (OS) time of 12–18 months5; < 5% of patients survive longer than five years after diagnosis.45 Comprehensive studies on the tumor immune microenvironment and the recent discovery of a conventional lymphatic system in the meninges have provided a new impetus to immunotherapeutic strategies, emerging as promising targeted and less toxic treatments.6
Recent advancements in cancer therapy in relation to immune checkpoint blockade, including anti-programmed cell death (PD)-1, anti-PD ligand (PD-L)-1, and anti-cytotoxic T-lymphocyte-associated protein (CTLA)-4 targeted agents, have produced a revolutionary shift in cancer treatment and successfully demonstrated favorable responses in various types of tumors.78 Immunotherapy, particularly immune checkpoint blockade therapy, has been approved by the U.S. Food and Drug Administration for multiple types of cancers, including recurrent glioblastoma. However, early results from clinical trials on glioblastoma have not demonstrated any significant clinical benefits, the application of these agents in this tumor has yielded disappointing outcomes in phase III clinical trials.910111213 This is likely due to multiple factors, such as the marked genetic and antigenic heterogeneity of the tumor, relatively low mutational burden in the genes, and paucity of glioblastoma-infiltrating T cells. Therefore, glioblastoma is generally considered as a “cold tumor.”
The tumor microenvironment of glioblastoma is relatively unique in its cellular composition and accessibility to immune cells. The factors that make the tumor microenvironment unique also contribute to its highly immunosuppressive and “cold” phenotype. Unlike the immunologically “hot tumor,” the stroma of the tumor microenvironment can act as a genetically stable therapeutic target. Therefore, reducing the immunosuppression caused by these stromal cells can promote the infiltration of functional effector T cells and create new opportunities for treatment. Among the various cellular immune components in the tumor microenvironment, such as tumor-infiltrating lymphocytes (TILs), tumor-associated macrophages, and natural killer cells, TILs have the potential to exert both pro- and anti-tumor functions in glioblastomas. CD8+ cytotoxic T lymphocytes (CTLs) are considered critical for tumor clearance, but account for less than a quarter of the already sparse TIL population in the tumor microenvironment.14 Functional characterization of CTLs in the tumor microenvironment showed that these cells had impaired effector functions and an exhausted phenotype, rendering them ineffective as CTLs.15 These functions of TILs are regulated by interactions between co-stimulatory and co-inhibitory receptors and ligands, which are located on the surfaces of the TILs and cancer cells.1617 However, recent immuno-oncology studies have been focusing on the developing way to overcome chronic immunologic exhaustion in cancer cell which is derived by mainly immune checkpoint molecules such as PD1 and PDL1. These immune check inhibitors are also a part of co-inhibitory molecule of TILs. However, it is fact that there are relatively fewer studies in co-stimulatory molecules of TILs than co-inhibitory ones of TILs because of complex mechanisms and multiple actions of co-stimulatory receptors. It is certain that several study showed the role of co-stimulatory receptors in cancer biology such as cytotoxic anti-tumor functions of CD28 and CD226 in melanoma,1819 stimulatory effect of T-cell of CD137 in non-small cell lung cancer, intrahepatic cholangiocarcinoma, and colorectal cancers,2021 promoting Treg proliferation of OX40 in malignant melanoma and colorectal cancer,2223 and anti-tumor immune response of inducible T cell co-stimulator (ICOS) in lung cancer and colorectal cancer.2425 Even there are reports that the expression of these co-stimulatory factor should be associated with patients outcomes.2223 Although the agonists of these effective co-stimulatory factors play roles in anti-tumor immunity, such treatments are not sufficient in all tumors because the co-stimulatory factor doesn’t act solely but with multiple interaction of co-inhibitory factors at the same time. On possible means of overcoming this limitation is by combining agonistic therapy with immune checkpoint blockades. Therefore, it is important to understand the co-stimulatory factor and co-inhibitory factors of TILs in cancer. Especially, in human glioblastoma, few studies have discussed the expression of co-stimulatory and co-inhibitory receptors of TILs and their regulation of pro-tumor and/or antitumor effects. The presenting study can be the first study suggesting the role of co-stimulatory and co-inhibitory receptors of TILs in glioblastoma which can be epigenetically regulated by histone modification.
The aim of this study was to examine the expression of T cell co-stimulatory and co-inhibitory factors in human glioblastoma samples obtained via biopsy or surgical resection. The primary end-point was to identify the specific co-stimulatory and co-inhibitory factors that play a prognostic role in patients with glioblastoma. Additionally, the unique histone H3 modification enzymes that regulate the expression of these factors and aid in predicting the prognosis of patients with glioblastoma were investigated.
METHODS
Patients and sample collection
This translational cohort study was conducted using formalin-fixed, paraffin-embedded (FFPE) tissue specimens obtained from patients with glioblastoma via biopsy or surgical resection at our institute from January 2006 to December 2020. A total of 101 patients were histopathologically diagnosed with glioblastoma after surgical resection or biopsy. Among them, 92 patients newly diagnosed with glioblastoma, treated at our institute, and followed up until death, were included in this study. Patients with a history of other cancers were excluded from this study.
The available histological samples were obtained from the Department of Pathology Archives at our institute. All hematoxylin and eosin-stained slides were reviewed by two pathologists (Lee EH, Samsung Changwon Hospital, Changwon, Korea and Kim MS, Kyungpook National University Hospital, Korea) using the 2021 revision of the WHO classification of tumors of the CNS.2 The pathologists were blinded to the clinical and pathological parameters. Samples that were in poor condition were excluded if the tumor was almost entirely necrotized or its contribution to the section was less than 80%. In addition, patients with insufficient medical data were excluded from the analysis.
Clinical data
The epidemiological characteristics (including the gender and age at initial diagnosis and the WHO performance status), extent of resection, recursive partitioning analysis (RPA) classification, type of postoperative adjuvant treatment, duration of follow-up, and dates of recurrence and death were retrospectively reviewed from the medical records. Additionally, the salvage treatment modality after progression was examined.
Radiological characteristics of the brain lesions were evaluated using conventional magnetic resonance imaging (MRI) with gadolinium (Gd) enhancement, MR perfusion, and MR spectroscopy at the time of initial diagnosis. Peritumoral edema was categorized as < 2 cm or ≥ 2 cm from the brain tumor, as assessed by the T2-weighted image. The extent of resection was estimated from the MRI scans acquired within 48 hours of surgery. Subtotal resection was defined as the removal of more than 90% of the Gd-enhancing lesion on the enhanced T1-weighted image, and gross total resection was defined as the lack of a detectable Gd-enhancing lesion. Tumor measurements for determining the treatment responses according to the Response Assessment in Neuro-Oncology criteria were based on the following parameters: changes in the sum of the products of the perpendicular diameters of the enhancing lesions in the T1-weighted images, T2/fluid-attenuated inversion recovery non-enhancing lesion, onset of new lesions, response to corticosteroid treatment, and changes in the clinical status of the patients.26 If multiple lesions were present, the sum of the products of individual measurable lesions was calculated. Radiological studies were performed at 3-month intervals during the follow-up period or if disease progression was clinically suspected. The radiological evaluation was performed by two neuro-radiologists (Kim YM, Samsung Changwon Hospital, Changwon, Korea and Sunwoo MO, Samsung Changwon Hospital, Changwon, Korea), who were blinded to the clinical and pathological parameters.
Routine analysis of the diagnostic markers was performed at the time of initial histopathological diagnosis, according to the 2007 and 2016 WHO classification of CNS tumors. The cellularity, cellular pleomorphism, mitotic count, microvascular proliferation, cellular necrosis, and MGMT gene promoter methylation was evaluated from the pathological reports. Additionally, for the molecular diagnosis of glioblastoma according to the new 2021 WHO classification of CNS tumors,2 the presence of 1p19q codeletions and isocitrate dehydrogenase (IDH) 1/2 mutations was investigated to exclude WHO CNS grade 4 astrocytomas (IDH mutant) using the FFPE samples of glioblastoma.
Immunohistochemical staining and its interpretation
Three to four consecutive sections were obtained from 1 FFPE glioblastoma block per patient for immunohistochemical staining. The expression levels of T cell co-stimulatory factors (CD27, CD28, CD137, CD134 [OX40], and ICOS), T cell co-inhibitory factors (CTLA4, PD1, PD-L1, T cell immunoglobulin mucin-3 [TIM3], and CD200R), histone H3 lysine methyltransferase (mixed lineage leukemia 4 [MLL4], retinoblastoma interacting zinc finger protein [RIZ], enhancer of zeste homolog 1 [EZH1], and nuclear receptor SET domain-containing protein 2 [NSD2]), and histone H3 lysine demethylase (lysine demethylase 5c [KDM5c], jmjc-domain-containing histone demethylase 1a [JMJD1a], ubiquitously transcribed tetratricopeptide repeat gene on X chromosome [UTX], and JMJD3) were examined. The labeled streptavidin-biotin method was applied to the sections, and individual monoclonal or polyclonal primary antibodies were used according to the manufacturers’ instructions (Supplementary Table 1).
In terms of methods for the analysis of immunohistochemical staining results, such as making a positive and negative control for immunohistochemical staining and determining the criterion for immunoreactivity, was followed by our previous report.27
The slides were reviewed by two neuropathologists (Lee EH, Samsung Changwon Hospital, Changwon, Korea and Kim MS, Kyungpook National University Hospital, Korea), who were blinded to the clinical and radiological information. The criterion of judgement by neuropathologist followed the same way in our previous report.27
The area under the receiver operating characteristic (ROC) curve was used to determine the optimal threshold of the mean percentage of immunoreactive cells per 1,000 cells. The method for determining the cutoff value for true positive and negative effect on OS also followed the same way in our previous report.27 For each marker, a sensitivity-specificity analysis was used to determine the cutoff point where the sensitivity and specificity crossed and correlated with longer survival.28 Sequential correlation analysis for OS among the patients was performed according to the cutoff values established for the markers.
Quantitative reverse transcription-polymerase chain reaction for mRNA
For the RNA extraction, seven serial sections (thickness, 8–10 µm) per sample were obtained using a standard microtome (Leica SM2000 R Sliding Microtome, Wetzlar, Germany) with disposable blades and collected directly into sterile 1.5 mL microcentrifuge tubes. The sections were deparaffinized with two prewarmed xylene washes, followed by rinsing in 95%, 75%, and 50% ethanol, as described previously.27 Detail steps were sequentially performed by manufactural protocol and our previous report.27 All primers which were used in this study were synthesized by OriGene Technologies, Inc. (Rockville, MD, USA) (Supplementary Table 2). The genes of the T cell stimulatory/inhibitory factors and histone H3 lysine modification enzymes were estimated by qRT-PCR to validate the results of the immunohistochemical staining.
Survival analysis and statistical analysis
Medical records of the patients’ clinical history and radiographic reports were analyzed. The date of death was confirmed and recorded. OS was defined as the time from the date of diagnosis of glioblastoma until death. The date of biopsy or surgical resection of glioblastoma was recorded as the date of diagnosis. Statistical analyses were performed using SPSS ver. 20.0 (IBM Corp., Armonk, NY, USA). The analysis for differences and comparisons were performed in the same way of our previous study.19 Two-sided P values of < 0.05 were considered statistically significant.
Ethics statement
The Institutional Review Board of Sungkyunkwan University Samsung Changwon Hospital approved the study protocol (SCMC 2016-12-004) on February 23, 2017. This study was conducted in accordance with the guidelines of the Declaration of Helsinki for biomedical research. The requirement of obtaining informed consent was waived owing to the retrospective nature of the study and minimal hazard to the participants.
RESULTS
Characteristics of patients and tumors
Among 92 patients newly diagnosed with glioblastoma between January 2006 and December 2020, 84 were finally included in this study. The remaining eight patients (9.8%) were excluded due to the following reasons: the tissues were almost entirely necrotized in two patients, the tumor contribution to each section was less than 80% in one patient, the molecular genetic classification was changed to CNS WHO grade 4 astrocytoma (IDH mutant) in three patients, and the medical data were insufficient in two cases. The mean age of the patients (males, 52 [61.9%]; females, 42 [38.1%]) at the time of diagnosis was 55.1 years (range 29.4–81.6 years). Thirty-four patients (40.5%) were fully active and able to carry on all pre-disease performance without restriction (WHO performance status 0), whereas 50 patients demonstrated restricted strenuous physical activity in daily life (WHO performance status 1 or 2). Seventy-three patients (86.9%) had undergone radical sectioning of the tumors, and 11 (13.1%) were diagnosed with glioblastoma after a biopsy. The MGMT gene promoter was methylated in 54 (64.3%) patients and unmethylated in 30 (35.7%) patients (Table 1).
Table 1
Characteristics of glioblastoma patients (N = 84)
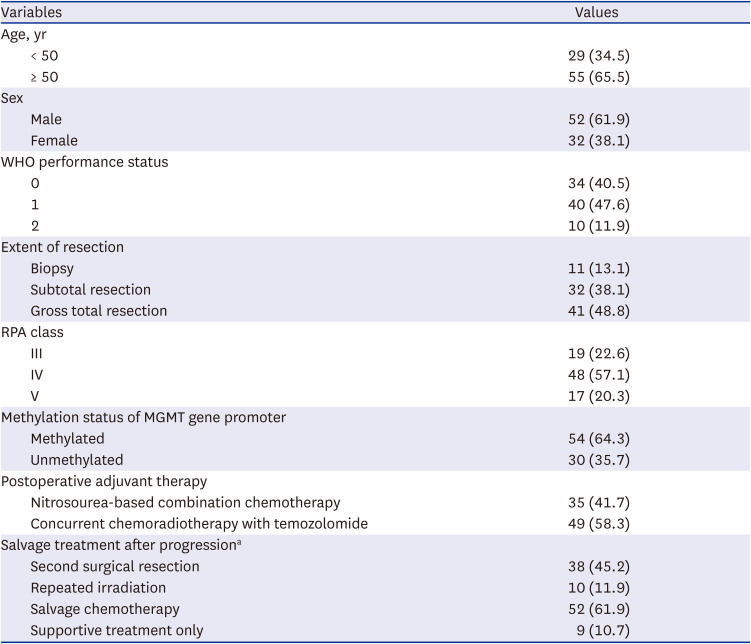
For the postoperative adjuvant treatment, 35 patients (41.7%) underwent nitrosourea-based combination chemotherapy with or without radiotherapy, while 49 (58.3%) underwent concurrent chemoradiotherapy with temozolomide. After tumor progression, 38 patients (45.2%) underwent a second resection, 10 (11.9%) were treated with repeated irradiation, 52 (61.9%) received salvage chemotherapy or target therapy using bevacizumab, and 9 (10.7%) received supportive care only (Table 1).
Results of immunohistochemical staining
All markers, including the T cell stimulatory factors (CD27, CD28, CD137, and CD134 [OX40], and ICOS), T cell inhibitory factors (CTLA4, PD1, PD-L1, TIM3, and CD200R), histone H3 lysine methyl-transferases (MLL4, RIZ, EZH1, and NSD2), and histone H3 lysine demethylases (KDM5c, JMJD1a, UTX, and JMJD3) were examined by immunohistochemical staining (Fig. 1, Supplementary Fig. 1 and Table 2), and categorized based on their expression levels. The cutoff value was determined using the ROC curve analysis (Supplementary Table 3).
Fig. 1
The examples of the immunohistochemical staining. (A) T cell co-stimulatory factors and co-inhibitory factors. (B) Histone H3 lysine modification enzymes.
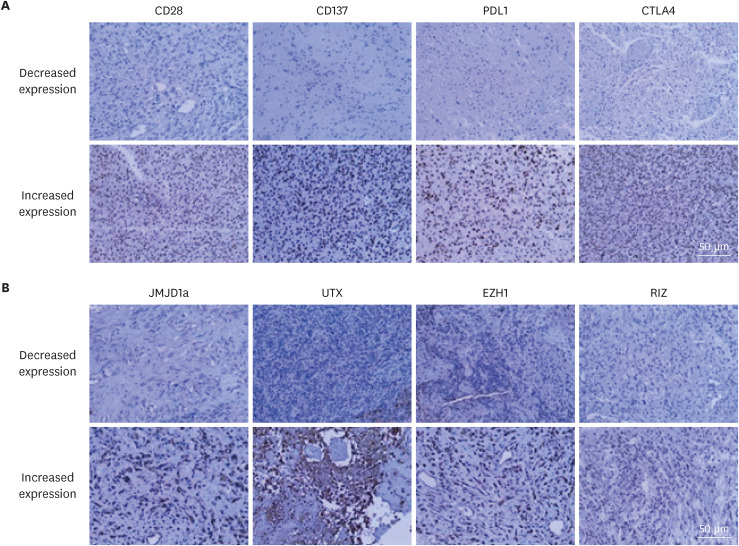
Table 2
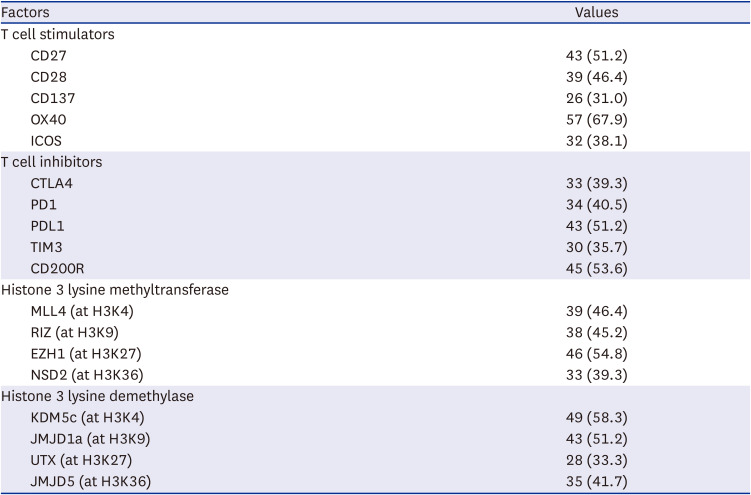
Result of increased expression of T cell regulatory factors and histone modifying enzymes in the immunohistochemical analysis of glioblastomas (N = 84)
Relationship between T cell co-stimulatory/co-inhibitory factors and H3 histone lysine modification enzyme
In the R2 linear regression analysis of 80 matching pairs between 10 T cell co-stimulatory/co-inhibitory factors and 8 histone lysine modification enzymes, several relationship with statistical significance was found (Supplementary Table 4). Increased CD28 expression (cutoff value, 10%) was observed in 39 samples (46.4%); among them, 36 (92.3%) presented with increased levels of JMJD1a (cutoff value, 21%). A significantly positive correlation was observed between the expression levels of CD28 and JMJD1a (R2 linear = 0.982, P = 0.041; Fig. 2A). This result suggests that JMJD1a (an H3K9 demethylase) might epigenetically induce CD28 expression. In addition, 26 samples (31.0%) demonstrated increased expression of CD137 in the immunohistochemical analysis (cutoff value, 45%), out of which 25 (96.2%) showed increased expression levels of UTX (cutoff value, 35%). A significantly positive correlation was observed between the CD137 and UTX expression levels (R2 linear = 1.528, P = 0.026; Fig. 2B). This result suggests that UTX, as an H3K27 demethylase, might epigenetically induce CD137 expression.
Fig. 2
Relationships between the T cell co-stimulatory/co-inhibitory factors and H3 histone lysine modification enzymes. (A) Significantly positive correlations were observed between the expression levels of CD28 and JMJD1a. (B) Similarly, a significant correlation was observed between the expression levels of CD137 and UTX. (C) The expression level of CTLA4 was negatively correlated with that of RIZ. (D) Likewise, a significantly negative correlation was observed between the expression levels of PD-L1 and EZH1.
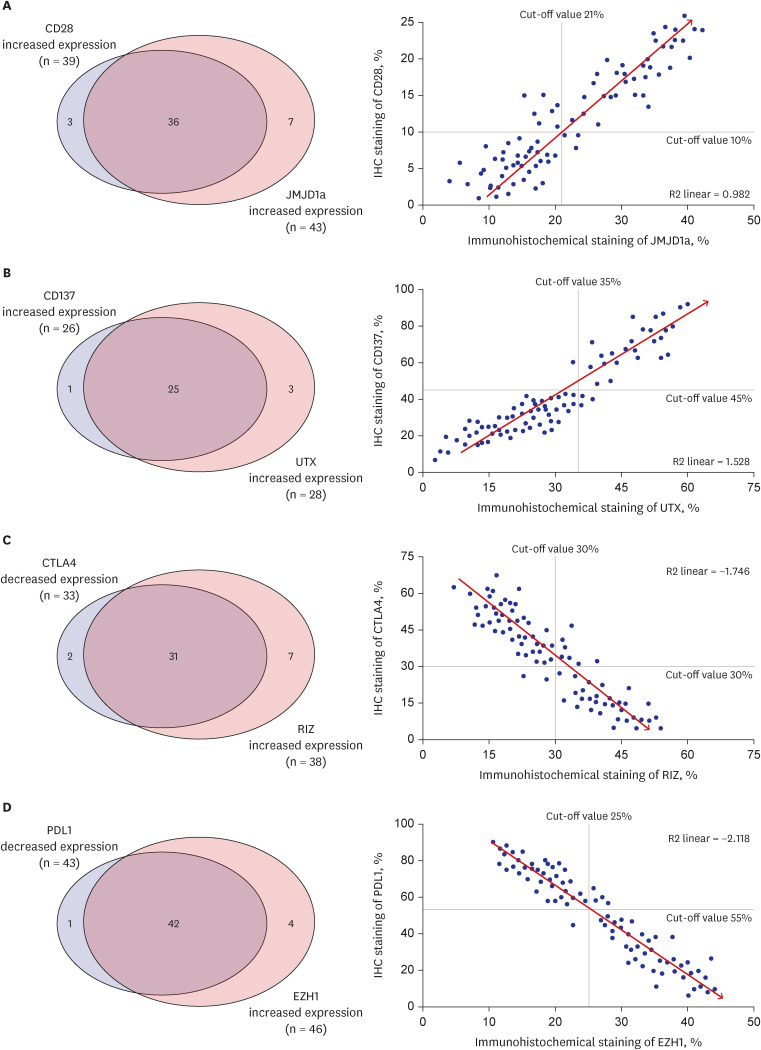
In contrast, 33 samples (39.3%) showed decreased CTLA4 levels (cutoff value, 30%), out of which 31 (93.9%) presented with increased levels of RIZ (cutoff value, 30%). A significantly negative correlation was observed between the expression levels of these two markers (R2 linear = −1.746, P = 0.017; Fig. 2C), thus suggesting that EZH1 might epigenetically suppress the expression of PD-L1. Similarly, decreased PD-L1 levels were detect-ed in 43 (51.2%) samples (cutoff value, 55%), and 42 (97.7%) samples presented with increased expression levels of EZH1 (cutoff value, 25%). A significantly negative correlation was observed between the expression levels of PD-L1 and EZH1 (R2 linear = −2.118, P = 0.009; Fig. 2D), suggesting that EZH1 might epigenetically suppress the expression of PD-L1.
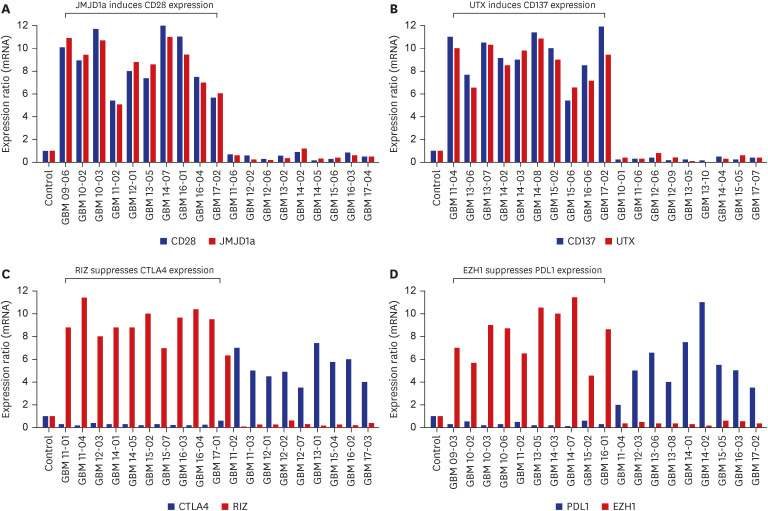
These relationships were confirmed using qRT-PCR. In samples with increased expression levels of CD28 and JMJD1a, the mean relative mRNA ratios were 7.6 (range, 5.4–12.0) for CD28 and 7.2 (range, 5.1–10.8) for JMJD1a (Fig. 3A). The corresponding values in the samples with increased CD137 and UTX levels were 8.2 (range, 5.8–12.0) and 8.5 (range, 5.5–11.5), respectively (Fig. 3B). In samples expressing both CTLA4 and RIZ, the mean relative ratio for the CTLA4 mRNA was 0.3 (range, 0.1–0.8), and that for RIZ mRNA was 8.4 (range, 4.5–11.3; Fig. 3C). The corresponding values in samples expressing PD-L1 and EZH1 were 0.4 (range, 0.1–0.9) and 7.9 (range, 4.8–11.3), respectively (Fig. 3D).
Survival outcome
The mean follow-up duration was 27.5 months (range, 4.1–43.5 months). During this period, 76 patients (90.5%) died, and the mean OS was 19.4 months (95% confidence interval [CI], 16.3–20.9 months). After the progression of the disease, 38 patients (45.2%) underwent second surgery, 10 (11.9%) underwent radiotherapy again, 52 (61.9%) were treated with salvage chemotherapy, and 9 (10.7%) received supportive care only.
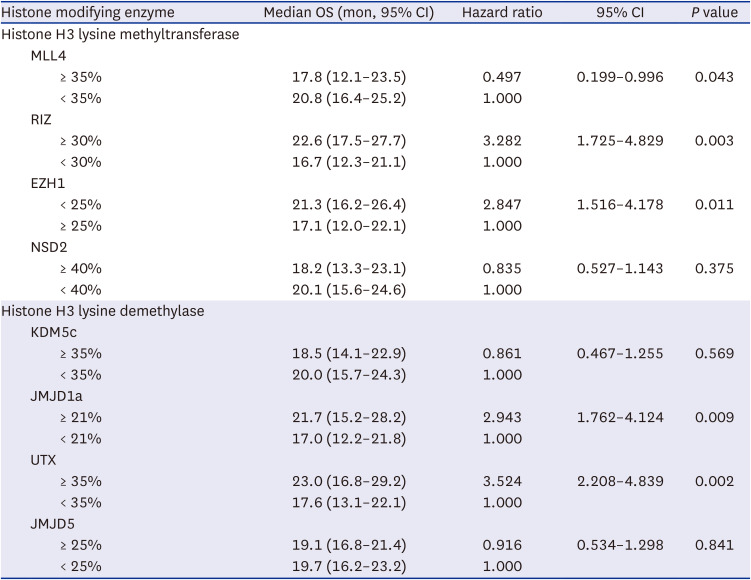
In the univariate analysis of factors predicting the OS based on the clinical factors, age < 50 years (95% CI, 1.876–4.236), WHO performance status 0 (95% CI, 1.951–4.353), gross total resection (95% CI, 1.991–4.451), RPA class III (95% CI, 1.374–3.842), and MGMT gene promoter methylation (95% CI, 1.986–6.218) were associated with a longer OS in the glioblastoma patients (Table 3). Increased expression levels of T cell co-stimulatory factors, such as CD 27 (95% CI, 1.905–3.734), CD 28 (95% CI, 1.173–2.817), and CD 137 (95% CI, 2.246–5.239), were significantly associated with longer OS (Table 4). On the contrary, increased expression levels of CTLA4 (95% CI, 0.184–0.477), PD1 (95% CI, 0.301–0.875), and PD-L1 (95% CI, 0.217–0.525) were found to be significantly associated with shorter OS in the glioblastoma patients (Table 4). Furthermore, decreased expression levels of MLL4 (95% CI, 0.199–0.996), and EZH1 (95% CI, 1.516–4.178), and increased expression levels of RIZ (95% CI, 1.725–4.829), JMJD1a (95% CI, 1.762–4.124), and UTX (95% CI, 2.208–4.839) were statistically associated with longer OS in glioblastoma patients (Table 5).
Table 3
Univariate analysis of factors predicting overall survival in glioblastoma patients using Cox regression model according to the clinical factors
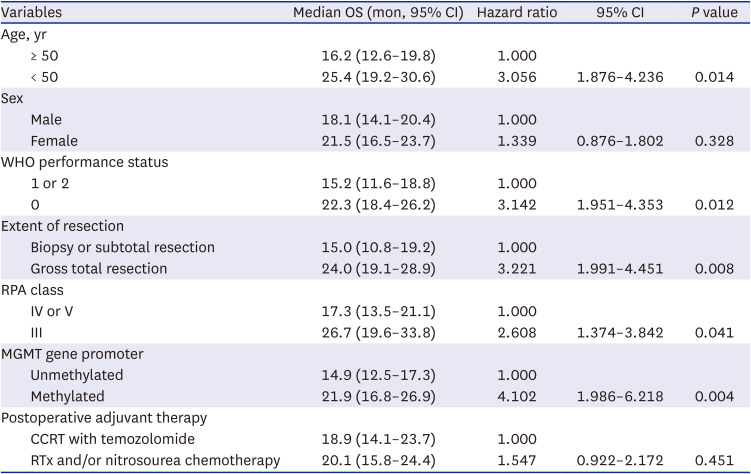
Table 4
Univariate analysis of factors predicting OS in glioblastoma patients using Cox regression model according to the expression of T cell regulatory factors
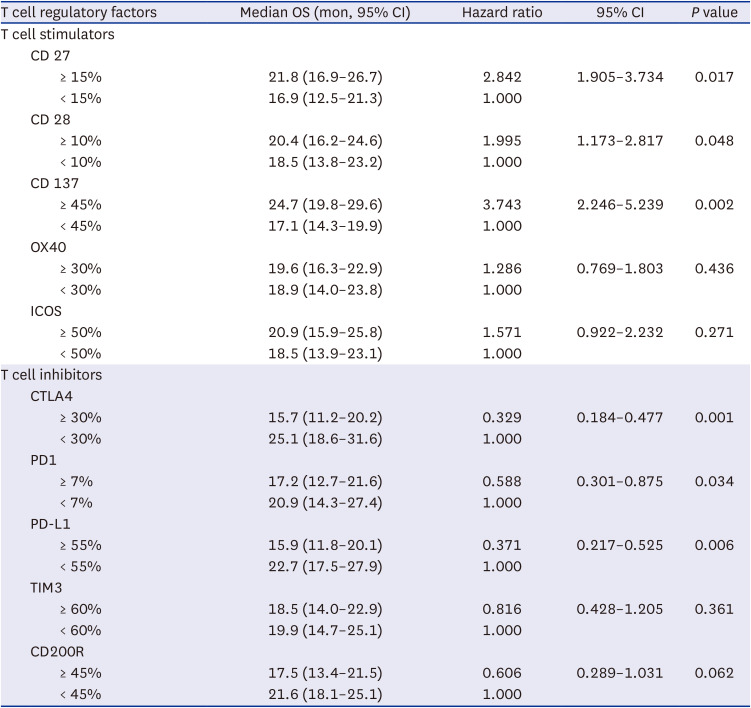
Table 5
Univariate analysis of factors predicting OS in glioblastoma patients using Cox regression model according to the expression of histone H3 lysine modifying enzymes
All the clinical factors, including age < 50 years (95% CI, 1.468–3.816), WHO performance status score 0 (95% CI, 1.439–4.187), gross total resection (95% CI, 1.836–4.306), RPA class III (95% CI, 2.003–3.985), and MGMT gene promoter methylation (95% CI, 1.189–2.561), which were significantly associated with longer OS in the univariate analysis, were independently associated with OS in the multivariate analysis. Additionally, increased expression levels of CD28 (95% CI, 1.233–2.754), and CD137 (95% CI, 2.118–4.434), and the decreased expression of CTLA4 (95% CI, 2.487–4.455), PD-L1 (95% CI, 1.764–3.794), and EZH1 (95% CI, 1.359–3.615) were found to be independently associated with OS (Table 6). However, several other factors, such as CD27, PD1, MLL4, RIZ, JMJD1a, and UTX, which were significantly associated with longer OS in the univariate analysis, were not associated with OS after multifactor adjustment (Table 6). The Kaplan-Meier survival curve analysis showed similar associations between the significant factors in the multivariate analysis and OS (Supplementary Fig. 2).
Table 6
Multivariate analysis of factors predicting OS in glioblastoma patients using Cox regression model
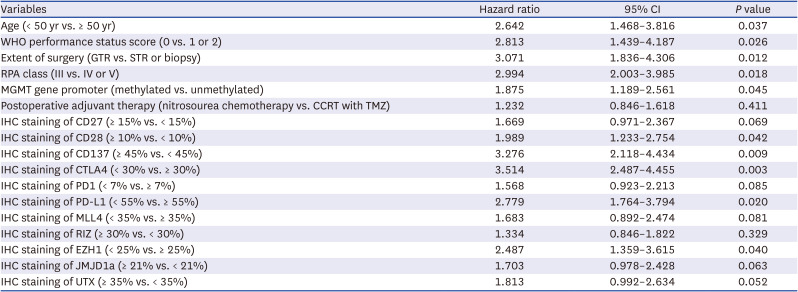
OS = overall survival, CI = confidence interval, WHO = World Health Organization, GTR = gross total resection, STR = subtotal resection, RPA = recursive partitioning analysis, MGMT = O6-methyl DNA guanine methyltransferase, CCRT = concurrent chemoradiotherapy, TMZ = temozolomide, IHC = immunohistochemical.
Case illustrations
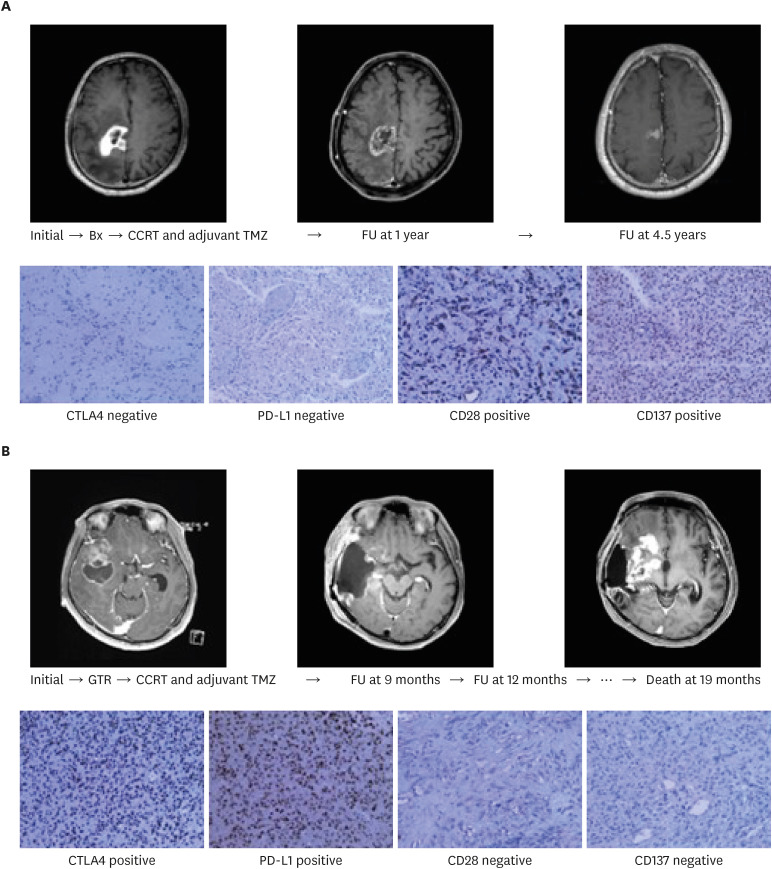
A 62-year-old man was diagnosed with glioblastoma following a stereotactic guided biopsy of the tumor in the primary motor cortex. He had grade 2 hemiparesis on the left side and presented with a Karnofsky Performance Scale of 50. An unmethylated MGMT promoter was identified in the glioblastoma. Despite these poor prognostic factors, the patient survived for over 4.5 years. Interestingly, the expression levels of the T cell co-stimulators (CD28 and CD137) were increased, and those of the T cell co-inhibitors (CTLA4 and PD-L1) were decreased (Fig. 4A). Conversely, a 45-year-old man was diagnosed with glioblastoma after a gross total resection of the tumor at the right temporal lobe. Although he suffered from intermittent focal seizures, he was able to perform the activities of daily living independently. A methylated MGMT promoter was identified in the glioblastoma. Despite these good prognostic factors, the patient did not survive beyond 19 months. The expression levels of CD28 and CD137 were decreased, and those of CTLA4 and PD-L1 were increased (Fig. 4B).
Fig. 4
Examples of patients with different outcomes based on the T cell activities, which are regulated by the T cell co-stimulators and co-inhibitors. (A) The expression levels of the T cell co-stimulators (CD28 and CD137) were increased, and those of the T cell co-inhibitors (CTLA4 and PD-L1) were decreased. (B) The expression levels of CD28 and CD137 were decreased, and those of CTLA4 and PD-L1 were increased.
CTLA4 = anti-cytotoxic T-lymphocyte-associated protein 4, PD-L1 = anti-programmed cell death ligand 1.
DISCUSSION
The primary aim of this study was to identify the specific T cell co-stimulatory and co-inhibitory factors that play a prognostic role in patients with glioblastoma. The expression levels of CD28, CD137, CTLA4, and PD-L1 were significantly associated with OS in the patients. Additionally, the expression levels of these factors were epigenetically related with JMJD1a (H3K9 demethylase), UTX (H3K27 demethylase), RIZ (H3K9 methyltransferase), and EZH1 (H3K27 methyltransferase). To the best of our knowledge, this is the first study to suggest the epigenetic role of histone H3 lysine modification enzymes in the expression of specific T cell co-stimulatory and co-inhibitory factors, which could aid in predicting the prognosis of patients with glioblastoma. Although several reports have introduced specific epigenetic biomarkers of T cells in human gliomas, most of these biomarkers were confined to DNA methylation and microRNA.29303132 Wiencke et al.29 reported significant decreases in CD3+ T cells and Tregs in peripheral blood from glioblastoma patients; moreover, the copy numbers of demethylated CD3Z and FOXP3 were significantly reduced by about 2-fold in the patients. Nonetheless, only a few studies have focused on the role of histone H3 modification enzymes in regulating the T cell factors in glioblastomas.
Normally, when a T cell encounters an antigen-presenting cell, which expresses the appropriate antigen, a second interaction with a checkpoint molecule is required to either activate or suppress the T cell.333435 This second interaction plays an important role in modulating an immune response. During the second interaction between the T cell and the cancer cell, some antibodies designed to interrupt or activate these co-stimulatory and co-inhibitory molecules act as checkpoint inhibitors. Intense investigations are underway to utilize these checkpoint inhibitors for the treatment of solid tumors, including glioblastoma. Among the several co-stimulatory and co-inhibitory molecules, CTLA4 and PD1 have been comprehensively investigated for their antitumor immune responses in murine models of solid cancer, such as melanoma and glioblastoma. Several large clinical trials in humans verified the observed efficacy of checkpoint inhibitors in preclinical models.3637 Furthermore, several large phase III clinical trials demonstrated the clinical benefits of anti-CTLA4 and anti-PD1 in patients with melanoma, renal cell carcinoma, and non-small cell lung cancer.373839 The results of these and other important studies led to the approval of the use of checkpoint inhibitors by the U.S. Food and Drug Administration. Similarly, promising preclinical data suggest that CTLA4 and PD1 inhibitors may promote antitumor immune responses in gliomas. Fecci et al.40 demonstrated improved survival mediated by T cell immune response in a murine glioma model treated with anti-CTLA4. Zeng et al.36 and others have shown that anti-PD1 monotherapy improved the OS in a murine model of glioblastoma; interestingly, anti-PD-L1 alone did not result in much survival improvement.37 The additional use of CD8+ T cells appeared to be responsible for the antitumor immune response.3637 Despite these promising findings in gliomas, the application of these agents to glioblastomas has yielded disappointing outcomes in phase III clinical trials.910111213 This may be due to the marked genetic and antigenic heterogeneity of glioblastomas, the relatively low mutational burdens in the genetics of these tumors, and the paucity of glioblastoma-infiltrating T cells.
As mentioned above, the ligation of PD1 is well-known to delimit immunogenic response. However, the significance of T cell expression of PD-L1 is less certain than PD1. As the PD-L1/PD1 axis has become a central target of immunotherapeutic approaches in the clinic,41 PD-L1 is shown to be robustly upregulated on tumor cells as well as intra-tumoral macrophages.42 Although PD-L1 is known as co-inhibitory factor which is predominantly located on cancer cell, recent study by Diskin et al.43 revealed the role of PD-L1 on TILs in cancer; PD-L1 is upregulated in response to antigen-presentation and as a consequence of sterile inflammatory clue, PD-L1 ligation in TILs induces intracellular signaling that is equally suppressive to that of PD1, and PD-L1+ TILs also promote STAT6-dependent M2-like macrophage differentiation and suppress neighboring effector T cells via the canonical PD-L1/PD1 axis. In the presenting study, PD-L1 is shown to be associated with the prognosis of glioblastoma rather than PD1. It is supposed to be responsible for PD-L1 to influence on both TILs and cancer cells. In the PD-L1/PD1 axis, PD1 as a key mediator of T cell exhaustion by cancer is much studied in terms of action mechanism and roles in cancer. By contrast, it is true that PD-L1 has lack of studies focused on the function and mechanism of regulating expression. Recent studies reported that transcriptional, post-transcriptional and translational mechanisms should contribute to PD-L1 overexpression in cancers, and these mechanisms are regulated by diverse oncogenic signaling and stress response pathways.44 In addition, PD-L1 expression and/or activity is regulated through several post-translational modifications, including phosphorylation, glycosylation, acetylation, ubiquitination and palmitoylation, which serve as signals for lysosomal or proteasome-mediated degradation of PD-L1.44 The expression of PD-L1 is regulated by genetic contributions, such as amplifications involving the chromosome 9p24.1 region containing CD274 and JAK2 can result in increased expression of these genes in classical Hodgkin lymphomas (36–38%), mediastinal large B cell lymphomas (29–63%) and small-cell lung cancers (~1.9%).454647 In terms of epigenetic regulations, histone methylation and acetylation in the CD274 promoter region participate in the transcriptional regulation of PD-L1 expression. Increased histone H3 lysine 4 trimethylation (H3K4me3) at the CD274 promoter by the histone methyltransferase MLL1 substantially upregulates the transcription of PD-L1 mRNA.48 Conversely, the histone methyltransferase EZH1/2, the catalytic subunit of polycomb repressive complex 2, suppresses PD-L1 expression through histone H3 lysine 27 trimethylation (H3K27me3) of the CD274 and IRF1 promoters in HCC cells.49 This report was identical to our presenting study showing reverse relationship of the expression between EZH1 and PD-L1 in glioblastoma. However, global hypomethylation of DNA is positively correlated with PD-L1 expression and T cell exhaustion in patients with certain cancer, such as melanoma.50 Moreover, DNA hypermethylation at the CD274 promoter region inhibits PD-L1 expression.51 Decitabine and azacytidine, hypomethylating agents, dose-dependently increase the level of PD-L1 mRNA in certain mouse models of non-small cell lung cancer, colorectal cancer and leukemia.52 Thus, inhibitors of epigenetic regulators can suppress cancer progression but simultaneously increase PD-L1 expression and could, therefore, potentially be combined with anti-PD-1/PD-L1 antibodies to improve their therapeutic efficacy.
Another approach involving the activation of the immunological functions of T cells themselves, instead of inhibiting the immune checkpoints, was attempted. Glioblastoma patients with extensive infiltration of CD8+ T cells are reported to survive longer than those with focal or rare infiltrations of these cells.535455 In clinical practice, it is not unusual for neuro-oncologists to encounter glioblastoma patients with good prognostic factors, who do not survive longer than those with poor prognostic factors. However, the difference may be attributed to the function of T cells in glioblastomas (Fig. 4).
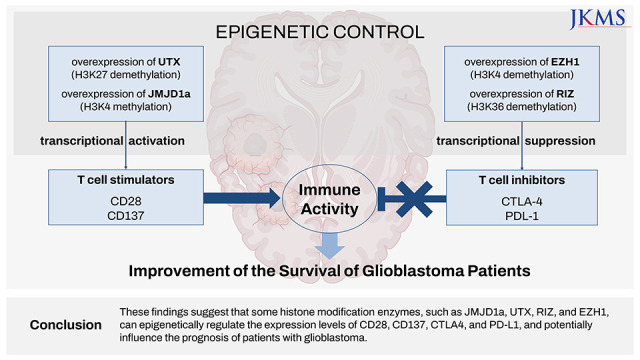
Epigenetic regulation of the expression of T cell co-stimulators and co-inhibitors may prove beneficial for the development of therapeutic targets of drugs in cancer. The findings of the present study indicated the epigenetic promotion of T cell activities by increasing the expression levels of T cell co-stimulators (such as CD28 and CD137, which were induced by JMJD1a and UTX, respectively) and decreasing the expression levels of T cell co-inhibitors (such as CTLA4 and PD1, which were suppressed by RIZ and EZH1, respectively). No direct associations were observed between the histone H3 lysine modification enzymes and the OS of patients in the multivariate analysis, except for EZH1, indicating that these enzymes were related with the expression levels of the T cell co-stimulatory and co-inhibitory factors.
Among the histone H3 lysine modification enzymes, only EZH1 played an independent role in the prognosis of glioblastoma patients after multifactor adjustment. EZH1/2 is the catalytic component of the polycomb repressive complex 2, which methylates histone H3 lysine 27, resulting in a mark that specifies a transcriptionally repressive chromatin environment. EZH1/2 aberrations have been observed in a wide range of oncogenic processes, including cancer cell proliferation, cell cycle regulation, disruption of immunologic defenses, chromosomal gain or loss, and activation of apoptotic pathways.565758 EZH1/2 aberrations were first described in several malignancies, including prostate cancer, breast cancer, bladder cancer, gastric cancer, lung cancer, hepatocellular carcinoma, renal cell carcinoma, and melanoma.5960 Although alterations in the expression levels of EZH1/2 have been directly correlated with a more aggressive clinical course and increased rates of metastasis in prostate, renal cell, and breast cancers,59 only a few comprehensive studies on glioblastoma are available in the English literature; EZH1/2 aberrations are thought to be involved in multiple processes, such as cell cycle, invasion, stem cell maintenance, and drug and radiotherapy resistance.616263 However, the interactions between EZH1/2 and T cell co-inhibitory factors in glioblastoma have not been reported so far. Uniquely, the present study is the first to suggest that EZH1/2 alterations can epigenetically influence the activities of T cells by suppressing the expression of T cell co-inhibitory factors in glioblastoma. Despite EZH1/2 aberrations are related with poor prognosis in several cancers as mentioned above, it is also known to suppress the PD-L1 expression. With suppression of PD-L1 expression, the function of TILs in cancer cell can be promoted to improve the clinical course of patients. Therefore, this diverse effect of EZH1/2 must be studied in multi-directional strategies on cancer biology.
Nonetheless, this study has several limitations. First, the analyses were performed using simple techniques such as immunohistochemistry and qRT-PCR, rather than more advanced genetic and molecular methods, such as RNA sequencing (for the identification of specific target genes) and chromatin immunoprecipitation sequencing (to determine the concrete role of the histone H3 lysine modification enzyme). Although associations between several T cell co-stimulatory and co-inhibitory factors and the clinical outcome were identified in this study, the specific immunological role in cancer biology, rather than a certain causal relationship, was not presented. Thus, a more comprehensive study is required, owing to the heterogeneity of the cancer genome and epigenomes in glioblastoma. When the epigenetic mechanism is disrupted, either independently or as a result of genetic mutations, tumor cells can start to evolve based on the selection of favorable epigenetic states. This can lead to the production of tumor subclones that are genetically identical; however, in reality, they express different combinations or altered levels of genes. In addition to producing more aggressive characteristics, increased tumor heterogeneity decreases the likelihood that a specific treatment will be able to eliminate every subclone, which can lead to chemoresistance and relapse.64 Therefore, more extensive scientific evidence, supported by molecular genetic analysis using in vivo and in vitro studies, is mandatory to validate the results of the present study.
Second, the presenting study could not differentiate the cells which expression of co-stimulatory and co-inhibitory factors in tumor tissue. In fact, all the co-stimulatory and co-inhibitory factors which we studied are located not in the glioblastoma cells but in the TILs except only one factor such as PD-L1.1617 However, the problem is that we cannot investigate the individual TIL at the level of singe cell which is isolated from patient’s glioblastoma tissue. The tumor tissue which was obtained from patient during surgical resection contained lots of cells not only glioblastoma cells but also cells contributing microenvironment including TILs. When making a FFPE, it is natural for the block of tissue to include many kinds of different cells. We performed the IHC staining of CD8 in order to investigate the infiltration of T cell into glioblastoma tissue. Interestingly, whole 84 tumor tissues had a strong expression of CD8. As a result, we found out that lots of TILs were intermingled into the tumor tissue. It suggested that the co-stimulatory and co-inhibitory factors of the TILs which were intermingled in tumor tissue should be detected by IHC staining. As a results, it is considered that the co-stimulatory and co-inhibitory factors not of glioblastoma cells but of TILs in tumor tissue should be expressed meaningfully. In terms of PD-L1, it is known as co-inhibitory factor which is predominantly located on cancer cell, but recent study suggested the function of PD-L1 on TILs in cancer as well. It was impossible for us to distinguish the expression of PD-L1 between TILs and glioblastoma cell without analysis at the level of single cell. However, it is essential to examine the phenomenon at the single cell levels comprehensively in order to validate the presenting results.
Third, the present study did not examine all the histone modification enzymes. Although several histone modification enzymes at H3K4, H3K27, and H3K36 were included in the analysis, other enzymes at H3K9, H3K79, and H4K20 are also known to play a role in the cancer biology of certain diseases.65 Only those enzymes that could be purchased commercially were used in the current study. Although JARID1A, UTX, RIZ, and EZH1 play specific roles in regulating the expression of T cell stimulatory/inhibitory factors in glioblastoma, other specific enzymes may be involved in the immuno-oncogenesis of T cells in glioblastomas. Furthermore, our study did not examine all the T cell stimulatory/inhibitory factors; other factors such as CD80, CD86, CD113, and CD155 may be involved in interactions between T cells and glioblastoma cells.16 Therefore, our results do not reflect all the possible mechanisms of the epigenetic regulation of T cell activities in glioblastoma. Additional studies using sequencing analysis are required to determine the target genes in more samples and validate the results in vivo and in vitro.
Fourth, although we tried to reduce the inborn limitation of IHC analysis, for example two different neuropathologists assessed the immunoreactivity in the samples, it is not certain whether the assessments in this study were correct because the interpretation of the results obtained by IHC staining may be subjective. The optimal evaluation of IHC staining can differ according to the concentration of the antigen, owing to difficulties in establishing standard conditions in the laboratory. In addition, there is no standard rule for determining the cutoff values between the positive and negative findings. Therefore, it is necessary to establish a reasonable cutoff value to repeat the experiments for validation and to discuss the details regarding the interpretations of the data among the investigators. In this study, the ROC curve analysis was used to establish the cutoff values in a principled manner and overcome the flaws associated with IHC staining. To overcome these inborn limitations of IHC study, an in vitro study might prove helpful in determining the immunoreactivity for T cell co-stimulatory and co-inhibitory factors and the histone H3 lysine modification enzymes at the cell level. Recently, a deep-learning–based method using artificial intelligence that can automatically localize and quantify the regions expressing biomarkers in any selected area within the whole slide has been proposed to reduce the risk of incorrect interpretation of immunohistochemical analysis.66
Fifth, our study did not include the recently updated research on the immuno-oncology of glioblastomas. In terms of stem cell research, interactions between glioma and immune cells can promote the stemness of the glioma.67 Other potential mechanisms of tumor-induced T cell dysfunction in cancer include chronic activation of the T cell co-stimulatory receptor or co-inhibitory receptor (which can originate due to competition with co-stimulatory receptors for binding to their ligands in order to impede the formation of microclusters), negative signaling to disrupt T cell activation, and the upregulation of inhibitory genes.67 Soluble mediators, such as IL 10, adenosine, indoleamine 2,3-dioxygenase, VEGF-A, and type 1 interferon, can be used advanced field to immuno-oncology research.68 Glucose deprivation impedes the function of CD8+ TIL effectors by limiting aerobic glycolysis and decreasing mTOR activity and interferon-γ production. Immune checkpoint blockades with anti-CTLA4 or anti-PD1 monoclonal antibodies augmented the glycolytic capacities and effector functions of TILs in experimental models.68 The current study focused on the role of histone modification enzymes in regulating the T cell activities in glioblastoma; additional updated experiments are warranted to validate our results.
Finally, the bias originating from the retrospective design may be considered as another limitation of this study, which can be overcome by increasing the number of patients. However, the current study involved a small sample size and may not meet the complete assumptions of the statistical tests used. Attempts were made to reduce the bias by obtaining the clinical data from computerized data archives using a uniform system and including patients treated with the same protocol in a single center. The several investigators involved in this study did not have any prior information about the clinical background or experimental results to help avoid any preconceptions. The pathological findings and radiological features were independently reviewed, but there was no clear bias due to the retrospective nature of the analysis. Despite these efforts, the conclusions drawn from this study merit further validation through prospective and randomized clinical trials in the future.
Conclusively, the epigenetic relationship between of the expression of T cell co-stimulatory/co-inhibitory factors and histone H3 lysine modification enzyme, and their prognostic roles were translationally investigated in 84 human glioblastoma samples. JMJD1a (H3K9 demethylase), UTX (H3K27 demethylase), RIZ (H3K9 methyltransferase), and EZH1 (H3K27 methyltransferase) were associated with the post-transcriptional expression of CD28, CD137, CTLA4, and PD-L1, respectively. Thus, increased CD28 and CD137 and decreased CTLA4 and PD-L1 levels are likely associated with longer survival in patients with glioblastoma. The application of these findings to research and clinical trials might facilitate the development of new treatment methods.
 XML Download