

 PDF
PDF Citation
 Print
Print


INTRODUCTION
According to World Health Organization (WHO), between 2015 and 2050 the world's population aged 60 and older will nearly double in proportion from 12% to 22%.1 The dramatic changes in world population characteristics also led United Nations (UN) to establish the Decade of Healthy Aging: Plan of Action from 2020–2030 to improve the quality of life for older adults, their families, and communities.2 However, having well-equipped health and social systems to take advantage of this demographic shift is a major challenge globally.
In South Korea, it is no exception. According to the 2021 Statistics on the Aged by Statistics Korea, Korea is one of the nations with the most rapidly aging populations in the world with a 15.7% representation of the total population in 2020.3 The average life expectancy of older adults (65 years and older) in Korea in 2018 was 82.7 years, which is higher than the average for OECD (80.7 years).3 Korea’s aging population has raised several concerns, including individual and societal burdens related to rising healthcare costs as chronic diseases continue to increase inevitably.4
According to the 2020 Health Insurance Statistical Yearbook published by the National Health Insurance Corporation and the Health Insurance Review and Assessment Service, the number of older adult beneficiaries aged 65 and over accounted for 15.4% of the total number of beneficiaries in 2019.5 With an aging population, the proportion of people over 65 years of age steadily increased from 12.7% in 2016 to 14.5% in 2019 to 15.4% in 2020. An increasing older adult population eventually leads to a rise in older adult care costs. In 2020, the cost of medical treatment for older adults increased by about 1.5 times from 2016. Among the total medical expenses in 2020, 43.4% were incurred by older adults. Over the past few years, medical expenses have steadily increased among people over 65 years of age as well.
As individuals, families, and society, it is crucial to remain healthy to reduce healthcare costs. The prevention of physical frailty is an important step for older adults to stay healthy.6 Frailty is the age-related decline in bodily functions, that can weaken the body's ability to cope with external stresses and increase the likelihood of a person's risk of disability and hospitalization.67 Major clinical symptoms of frailty include reduced physical activity, decreased muscle mass, decreased energy, and a decline in gait speed. As these factors deteriorate, frailty progresses and worsens; the transition from normal aging to pre-frailty to frailty and its complications are described as a dynamic process. Therefore, it is crucial to prevent this vicious cycle by reducing risk factors before frailty is reached and actively changing behavior before frailty occurs.89
According to previous studies, healthcare costs are positively linked with frailty status; the cost of healthcare increased with the deterioration of the health status of frail among older adults. In previous studies, 2 streams of cost analysis were reported: one targeting frailty and surgery among older adults,1011 and another targeting community-dwelling ambulatory older adults by using a cross-sectional approach.121314 Several longitudinal studies have been conducted, and the cost analysis was determined: 1) based on self-reported data15; 2), particularly among women16; 3) only considering healthcare utilization or only costs17181920; or 4) for relatively short period-1 year.21 None of the studies have comprehensively investigated the impact of the transition of physical frailty longitudinally on healthcare cost and utilization (inpatient and outpatient days and frequency), using cohort data focusing on the physical frailty of community-dwelling older adults in Korea.
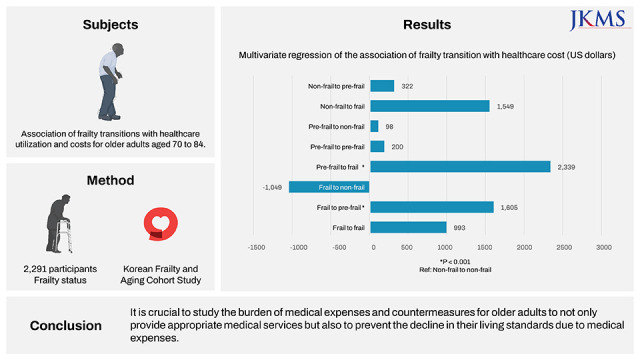
The purpose of this study is to investigate healthcare utilization and costs according to physical frailty transition. In this study, we aim to demonstrate the differences in the aspects of healthcare utilization and the cost of physical frailty based on deterioration (from robust to pre-frail, from robust to frail, from pre-frail to frail), no change (from robust to robust, from pre-frail to pre-frail, from frail to frail), and improvement (from pre-frail to robust, from frail to pre-frail, from frail to robust). The findings of this study are expected to have implications for policymakers to develop policies aimed at preventing frailty and managing it on a timely basis to reduce healthcare utilization, costs, and the burden of diseases.
METHODS
Sample and design
The Korean Frailty and Aging Cohort Study (KFACS) was a longitudinal cohort study that enrolled community residents aged 70 to 84 years between 2016 and 2017.22 A total of 3,014 participants were assessed for frailty status at baseline and they received followed up after 2 years in 2018–2019. In this study, we linked the frailty status data of the study population to the National Health Insurance Database (NHID). The NHID is provided by National Health Insurance Service, which is compulsory health insurance involving the entire Korean population.23 The dataset contained information on visits to the hospital and medical expenditures related to medical institutions. During the data linkage process, 723 participants who had unmatching or missing information on frailty measures were excluded. Our analysis sample consisted of 2,291 older adults and was categorized into 9 frailty status transition groups such as 1 (from robust to robust), 2 (from robust to pre-frail), 3 (from robust to frail), 4 (from pre-frail to robust), 5 (from pre-frail to pre-frail), 6 (from pre-frail to frail), 7 (from frail to robust), 8 (from frail to pre-frail), and 9 (from frail to frail). The KFACS obtained written informed consent from each participant for the data linkage study design.
Fried Frailty phenotype
Frailty status was assessed at baseline in 2016–2017 and followed up in 2018–2019 using a modified version of the Fried Frailty phenotype,6 used often in numerous studies. The 5 criteria of the Fried Frailty phenotype are weight loss, weakness, exhaustion, slowness, and low physical activity. Weight loss is defined as the unintentional weight loss of more than 4.5 kg compared to the previous year. Individuals are defined to have a weakness if they are in the lowest 20th percentile of grip strength measured with the hand grip dynamometer in each of the body mass index (BMI) groups for men and women. Men with BMI < 22.0, 22.0–23.9, 24.0–25.9, and ≥ 26.0 were determined to have a weakness if the grip strength was ≤ 25.4 kg, ≤ 27.1 kg, ≤ 27.8 kg, and ≤ 28.5 kg, respectively. Women with BMI < 23.0, 23.0–24.9, 25.0–26.9, and ≥ 27.0 were determined to have a weakness if the grip strength was ≤ 16.8 kg, ≤ 17.6 kg, ≤ 17.8 kg, and ≤ 17.7 kg, respectively. In case of exhaustion, respondents self-reported their conditions whether everything was an effort or that one could not get going for 3 or more days per week. Slowness was defined as the slowest 20% of gait speed, the walking speed over 4 meters, stratified by sex and height. In men, those with gait speed ≤ 0.93 m/sec for height ≤ 165.0 cm and ≤ 0.98 m/sec for height > 165.0 cm were categorized as slow. In women, gait speeds ≤ 0.85 m/sec for those with height ≤ 152.0 cm and ≤ 0.93 m/sec for those with height > 152.0 cm were categorized as slow. Low physical activity was measured in energy expenditure estimates (kcal/week) of < 494.65 kcal for men and < 283.50 kcal for women. This was calculated based on the International Physical Activity Questionnaire and metabolic equivalent scores derived from vigorous, moderate, and mild activities in the questionnaire. Finally, study participants were classified as robust, pre-frail, and frail if they had 0, 1–2, and 3–5 frailty criteria.
Healthcare utilization and costs
Healthcare utilization and its costs were calculated based on the claim data from NHID. Healthcare resource utilization included inpatient days, inpatient frequency, and outpatient days per person. Healthcare costs included all costs spent on the medical services performed during hospitalization or outpatient visits and those related to inpatient and outpatient care. The baseline of healthcare utilization and costs were referred from the 2016 data and its follow-up data from 2019. Since the study enrolled participants and measured their baseline frailty until 2017 with the last follow-up completed in 2019, we used 2019 claim data as a follow-up. The interval between baseline and follow-up of healthcare utilization and costs was three years. All costs were expressed in 2019 United States dollars ($1 = 1,166.11 KRW).
Statistical analysis
Participant characteristics of the nine frailty transition groups were expressed as the mean± standard deviation for continuous variables and as frequency (percentage) for categorical variables. For the groups, analysis of variance (ANOVA) was used for continuous variables and χ2 tests for categorical variables. Fisher’s exact tests were used to compare insurance types among the groups due to the reduced sample of available data. Repeated-measures analysis of variance (repeated-ANOVA) was used to determine the difference in the means for healthcare use and costs were estimated between the baseline and follow-up period. Multivariate regression was conducted to determine whether the mean of healthcare use and the cost were significantly associated with the frailty change group while adjusting for baseline, gender, age, and insurance type. All statistical analyses were performed using SAS (ver. 9.4; SAS Inc., Cary, NC, USA) and a two-tailed P < 0.05 was considered statistically significant.
Ethics statement
This study was approved with waived informed consent by the Institutional Review Board (IRB) of the National Evidence-Based Healthcare Collaborating Agency (IRB No. NECA IRB 21-020-8). In this study, we used the National Health Information Database (NHIS-2021-1-199) of the National Health Insurance Service (NHIS-2021-1-199).
RESULTS
Sample characteristics
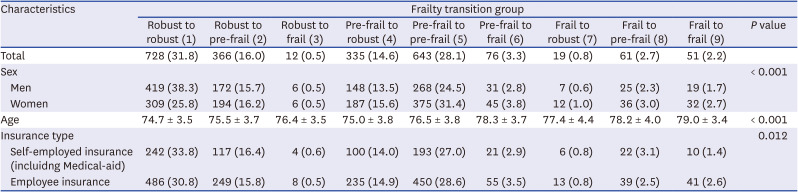
Table 1 shows the demographic and socioeconomic characteristics of the study sample according to the frailty transition groups. In the final study sample, the largest number of male participants were from the frailty transition Group 1 (from robust to robust), while most women were from Group 5 (from pre-frail to pre-frail). In terms of age, participants of groups 6 to 8, who were frail in the baseline wave were older in general, compared to individuals with a lower frailty status at the baseline. The highest number of individuals with self-employed or employee insurance was in Group 1 (from robust to robust).
Table 1
Characteristics of the study sample by frailty transition
Frailty transitions
Overall, the largest number of participants were in frailty transition Group 1, who were robust in the baseline wave and stayed robust in the follow-up wave (Table 1). Following Group 1, participants from pre-frail to pre-frail and from pre-frail to robust constituted the second and the third highest numbers in our sample group, indicating a high number of individuals with no changes or improvement in their frailty status.
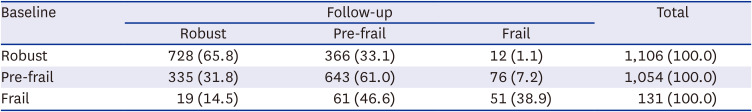
In Table 2, the transition in frailty status from the baseline to the follow-up survey waves is shown as a matrix. At the baseline, there were 1,106 robust, 1,054 pre-frail, and 131 frail participants. Most of the robust and the pre-frail groups did not show any change in their frailty status in the follow-up waves, consisting of 65.8% and 61.0%, respectively. Conversely, the largest number of participants who were frail at the baseline survey wave had pre-frail status in the follow-up (46.6%). Summarizing these findings, most participants had no change in their frailty status (62.1%), followed by those showing deterioration (19.8%), and improvement (18.1%).
Frailty transition and healthcare utilization
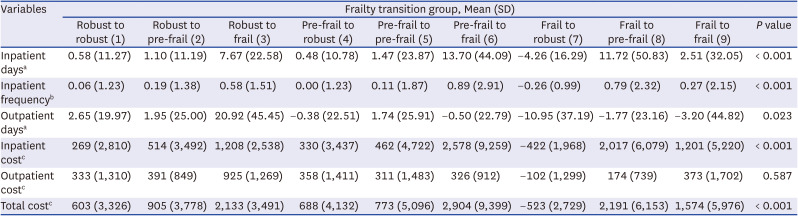
Changes in the selected indicators of healthcare utilization including the use of service and the cost are given in Table 3 by frailty transition groups. All the estimated changes in healthcare utilization indicators were significantly different across 9 frailty transition groups, except for the outpatient cost. Inpatient days and frequency increased the most in Group 6 (from pre-frail to frail) with 13.70 days per patient on average, followed by Group 8 (from frail to pre-frail) and Group 3 (from robust to frail). Group 7 (from frail to robust) was the only group that showed a decrease in inpatient use, with -4.26 days and -0.26 times on average by inpatient days and frequency, respectively. In terms of outpatient use, Group 3 (from robust to frail) participants showed the largest increase in both the number of days (20.92 days) and outpatient care. Conversely, frailty transition Group 7 (from frail to robust) had the largest decrease in outpatient uses with -10.95 days per patient. For the healthcare costs, transition Group 6 (from pre-frail to frail) showed the highest increase in both the inpatient and total expenditure, with $2,578 and $2,904, respectively. Similar to the changes in the other indicators, Group 7 showed the greatest improvement in healthcare expenditures, with -$422 and -$523 on average per individual, respectively.
Table 3
Healthcare utilization and cost by frailty transition
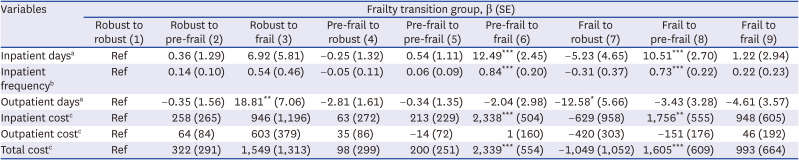
To determine the impact of frailty transitions on the changes in healthcare utilization and costs, we conducted a multivariate regression analysis (Table 4). According to the results, frailty transition from pre-frail to frail (Group 6) and from frail to pre-frail (Group 8) states were associated with inpatient uses in terms of both inpatient days (12.49 days and 10.51 days for Group 6 and Group 8, respectively) and frequency of visits (0.84 times and 0.73 times for Group 6 and Group 8, respectively). Findings on the outpatient uses showed opposing trends in groups 6 and 8, where the frailty transition was insignificantly associated with a decrease in service utilization. Group 3 (from robust to frail) transition was associated with an increase in the average outpatient days (18.81 days) per patient, while Group 7 (from frail to robust) transition was associated with a decrease in the outpatient service utilization (-12.58 outpatient days per patient). In terms of healthcare expenditure, frailty transitions from pre-frail to frail ($2,338), from frail to pre-frail ($1,756), and from frail to frail ($948) had an impact on increased inpatient costs. For the total medical expenditure, the frailty transition from pre-frail to frail and from frail to pre-frail led to an increase in costs, with a $2,339 and $1,605 increase, respectively. Group 7 transition (from frail to robust) was associated with a decreasing trend in all the inpatient, outpatient, and total healthcare costs, but the trend was statistically insignificant.
Table 4
Multivariate regression of the association of frailty transition with healthcare utilization and cost
DISCUSSION
This longitudinal study using KFACS data was conducted to examine the changes in frailty status and its correlation with changes in healthcare utilization and costs accordingly. Increases in inpatient days, inpatient frequency, inpatient costs, and total healthcare expenditures were associated with frailty onset and aggravation. For instance, a transition to frailty from “pre-frail” to “frail” (Group 6) resulted in a $2,339 increase in total healthcare cost, and from “frail” to “pre-frail” (Group 8), a $1,605 increase (Table 4). Particularly, changes from “pre-frail” to “frail” (Group 6) and “frail” to “pre-frail” (Group 8) were significantly associated with increased inpatient days, inpatient frequency, inpatient cost, and total healthcare cost after 2 years than “robust” to “robust” (Group 1).
In our study, the characteristics of the frailty transition group are provided in Table 1. The incidence of physical frailty was lower among men, accounting for the highest composition in Group 1 (robust to robust). For women, the highest composition was found in Group 5 (pre-frail to pre-frail). Age also increased according to the frailty transition; Group 9 (frail to frail) showed the oldest age, while Group 1 (robust to robust) displayed the youngest age. The study’s findings indicate that frailty is more common among older adults and women, which is consistent with other previous studies.62425 The no-change groups such as 1 (robust to robust) and 5 (pre-frail to pre-frail) had the highest proportions of employee and self-employment insurance, supporting the previous study's finding that employment status has a negative relationship with frailty.26
Furthermore, this study presents the matrix of physical frailty dynamics among community-dwelling older adults in Korea (Table 2). For most participants, the frailty status did not change (62.1%), followed by those who deteriorated (19.8%), and those who improved (18.1%). This result is explained by the fact that this study is based on ambulatory community-dwelling older adults and the study’s follow-up period was relatively short - 2 years. Based on the data from Hispanic Established Populations Epidemiologic Studies of the Elderly, over 10 years, approximately 39% remained frail over that period, 50% deteriorated, and another 11% improved.27
According to Table 3, inpatient days, frequency, and cost increased the most in Group 6 (from pre-frail to frail), with averages of 13.70 days, 0.89 times, and $2,578 per patient, respectively. The greatest decrease in inpatient days, frequency, and the cost was observed in Group 7 (frail to robust) with -4.26 days, -0.26 times, and -$422, respectively. In Table 4, the multivariate regression analysis showed that only Group 6 (from pre-frail to frail) and Group 8 (from frail to pre-frail) demonstrated statistical significance in inpatient days, frequency, and cost compared to Group 1 (robust to robust). Group 6 accounted for the highest increase of all groups. This is consistent with the findings from the inpatient cost analysis, which also found a significant association with inpatient costs in regression analysis even after controlling for comorbidity.20 According to a 1-year follow-up study conducted with older adults aged 65–95 years in England using the national data, Clinical Practice Research Datalink, increasing frailty was also associated with a substantial increase in hospital admissions.21 The findings from this study are consistent with those of the past literature in that there is a positive association between frailty status and hospitalization or institution.2829 While the magnitude of statistical significance of Group 6 (pre-frail to frail) was lower than that of Group 8 (frail to pre-frail), frail to pre-frail also showed statistical significance in inpatient days, inpatient frequency, inpatient cost, and total cost. There may have been an increase in visits to medical institutions because of improved accessibility. The dynamic nature of frailty changing over time may have been more evident if we had divided the sample into only robust to frail groups. However, our objective was to highlight the dynamic nature of 9 frailty status change over time.
Outpatient days and costs increased the most for Group 2 (robust to frail) participants and the least for Group 7 (frail to robust) participants, as shown in Table 3. In Table 4, Group 3 (from robust to frail) showed a significant increase in outpatient days, whereas Group 7 (from frail to robust) showed a significant decrease when compared to Group 1 (from robust to robust). The transition group did not show a statistically significant correlation with outpatient costs compared to Group 1. The results of this study support those of previous studies, showing frequent visits to outpatient clinics by frail patients in cross-sectional settings among older Europeans,30 and is also based on a self-reported 2 years follow-up study conducted in China.18 These findings are significant as they demonstrate the combined effects of change in frailty status and outpatient utilization and their implications on mortality after 9 years.17
Total healthcare expenditures in transition Group 6 (from pre-frail to frail) increased the most by $2,904. Even in the multivariate regression analysis in Table 4, the total healthcare cost was $2,339 when compared to Group 1 (from robust to robust). Based on self-reported data from Germany, wherein the study targets were older adults aged 57–84, the onset of pre-frail did not increase, while the total healthcare costs went up from “robust” to “frail,” particularly in the inpatient sector.15 The effect of frailty on out-of-pocket medical expenses was likewise substantial after controlling for sociodemographic variables, health behaviors, and comorbid conditions in Korea's longitudinal study, which used self-reported data.19 The cross-sectional studies conducted in Germany and Korea also showed that aggravation in frailty status had a strong relationship with increased healthcare costs.1213
Moreover, we found that improvements in Group 8 (from frail to pre-frail) increased significantly compared to Group 1. There was a similar previous study that the transition from pre-frail to frail and vice versa was associated with increased healthcare payments and it described the reason for the high costs for the improved group since additional care and treatment may can result in a less frail status. Therefore, there are more healthcare services leading in higher medical spending.31 While leading factors are not disclosed, the increased cost in the worsening or improving frailty directions should be interpreted with caution. To reveal the factors of increased cost, future research may focus on investigating the impact of each baseline and follow-up frailty status with a change in healthcare costs in longitudinal studies.
A substantial increase in the medical expenses in national health insurance means a corresponding increase in personal medical expenses. Increasing life expectancy prolongs the aging process, resulting in a higher number of older adults visiting medical institutions, thereby increasing the cost of personal medical care. However, the income of older adults is gradually decreasing due to aging-related difficulties. Therefore, it is crucial to study the burden of medical expenses and countermeasures for older adults to not only provide appropriate medical services for older adults but also to prevent the decline in their living standards because of the heavy burden of medical expenses, because individuals as well as families and the state, are all affected by it.
To the best of the author’s knowledge, this study is one of the first to examine the relationship between frailty transition and healthcare utilization along with the costs after two years, considering the national data. The data from the first frailty cohort study of community-dwelling older adults were used. Another strength of the study is that detailed data were collected on general characteristics of the frailty transition group, healthcare utilization (inpatient, outpatient days, and frequency) as well as healthcare costs, along with national data from NHID, in addition to the phenotype of frailty.
This study has certain limitations. First, the participants of this study were aged 70 to 84; therefore, the results of this study may not apply to the young population. Second, this study had a relatively short follow-up period of two years, and some of the groups contained a limited number of participants for the analysis due to restricted access to the national data of NHID. Lastly, The NHID data are included only for insured health benefit items.32 Our results which were not covered on non-insured health benefit items may lead to an underestimate. Because comprehensive healthcare costs consist of payment for covered services by the NHI and out-of-pocket payment for non-covered services, further studies investigating uninsured healthcare costs are needed to consider using the rate of out-of-pocket spending.33 Nevertheless, the importance of this study lies in identifying and calculating medical expenses according to changes in the physical status of community-dwelling older adults in Korea, linked with the national data of NHID, in the form of longitudinal data. The results helped us understand preventing and managing frailty would be considerable factors in healthcare priority setting and resource allocation.34 Particularly, there may be the importance of frailty transitions for healthcare policymakers and decision-makers considering different levels of healthcare resources for the aging population. Previously, studies that specifically measured excess medical costs due to frailty were scarce. This study is meaningful in that it was possible to find the benefits of preventing frailty in society by measuring the size of additional medical costs through connection with the data from the national health insurance data. These measurements can contribute to determining the cost-effectiveness of policies related to frailty in the future and deciding on implementation.
Over the next few decades, the number of frail older adults will likely increase significantly, as the population ages. The findings suggest that frailty among community-dwelling older adults is economically relevant; inpatient costs and frequency increasing with advancing frailty status may increase the economic burden and put a greater strain on medical resources and healthcare delivery systems. These results indicate that it is critical to identify and manage frailty among older South Koreans to reduce healthcare utilization and its costs.
 XML Download