

 PDF
PDF Citation
 Print
Print


INTRODUCTION
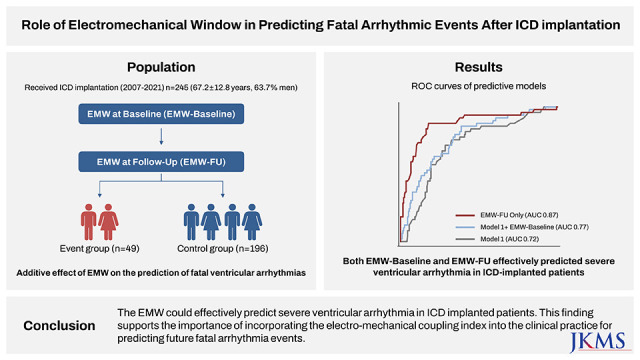
Predicting fatal ventricular arrhythmias is critical for preventing sudden cardiac death in patients at high risk.1 While the heart rate-corrected QT interval (QTc) has been a significant predictor of ventricular arrhythmias,23 heterogeneity of electromechanical coupling is emerging as a significant pro-arrhythmic factor increasing the likelihood of ventricular arrhythmias.4 The electromechanical window (EMW) is a measure of electromechanical coupling. It is defined as the time gap between the end of electrical systole and the end of mechanical systole.4 The negative EMW is frequently detected in individuals at high risk of lethal arrhythmias due to shorter mechanical systole or extended electrical systole.5 The EMW negativity was strongly related to the lability of torsades de pointes (TdP) in an animal model of long QT syndrome (LQTS).6 Subsequently, several studies demonstrated the clinical use of negative EMW in predicting the existence of symptoms in individuals with genotyped LQTS.14 However, there is a lack of information regarding the potential significance of EMW in predicting fatal arrhythmic events in a variety of high-risk populations, including those with ischemic or non-ischemic cardiomyopathies (ICMs) or primary electrical disorders other than LQTS. Thus, we aimed to determine the ability of EMW to predict the incidence of fatal ventricular arrhythmias in patients who implanted the implantable cardioverter-defibrillator (ICD).
METHODS
Study population
The study population was derived from a retrospective single-center cohort of patients who received ICD implantation between 2007 and 2021 for primary or secondary prevention of fatal ventricular arrhythmias. Patients with the following conditions were excluded: 1) those without echocardiography imaging either at baseline or at follow-up, 2) those without echocardiography imaging with adequate quality to be analyzed, 3) those with more than moderate aortic valve stenosis or insufficiency, and 4) those without electrocardiogram (ECG) with adequate quality for measuring. All patients received optimal medical therapy according to the guidelines.
Definition of event and control group
Of the total population, we defined the event group as those who had appropriate ICD shock or anti-tachycardial pacing (ATP) for fatal ventricular arrhythmias, i.e., ventricular tachycardia (VT) or ventricular fibrillation (VF), during the follow-up after ICD implantation. The control group was defined as those who did not receive any appropriate ICD therapy during the follow-up.
Data acquisition
We obtained information on demographic features, purpose, and indication of ICD implantation, and the occurrence of fatal arrhythmic events by retrospectively reviewing the electronic medical records. The data on medications and echocardiography images were acquired at two time points: at baseline and follow-up. The time interval between baseline and follow-up echocardiographic exam was pre-determined for asymptomatic participants, while was adjusted according to the patients’ condition and physicians’ discretion. The “follow-up” time-point in this study indicated the nearest point before the fatal arrhythmic event for the event group and the latest follow-up exam for the control group.
Echocardiographic examinations
All participants had a pair of transthoracic echocardiography (TTE) image sets. TTE was performed according to the recommendations of current guidelines, using the commercially available devices (Vivid E9 or E95, GE Medical Systems; EPIQ 7C or iE33, Philips Healthcare; ACUSON SC2000 or SEQUOIA, Siemens Medical Solutions). The left ventricular ejection fraction (LVEF) was measured by the biplane Simpson's method using the apical 4- and 2-chamber views. The apical 5-chamber view was necessarily acquired for the measurement of EMW.
Calculation of QTc and EMW
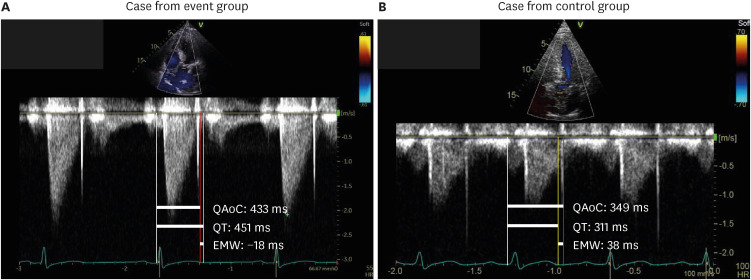
The QTc was calculated by the tangent method and corrected using the Bazett formula. An ECG embedded in the echocardiographic image for EMW measurement was also used to calculate the QTc. The continuous-wave doppler images on the apical 5-chamber view were used for EMW measurement. The EMW was calculated as the time interval between the onset of QRS complex and aortic valve closure (QAoC) minus the QT interval from the ECG of the same beat and measured in the continuous wave doppler image on the apical 5-chamber view of TTE (Fig. 1). We exported all echocardiography images into the DICOM format and loaded them into the dedicated analysis software (RadiAnt DICOM Viewer, Version 2022.1.1). Using the measurement tool incorporated in the software, we could accurately measure the QAoC duration and QT interval in millisecond units. This approach enabled us to consistently measure EMW, regardless of sweep speed or image source from various vendors. In the case of atrial arrhythmias such as atrial fibrillation (AF), atrial flutter (AFL), or other conditions with expected large beat-to-beat variability, we tried to measure the parameters for EMW based on the average values across multiple beats as much as possible (optimally at least 3 beats). Since PVCs are known to significantly impact the measurement of EMW, we excluded cases where it was not possible to measure EMW appropriately due to PVC beats. A primary investigator (T.M.R.) who was blinded to the individual patient's information measured QTc and EMW objectively. The measurements of both parameters were repeated on the same beat of randomly selected subsets of the study population by the primary observer to evaluate the intra-observer variability, and by an independent investigator (H.J.A.) to assess the inter-observer variability.
Fig. 1
Representative cases with measurements of EMW. Representative figures of measuring EMW in (A) case with fatal arrhythmic event and (B) case without fatal arrhythmic event are presented.
QAoC = time interval between the onset of QRS complex and aortic valve closure, EMW = electromechanical window, ms = millisecond.
Statistical analysis
Data were presented as numbers and frequencies for categorical variables, and as mean ± standard deviation or median (1st quartile–3rd quartile) for continuous variables. We conducted a Shapiro-Wilk normality test to verify the normality distribution of the continuous variables. For comparisons between groups, the chi-square test or Fisher’s exact test was used for categorical variables, and an unpaired Student’s t-test or Mann-Whitney test was used for continuous variables, as appropriate. Descriptive statistics and density distribution of EMW were compared between the event and control groups. The correlations of QTc and EMW were displayed in the scatter plots and the Pearson’s correlation coefficients were calculated in both the event and control groups. Univariable and multivariable logistic regression analyses were performed to investigate which parameter is independently associated with the occurrence of a fatal arrhythmic event, by adjusting for potential confounders including secondary prevention, primary electrical disorder, hypertrophic cardiomyopathy, LVEF, and use of class III antiarrhythmics at baseline. Covariates used in the multivariable analysis were selected if they were significantly associated with a fatal arrhythmic event in the univariable logistic regression analysis (P value < 0.2). The discriminant ability of EMW for predicting the occurrence of a fatal ventricular arrhythmic event was evaluated using the receiver operating characteristic (ROC) curve comparing with a multivariable logistic regression model including clinical variables. Best cutoff value of EMW was calculated from the multivariable logistic regression model using the Liu method.7 EMW was also compared between the event and control group in various exploratory subgroups. The intraclass and interclass correlation coefficients (ICCs) were calculated to evaluate the reliability of EMW measurements. A P value of < 0.05 was considered statistically significant. All analyses were conducted using Stata software, version 14.0 (StataCorp., College Station, TX, USA).
RESULTS
Study population
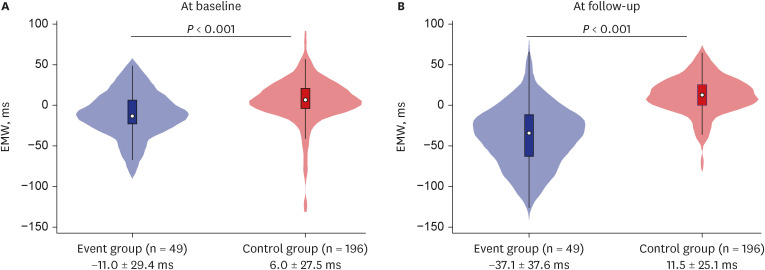
The baseline characteristics of the overall population are listed in Table 1. Of 245 patients (mean age 67.2 years, 63.7% men), 20.0% (49 patients) experienced VT or VF episode that was treated with appropriate ICD shock or ATP. Secondary prevention was considerably more prevalent in the event group. The event group had a lower prevalence of cardiac resynchronization therapy with defibrillator implantation than the control group. QTc at follow-up (QTc-FU) was substantially longer in the event group than in the control group at follow-up, while was comparable between the two groups at baseline (QTc-base). While both groups had similar heart rates at baseline and follow-up, the event group had a greater negative EMW at both baseline (EMW-Baseline) and follow-up (EMW-FU) (Fig. 2). The median duration between baseline and follow-up was 2.4 (1.0–4.8) years.
Table 1
Baseline characteristics according to the occurrence of fatal arrhythmic event
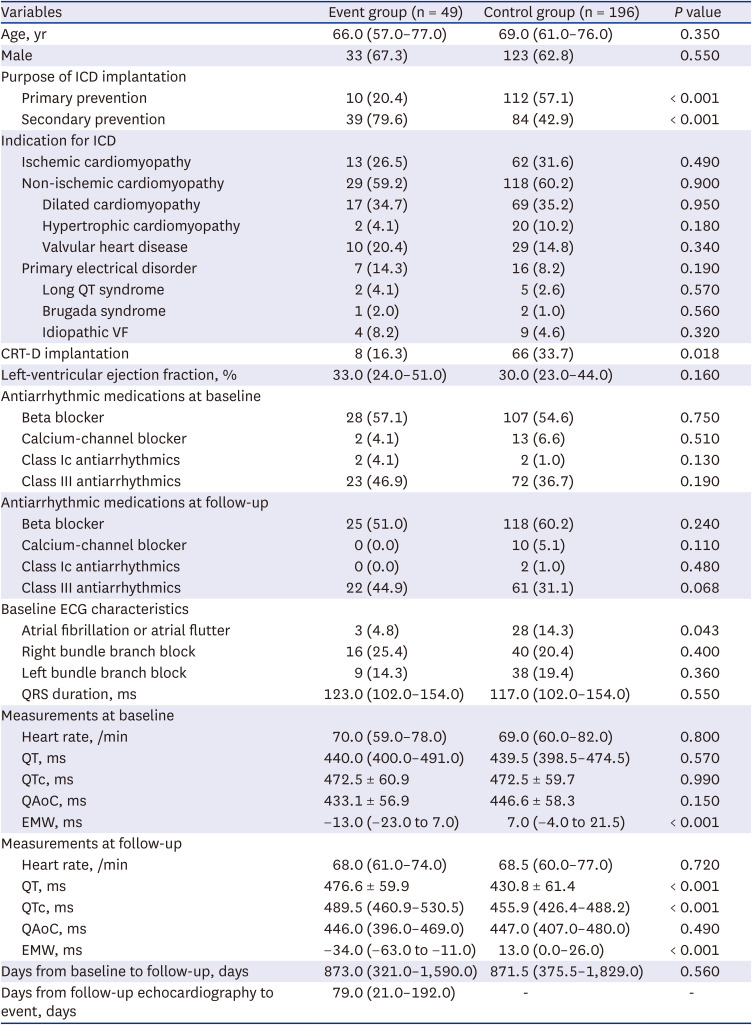
Values are presented as number (%) or (interquartile range) or mean ± standard deviation.
ICD = implantable cardioverter-defibrillation, VF = ventricular fibrillation, CRT-D = cardiac resynchronization therapy with defibrillation, ECG = electrocardiogram, QTc = corrected QT interval, QAoC = time interval from Q to aortic valve closure, EMW = electromechanical window.
Fig. 2
Violin plot of EMW at baseline and follow-up according to the occurrence of fatal arrhythmic event. Violin plots presenting distribution of (A) EMW at baseline, and (B) EMW at follow-up according to the occurrence of fatal arrhythmic event are shown.
EMW = electromechanical window, ms = millisecond.
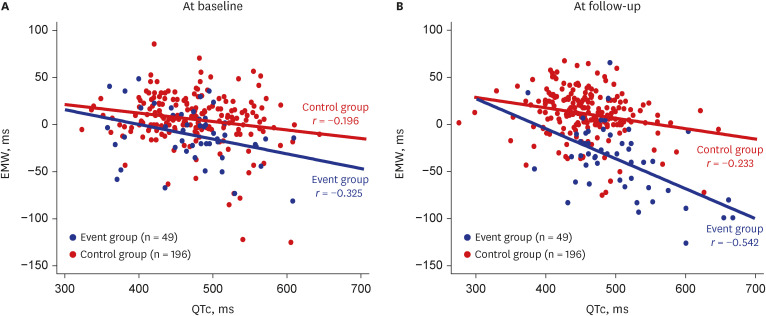
Correlation between QTc and EMW
The scatter plot depicts the relationship between QTc and EMW in the event and control groups (Fig. 3). QTc and EMW had significant weak to moderate negative correlations in the event group. The correlation was highest between QTc-FU and EMW-FU in the event group. (r = −0.542, P < 0.001). QTc fluctuated widely within the given range of EMW, demonstrating a relatively weak association between QTc and EMW especially in the control group.
Predictors and predictive models of a fatal arrhythmic event
ICD implanted for secondary prevention, hypertrophic cardiomyopathy, LVEF, AF or AFL at baseline, use of class III antiarrhythmics at baseline, QTc-FU, EMW-Baseline, and EMW-FU were found as possible predictors of events and included in a multivariable logistic regression model (Table 2). Among them, secondary prevention, QTc-FU, EMW-Baseline, and EMW-FU remained significant predictors of fatal arrhythmic events. Decrease of 1 ms in EMW-Baseline and EMW-FU were linked with a 2% and 6% increase in the probability of events, respectively.
Table 2
Predictors for occurrence of fatal arrhythmic events
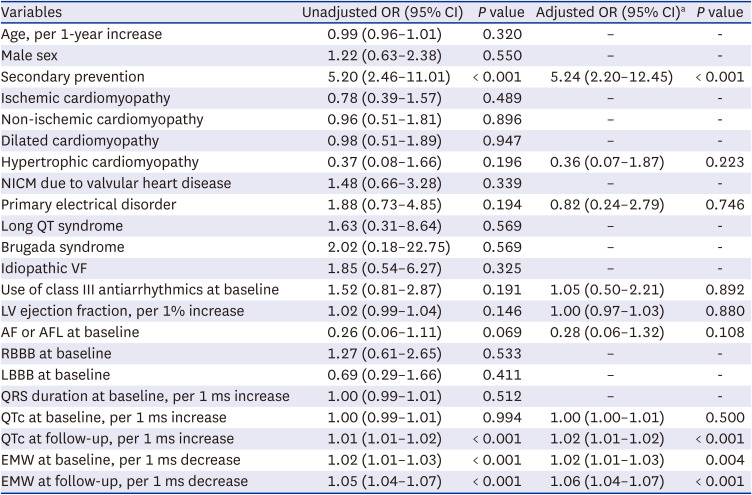
OR = odds ratio, CI = confidence interval, NICM = non-ischaemic cardiomyopathy, VF = ventricular fibrillation, LV = left ventricular, AF = atrial fibrillation, AFL = atrial flutter, RBBB = right bundle branch block, LBBB = left bundle branch block, ms = millisecond, QTc = corrected QT interval, EMW = electromechanical window.
aMultivariable logistic regression model included secondary prevention, hypertrophic cardiomyopathy, primary electrical disorder, use of class III antiarrhythmics at baseline, left ventricular ejection fraction, and AF or AFL at baseline as covariates.
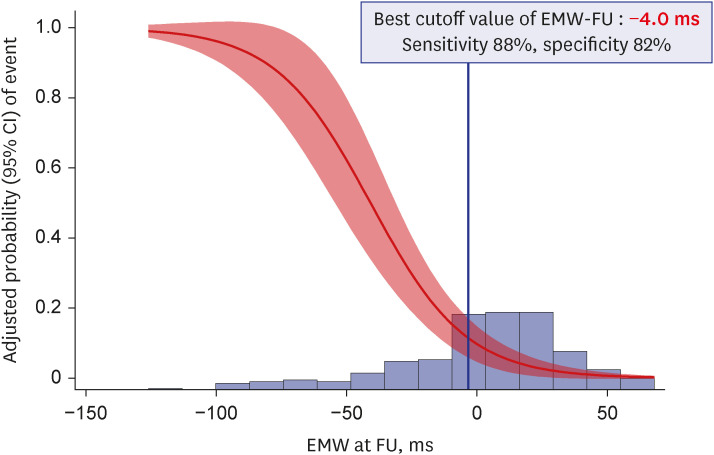
Including EMW-Baseline as an additional covariate significantly improved the predictive ability of a multivariable model including secondary prevention, hypertrophic cardiomyopathy, primary electrical disorder, LVEF, use of class III antiarrhythmics at baseline, and AF or AFL at baseline (area under the curve [AUC] 0.77 [0.70–0.84] vs. AUC 0.72 [0.64–0.80], P = 0.004 against model with clinical variables). The predictive ability of EMW-FU alone (AUC 0.87 [0.81–0.94]) considerably surpassed that of other multivariable models; P = 0.060 against model with clinical variables, P = 0.030 against model with clinical variables and EMW-Baseline (Fig. 4). The cutoff value of EMW-FU for the best performance of model was −4.0 ms with sensitivity of 88% and specificity of 82% (Fig. 5).
Fig. 4
Comparison of models including EMW versus clinical variables for predicting fatal arrhythmic event. ROC curves of predictive models for fatal arrhythmic event are shown.
EMW = electromechanical window, FU = follow-up, AUC = area under the curve, ROC = receiver operation characteristic, CI = confidence interval.
aIncluded secondary prevention, hypertrophic cardiomyopathy, primary electrical disorder, use of class III AED at baseline, left ventricular ejection fraction, and atrial fibrillation/atrial flutter at baseline.
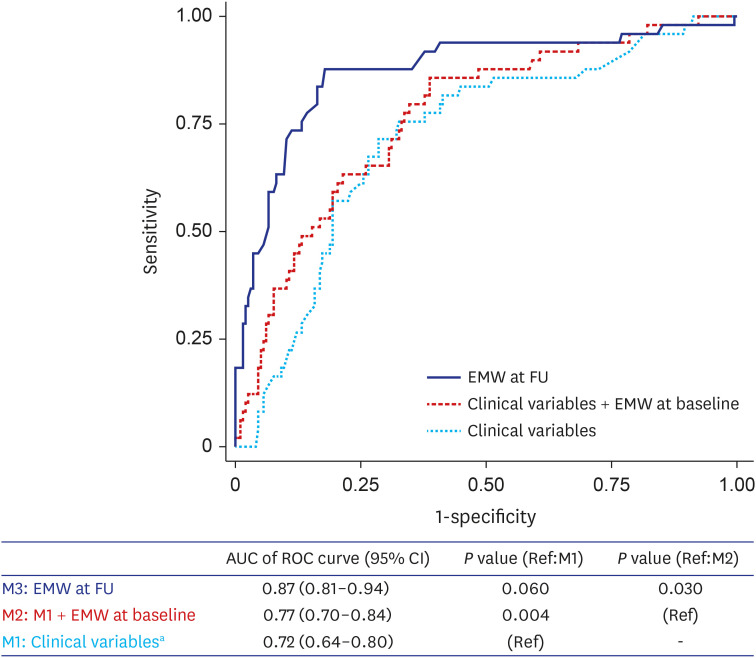
Fig. 5
Best cutoff value of EMW. The adjusted probability with 95% CI of event and the density plot of EMW-FU are presented. The best cutoff value of EMW-FU was calculated from the multivariable logistic regression model using the method by Liu et al.
CI = confidence interval, EMW = electromechanical window, FU = follow-up, ms = millisecond.
EMW in various subgroups
The results were consistent across the majority of exploratory subgroups (Table 3). The negativity of EMW-FU in the event group was prominent in patients with non-ICM (−40.0 [−67.0 to −20.0 ms]) and non-ICM due to valvular heart disease (−61.0 [−80.0 to −31.0 ms]). EMW-Baseline was also significantly more negative in the event group in or for individuals who had non-ICM (especially DCM) or who had implanted ICD for secondary prevention. The performance of predictive models were compared in subgroups (Table 4). Among all subgroups, the model with EMW-FU alone showed the best predictive ability with the AUC of ROC ranging from 0.83 to 0.96. The predictive ability of clinical variables and EMW-Baseline was better in cardiomyopathies (both ICM and non-ICM) than in primary electrical disorder.
Table 3
Profiles of corrected QT interval and electromechanical window according to the occurrence of fatal arrhythmic event in various exploratory subgroups
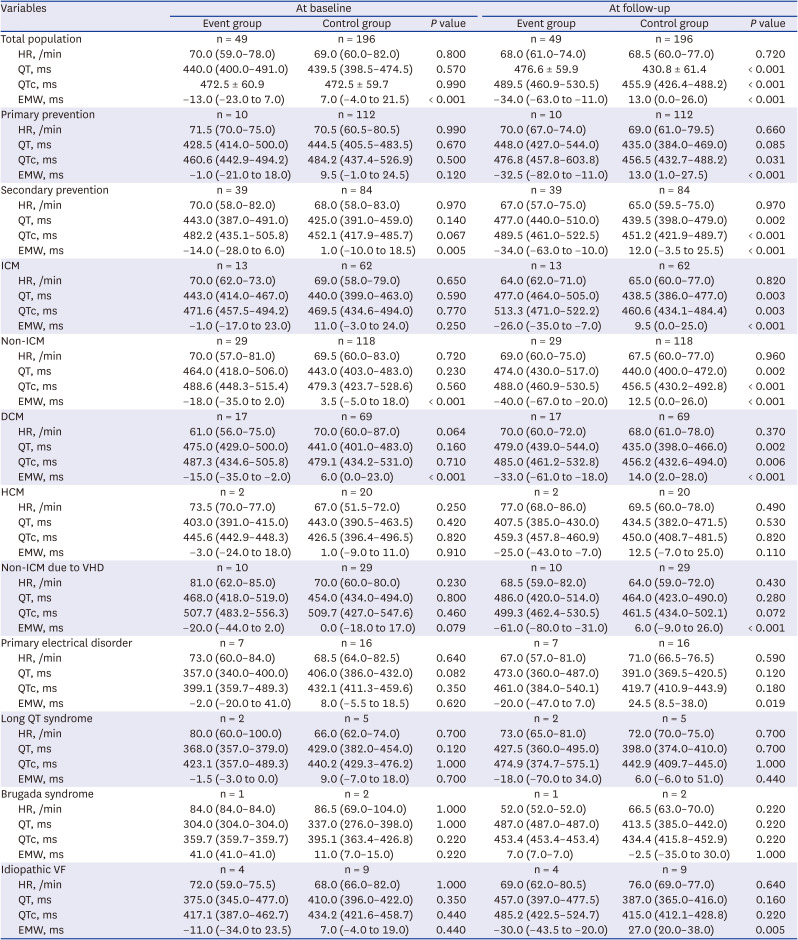
Values are presented as odds ratio (95% confidence interval) or mean ± standard deviation.
HR = heart rate, QTc = corrected QT interval, ms = millisecond, EMW = electromechanical window, ICM = ischemic cardiomyopathy, DCM = dilated cardiomyopathy, HCM = hypertrophic cardiomyopathy, VHD = valvular heart disease, VF = ventricular fibrillation.
Table 4
Predictive ability of EMW at baseline and follow-up for fatal arrhythmic event in various exploratory subgroups
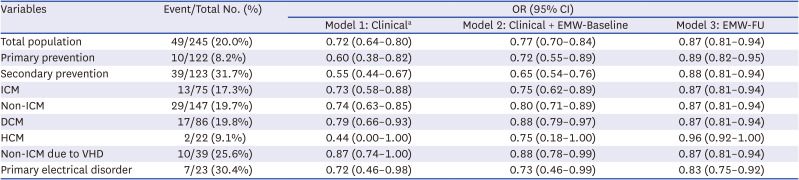
EMW = electromechnical window, OR = odds ratio, CI = confidence interval, EMW-FU = electromechnical window follow-up, ICM = ischemic cardiomyopathy, DCM = dilated cardiomyopathy, HCM = hypertrophic cardiomyopathy, VHD = valvular heart disease.
aMultivariable logistic regression model including secondary prevention, HCM, primary electrical disorder, use of class III AED at baseline, left ventricular ejection fraction, and atrial fibrillation or atrial flutter at baseline.
Sensitivity analysis
To enhance the reproducibility of our study, a sensitivity analysis was conducted on a homogeneous patient population of 217 individuals who experienced only VF events excluding monomorphic VT cases, and 171 patients who did not undergo CRT. The results were consistent, revealing a significant negativity of EMW-FU (Supplementary Table 1).
DISCUSSION
The purpose of this study was to determine the predictive ability of EMW for fatal arrhythmic events necessitating appropriate shock or ATP in patients having ICD for a variety of clinical indications. The correlation between EMW and QTc was particularly weaker in the control group due to the relatively wide range of the QTc distribution in comparison to EMW. Both negative EMW at baseline and follow-up were found to be strongly related to an increased risk of fatal arrhythmic events. A univariable model with EMW-FU alone outperformed the multivariable model including clinical variables to predict fatal arrhythmic events, and even EMW-Baseline significantly improved the predictive ability of clinical variable-based multivariable model.
Identifying people at risk of fatal ventricular arrhythmia is challenging, particularly in those who have no prior symptoms and a normal or borderline QTc.8 Mechanical heterogeneity has been known to be more apparent in symptomatic LQTS, as evidenced by longer duration of myocardial contraction and greater regional and transmural mechanical dispersion.91011 The EMW, defined as the difference between durations of electrical and mechanical systole, is an indicator of global electromechanical coupling.6 EMW becomes negative when there is a discrepancy between the end of electrical and mechanical systole as a result of shortened mechanical systole, prolonged electrical systole lengthening, or both.1 The link between EMW and the likelihood of TdP was described in the animal model study of LQTS6 and also was validated in clinical studies.14 In comparison to asymptomatic LQTS patients or healthy individuals, symptomatic patients with genotype-positive LQTS had more extremely negative EMW.1
In the present study, we evaluated the predictive value of EMW for the occurrence of fatal arrhythmic events in patients who had ICD for various clinical indications. The predictive value of the model with EMW was significantly greater than that of multivariable model comprising important clinical variables. This result was consistent not only in the total heterogeneous population but also across the various disease-specific subgroups. In similar, previous research has proven a relationship between a negative EMW and an increased risk of mortality in individuals with coronary artery disease12 and mitral valve prolapse.13
To our knowledge, this is the first study to demonstrate the predictive value of EMW in a variety of conditions, including primary electrical disorders and structural heart diseases, both of which can result in fatal ventricular arrhythmia. Notably, in this study, the association between QTc and EMW was relatively modest in the control group. This finding could be explained by the fact that, even in cases with similar EMW, the range of QTc in the control group varied widely. Hence, EMW may be more accurate than QTc in identifying patients who are predicted to be event-free. Additionally, we discovered that not only EMW-FU but EMW-baseline was also capable of predicting the occurrence of future events. Even though the baseline EMW did not show sufficient negativity in our analysis, a significant difference was still observed between the event group and the control group, and the baseline EMW was confirmed as an independent predictor in the multivariable regression analysis. Indeed, the class III medication may have impacted the results of our study, particularly on the prolongation of QTc at the follow-up measurement. However, in our multivariable analysis, class III medication use was not found to be a significant factor to predict the occurrence of event, and the clinical significance of EMW negativity remained robust even after adjusting for it. Although we need further prospective studies to validate this finding, it is an important observation that suggests the possibility of the long-term predictive ability of EMW.
Although the mechanism linking electromechanical coupling to arrhythmogenesis is largely unclear, it has been suggested that the link between abnormal calcium handling and action potential prolongation may aggravate regional heterogeneity of LV contraction.114 The current consensus is that electrical-mechanical discrepancy is mainly caused by abnormal cell calcium handling with prolonged or increasing calcium concentration.1516 The continuation of repolarization after mechanical systole results in prolonged action potential duration and cardiac Ca2+ overload during diastole.17 These can induce tachyarrhythmias by causing the occurrence of early and late potentials, and mechanical postsystolic contraction.1819 Furthermore, cardiac mechanoreceptors may be activated by postsystolic contraction, which may also contribute to the pathophysiology of the serious arrhythmias.120 The premature ventricular complexes induced by mechanical aftercontractions could also result in the development of TdP.21 However, subsequent studies are needed to determine if this mechanistic basis can be applied to patients with various structural heart diseases or primary electrical disorders other than LQTS.
EMW is a novel risk assessment method that is easily reproducible and reflects both the electrical and mechanical aspects of the heart vulnerable to fatal ventricular arrhythmias.22 Clinical cardiac sonographers can achieve reliable, accurate, and simple measurement of EMW after dedicated training.1 Although the present study did not examine the direct effect of dedicated training, the intra- and inter-observer agreement for EMW was excellent. The clinical value of EMW is expected to be maximized by integrating EMW measurement in the routine echocardiographic examination process. Notably, in this study, we suggested a cutoff value of −4.0 ms for EMW to predict the recent fatal ventricular arrhythmia. Further analysis regarding the clinical utility of suggested cutoff value is warranted in external cohorts.
TdP can be avoided by medical interventions using beta-blockers or calcium-channel blockers that can prevent aftercontractions and make EMW less negative.61921 A pilot study suggested that the impact of left cardiac sympathetic denervation therapy may be mediated in part by the restoration of electromechanical order, as indicated by the normalization of their EMW, particularly in patients with LQT1.22 EMW may be useful in longitudinal monitoring as one of the indicators for the preventive efficacy of these medications or interventions.
First, the present study was a single-center retrospective study without external validation. Second, the time point for echocardiography exams and EMW measurements at follow-up varied significantly. Third, the possibility of fluctuation in the QT interval on a circadian or beat-to-beat basis was not considered. Fourth, the markers of electromechanical dispersion using speckle-tracking strain analysis or tissue doppler were not evaluated. Fifth, laboratory results were not available for all patients at the time of their clinic visit, we were unable to include the electrolyte level or serum levels of biomarkers results in the analysis. Finally, due to the lack of a standardized protocol for EMW measurement in the echocardiography lab, there may be occasions where the position of ECG lead for QT interval measurement was inadequate.
The negativity of EMW had significant predictive value for the future fatal arrhythmic events in patients who had ICD for primary or secondary prevention. EMW may be beneficial for risk stratification of many high-risk populations for fatal ventricular arrhythmias as an easily-measurable marker of electromechanical coupling.
 XML Download