

 PDF
PDF Citation
 Print
Print


INTRODUCTION
There has been a steady increase in the global prevalence of diabetes due to altered lifestyles, an increase in obesity rates, and a larger aging population [1]. The cost of diabetes treatment is also growing, and today diabetes poses a substantial economic burden for individuals, households, and health systems [2]. A personalized approach to the care of patients with diabetes provides a unique treatment plan for each patient to motivate them to manage blood sugar levels and teach them to incorporate diabetes-associated lifestyle changes in day-to-day life to prevent long-term complications [34]. The guidelines for Medical Nutrition Therapy (MNT) for patients with diabetes recommend continuous diet control under the care of a professional nutritionist. MNT comprises the assessment of the nutritional status of a patient and recommendations for nutritional intervention in addition to basic education on nutrition and two to three follow-up educational interventions for sustained management of diabetes based on personal lifestyle habits and disease status evaluations [5].
Chronic inflammation plays a key role in the development and progression of chronic diseases [6], and dietary therapy has been proposed as an essential intervention to suppress the inflammatory response [7]. In the management of diabetes, it is essential to prioritize blood sugar control. In addition, a reduction in inflammation will prevent blood vessel damage and associated long-term diabetic complications [8]. Shivappa et al. [9] developed an index, referred to as the dietary inflammatory index (DII) that can measure the inflammatory potential of various foods. Many studies have used the DII to prove the relevance of diet-associated inflammation in chronic diseases such as cancer, cardiovascular disease, and obesity [10111213]. However, since the DII requires complex calculations, it is limited to being used as a tool for evaluating a patient's diet in the clinic. Also, the DII was developed abroad and includes foods or ingredients that are not commonly used in Korea. Therefore, we developed a food-based index of dietary inflammatory potential (FBDI), which comprises seven anti-inflammatory and three inflammatory food groups, as a tool to evaluate the inflammatory potential of foods. The FBDI has the advantage of quickly evaluating the degree of inflammation due to the diet in clinical settings.
Therefore, this study aimed to evaluate the effects of nutrition education involving pro- and anti-inflammatory foods and diabetes nutrition management guidelines on inflammation in patients with diabetes. A single-blind, parallel-group randomized control trial was conducted to compare the effects of Intensive Nutritional Education (IE) based on the clinical nutritional guidelines and Basic Nutritional Education (BE) on diabetes-related clinical indices and inflammatory markers.
SUBJECTS AND METHODS
Study Subjects and Interventions
The participant enrollment and the retention flow are shown in Fig. 1. This study's inclusion criteria included adults aged 30–75 diagnosed with diabetes. The exclusion criteria included subjects who were uncomfortable performing activities associated with the interventions or communicating with the researchers and those diagnosed with specific diseases such as stroke and myocardial infarction. A total of 120 subjects were included in the study. A total of 120 subjects were enrolled in the study and randomly divided into the treatment group (intensive nutritional education group; IE) and the control group (basic nutritional education group; BE) in a 1:1 ratio.
Fig. 1
Flowchart of subject selection.
BE, basic nutritional education group; IE, intensive nutritional education group.
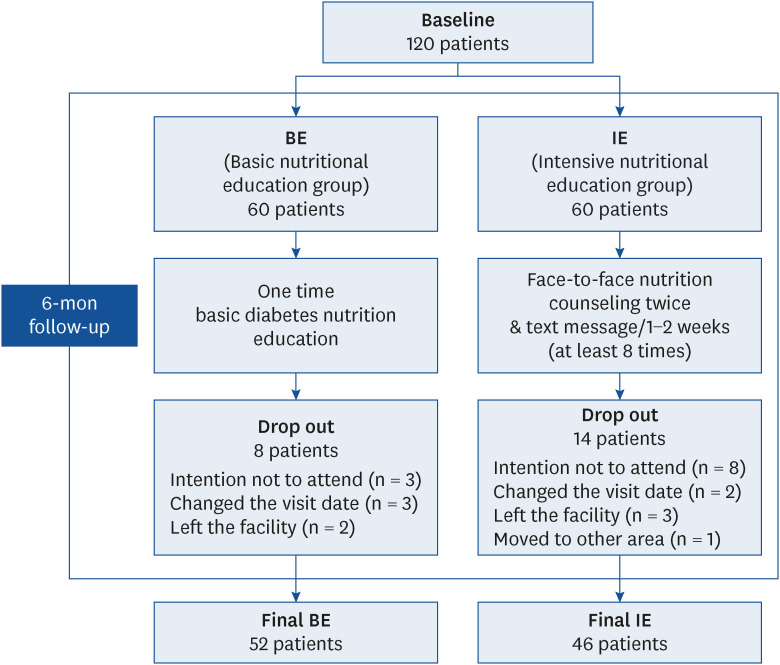
Among the selected candidates, those who showed an intention of not wanting to attend the program (11 subjects), those who changed the visit date (5 subjects), those who left the facility (5 subjects), and those who moved to other areas (1 subject) were excluded from the final analysis. This study was approved by the Institutional Review Board of Wonkwang University (WKIRB-201705-SB-008) and was conducted after the participants were given an adequate explanation of the study and after obtaining their written consent.
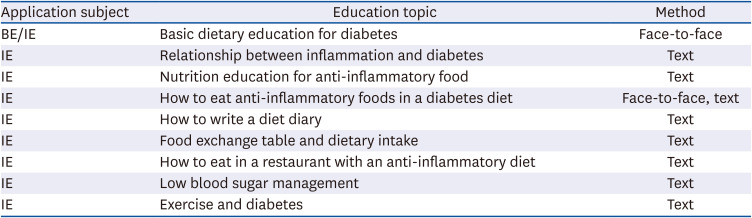
The nutrition education intervention program is shown in Table 1. During the six months of intervention, the IE group was provided with face-to-face nutrition counseling twice, followed by text interventions. Basic nutrition education related to diabetes and information on methods to prevent diet-associated inflammation were provided in the one-time nutrition education program prior to the initiation of the study. Two months after the start of the study, personalized nutritional education was conducted in person. After that, text messages were sent at least eight times i.e., every 1–2 weeks, comprising nutritional counseling and information on the use of anti-inflammatory foods. Nutritional education for the BE group involved a single session on basic diabetes nutrition and anti-inflammatory foods.
Table 1
Nutrition education program for BE and IE subjects
Measurements
To analyze the effect of nutrition education, the same survey was conducted twice, first at the beginning of the intervention study and then six months later, i.e., after completion of the nutrition education intervention program. General information, lifestyle factors, and anthropometric measurements were taken, biochemical indicators and levels of inflammatory indicators were assessed, and dietary intake surveys were conducted. As part of the lifestyle survey, exercise, smoking, alcohol consumption, dietary supplements, and use of other drugs were investigated.
Anthropometric measurement
We measured body weight, height, and blood pressure. The current weight and height were measured using an automatic weighing machine (GL-150KT; G-Tech International, Uijeongbu, Korea). Systolic and diastolic blood pressure was measured twice using an automated sphygmomanometer (Jawon Medical, Seoul, Korea) in a comfortable sitting position after 10 min of rest, and the average value was used.
Measurement of biochemical parameters
Nine mL of venous blood was collected from all subjects for the biochemical measurements. The blood glucose, triglycerides, total cholesterol, high density lipoprotein (HDL)-cholesterol, low density lipoprotein (LDL)-cholesterol, high sensitivity C-reactive protein (hs-CRP), interleukin-6 (IL-6), and tumor necrosis factor-α (TNF-α) were measured in serum, and glycated hemoglobin (HbA1c) was measured in whole blood. Blood glucose, triglycerides, total cholesterol, HDL-cholesterol, and LDL-cholesterol were analyzed using an automatic biochemical analyzer BS-220 (Mindray, Shenzhen, China). The hs-CRP was measured using the i-chroma II (Bodytech, Chuncheon, Korea) diagnostic immuno-analyzer. IL-6 and TNF-α were measured by the enzyme-linked immunosorbent assay through a specialized analysis agency (Green Cross Labcell, Yongin, Korea).
Analysis of dietary intake
For the analysis of the dietary intake, we requested the name of the foods consumed the day before the survey, the ingredients, and the amounts using a 24-h recall method. A food model card was used to help people remember the types and amounts of foods they ate the day before. The Korean Nutrition Society’s computer-aided nutritional analysis program (CAN pro web ver.) was used for the dietary intake analysis. The FBDI formula used was developed in a previous study [14], and the dietary intake survey data of the subjects were used to calculate the FBDI score. The FBDI formula was calculated by adding the multiplied values of each β coefficient and the intake of 10 foods associated with inflammation in Koreans from among the foods eaten by the subjects.
Statistical analysis
To examine the differences in baseline characteristics between the IE and BE groups, the Chi-square test and the independent t-test were performed before the intervention. Nominal variables such as gender, exercise status, smoking status, and diagnosis of other diseases were expressed as number (%), and continuous variables such as age, body mass index (BMI), blood pressure, biochemical index, and inflammatory index were expressed as mean ± SD. The paired t-test was used to analyze the differences in the groups before and after the intervention using parameters such as anthropometric measurements, the biochemical index, and nutrient intake. An independent t-test was conducted to determine the difference between the groups with respect to the changes before and after the interventions. A multiple regression model was used to evaluate each independent variable (FBDI score change, the type of education, change in BMI, age, and gender) based on the change in TNF-α levels. All analyses used the SPSS (Statistical Package for Social Science; IBM Corp., Armonk, NY, USA) ver. 23.0 program.
RESULTS
Baseline characteristics
Ninety-nine of the 120 subjects in this study completed the final intervention. Table 2 shows the comparison of the baseline characteristics of the study subjects. Among the subjects, there were 70 males (58%) and 50 females (42%), and the average age was 58.7 years. The results of verifying the homogeneity of the two groups before the intervention showed that there were no significant differences in general characteristics such as sex and age between the groups. Also, there were no significant differences between the IE intervention group and the BE intervention group in terms of nutrient intake, physical activity, alcohol consumption, smoking habits, the prevalence of hypertension and dyslipidemia, HbA1c levels, and inflammatory markers in circulation, including hs-CRP, IL-6, and TNF-α.
Table 2
General characteristics and dietary intake of the subjects at baseline
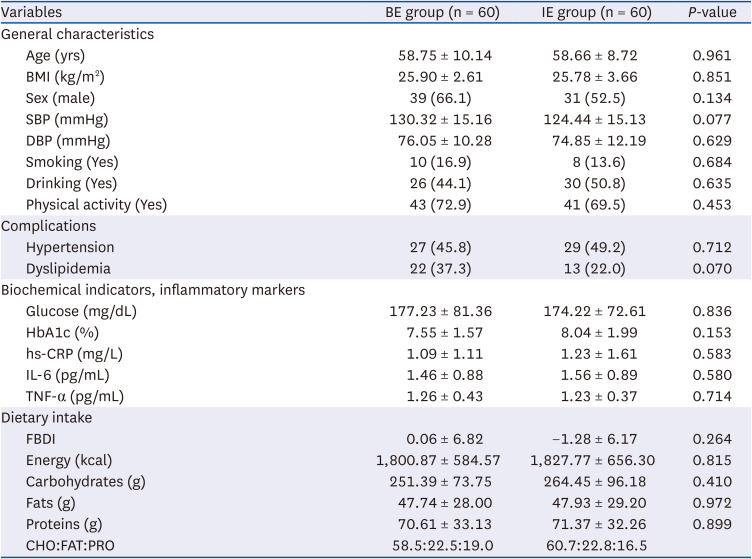
Values are presented as mean ± SD or number (%). P-values were determined by t-test.
BE, basic nutritional education group; IE, intensive nutritional education group; BMI, body mass index; SBP, systolic blood pressure; DBP, diastolic blood pressure; HbA1c, glycated hemoglobin; hs-CRP, high-sensitivity C-reactive protein; IL-6, interleukin-6; TNF-α, tumor necrosis factor-α; FBDI, food-based dietary inflammation potential; CHO, carbohydrates; FAT, fats; PRO, proteins.
The effects of the dietary education intervention
At six months, 76.7% (46/60) of the IE group and 86.7% (52/60) of the BE group had completed their follow-up schedules. There were no significant differences in the attrition rates between the two groups. Table 3 shows the changes in the anthropometric and biochemical parameters of the IE and BE groups. After the nutrition education intervention, there was no significant change in the biochemical indicators in the BE group. However, in the IE group, the HDL-cholesterol increased significantly from 42.5 mg/dL to 49.2 mg/dL (P = 0.009), and TNF-α also decreased significantly after intervention from 1.25 pg/mL to 1.11 pg/mL (P = 0.004). HbA1c decreased from 8.0% to 7.3% in the IE group but increased from 7.4% to 7.5% in the BE group, and the differences between the groups were significant (P = 0.029).
Table 3
Changes in the anthropometric and biochemical indexes between baseline and 6-mon follow-up
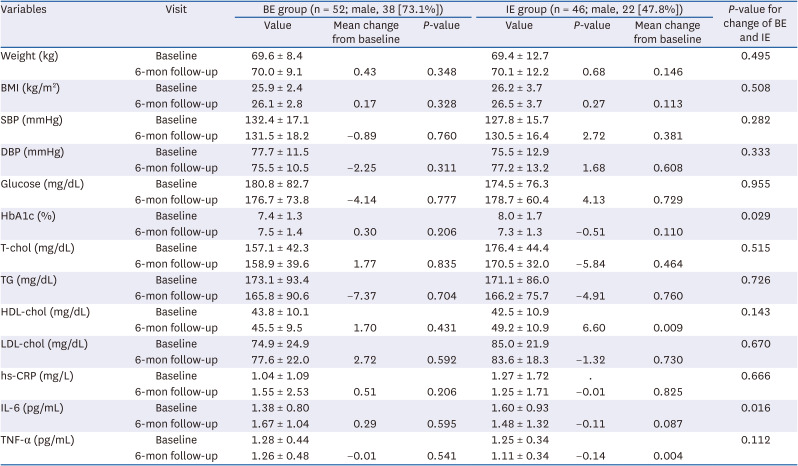
Values are presented as mean ± SD. P-values were determined by the paired t-test.
BE, basic nutritional education group; IE, intensive nutritional education group; BMI, body mass index; SBP, systolic blood pressure; DBP, diastolic blood pressure; T-chol, total cholesterol; TG, triglyceride; hs-CRP, high-sensitivity C-reactive protein; IL-6, interleukin-6; TNF-α, tumor necrosis factor-α.
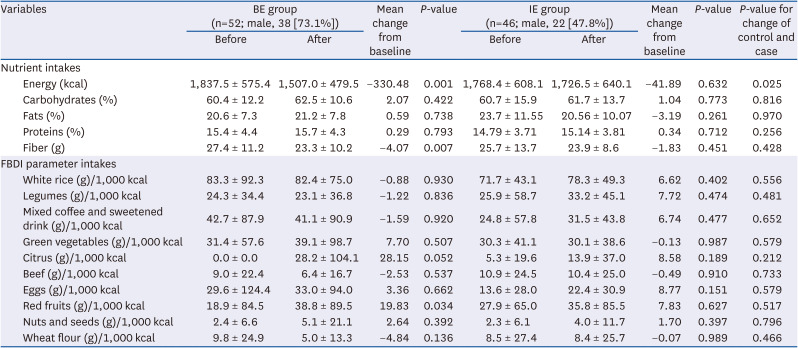
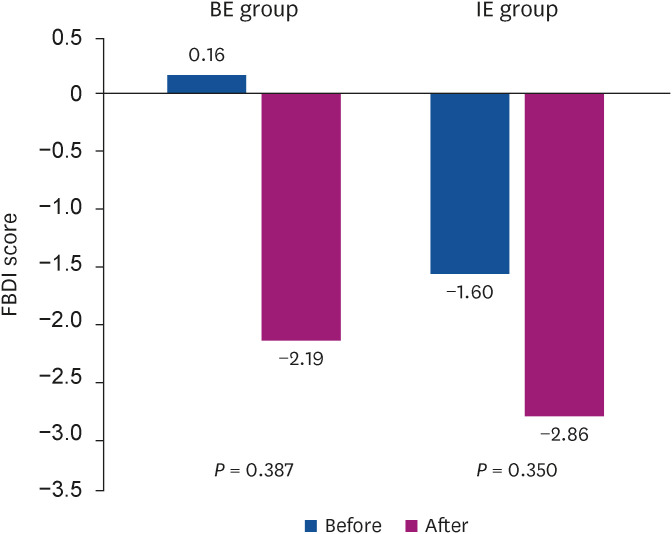
Table 4 shows the changes in the dietary intake before and after nutrition education in the IE and BE groups. There was no significant change observed in the intake of different food groups in the IE group. However, in the BE group, there was a tendency for the intake of orange citrus fruits to increase from 0 g/1,000 kcal prior to the intervention to 28.2 g/1,000 kcal (P = 0.052) post-intervention. Fig. 2 represents the differences in the FBDI score between the IE and BE groups before and after the intervention. The FBDI score did not change significantly after the nutrition education intervention for both groups.
Table 4
Changes in the dietary intake between baseline and 6-mon follow-up
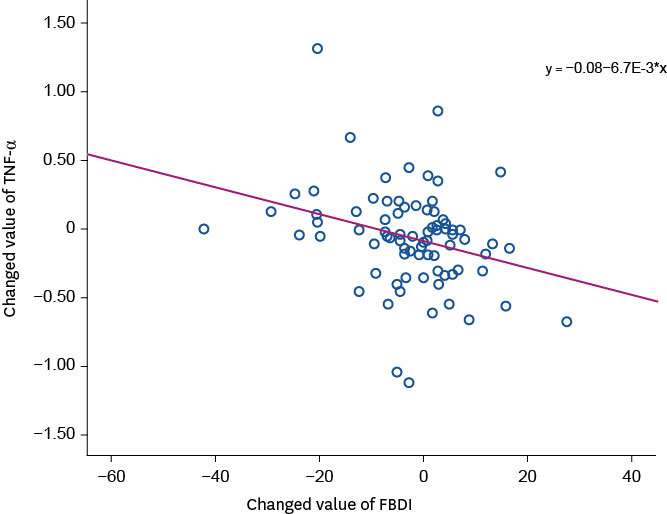
Factors contributing to inflammatory markers
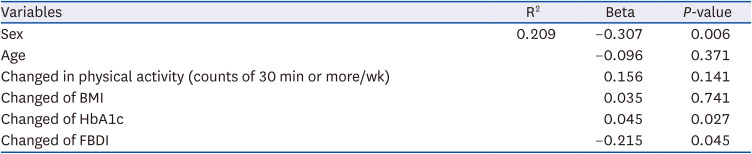
Table 5 and Fig. 3 show the association between the changes in the FBDI score and TNF-α. A multiple regression model was used to evaluate the factors contributing to the levels of inflammatory markers, especially TNF-α, which changed after the intervention. After six months of nutrition education intervention, the changes in HbA1c and FBDI scores contributed to changes in TNF-α.
Table 5
Multiple regression model for changed TNF-α markers according to the changed FBDI score
DISCUSSION
This study investigated the changes in patient blood sugar levels and the improvement in inflammatory markers through individualized education on nutrition given to diabetes patients. The participants were divided into two groups by randomization. One group received in-depth and sustained nutrition education, and the other received a single session of basic nutrition education. Only the group provided with intensive nutrition-related education showed an improvement in the HDL-cholesterol (P = 0.009) and HbA1c levels and a significant decrease in TNF-α (P = 0.004) after the intervention. The HbA1c levels were significantly lower in the IE group compared to the BE group. The FBDI score and HbA1c levels appear to significantly affect the TNF-α levels, and it was observed that the lower the FBDI score and HbA1c levels, the lower the levels of TNF-α. Thus, it was confirmed that glycemic control and the intake of anti-inflammatory foods had a significant effect on the inflammatory status of patients with diabetes.
There was no change in the blood sugar or lipid levels in the BE group, which received only one dietary education session about dietary therapy and food selection methods to reduce inflammation. Providing face-to-face education for patients with diabetes requires a significant amount of time and burdens the patient. It, therefore, often ends with just a one-time counseling session. However, in a study by Cho et al., [15] as in this study, there was no significant change in HbA1c levels in the group receiving one-time nutrition education. This study confirmed that a one-time nutrition counseling session is insufficient to bring about any significant shift in dietary habits to induce changes in blood sugar. A continuous nutrition education program should be considered to strengthen the patient's dietary practices.
In this study, to encourage healthy eating habits among individuals, the IE group used a combination of face-to-face and text-based education, thus providing the patients with increased access to educators. Text messages are widely used in behavior change research because they are commonly available, inexpensive, and promote health behavior resulting in a rapid shift in habits and immediate health benefits. Studies on promoting physical activity through changes in health behavior for weight control have proven the effectiveness of education using text messages [16]. However, in a study by Kim et al., [17] text message-based education conducted for six months as a weight control program for obese people at a worksite was not effective in weight loss. Thus, this method is not believed to be consistently effective [18].
One-time diabetes nutrition education is not sufficient to bring about behavioral change. Therefore, continuous educational inputs and follow-up are needed to see significant health-related behavioral shifts. However, it is cumbersome and burdensome in this modern age for busy people to visit a hospital several times. Therefore, web-based programs, smartphone applications, or text messages are being implemented as diabetes education techniques that can save costs and time. Since the subjects were unfamiliar with computers, this study conducted the education program using text messages. As a result, the blood glucose and lipid levels of the group with intensive education significantly improved after the intervention. The change in blood glucose and lipid levels between groups showed a significant difference. Thus, this study demonstrated the effectiveness of continuous education on nutrition in diabetes management through text messages.
Type 2 diabetes causes abnormal carbohydrate and lipid metabolism due to insulin resistance and impaired insulin secretion [19]. Insulin resistance promotes fat storage, making it difficult to build and maintain healthy muscles. An increase in fat mass worsens the body's inflammatory response [20]. In a study by Pickup et al., [21] blood IL-6 and TNF-α levels were increased in type 2 diabetes patients. Inflammatory factors such as TNF-α, IL-6, and CRP raise the risk of metabolic disorders and cardiovascular disease [2223]. Therefore, managing inflammation through diet control is necessary to prevent long-term cardiovascular complications. In this study, we evaluated the benefits of food selection methods in lowering inflammation and blood sugar levels. The results showed that only the IE group showed a significant decrease in TNF-α. The significant improvement in the inflammatory markers of the IE group could be attributed to the intake of anti-inflammatory foods. These positive effects may be attributed to the antioxidants, phytochemicals, and dietary fiber which are components of anti-inflammatory foods.
Based on regression analysis, besides anti-inflammatory foods, HbA1c was found to be another factor affecting TNF-α levels. Earlier studies have shown that weight loss was significantly associated with a reduction in the inflammation index measured based on circulating inflammatory marker levels [2425]. However, this study did not find any association between BMI and the inflammation index. Also, it was found that physical activity did not affect TNF-α. Therefore, this study showed that to control the body’s inflammation, blood sugar, and dietary intake should be the priority targets. In a study by Mirza et al., [26] in 367 Mexican American patients with diabetes, IL-6, and blood glucose were positively correlated. Therefore, managing diabetes patients through intensive treatment to lower blood glucose and inflammatory markers could prevent diabetic complications.
The FBDI scores decreased in both the IE and BE groups, but there was no significant difference between the two groups. These results are similar to a previously conducted study using the energy-adjusted Dietary Inflammatory Index (E-DIITM) score. The study compared the changes in E-DII in the experimental and control group with the increase in intake of watermelon, an anti-inflammatory food. There was no significant difference in E-DII scores between the two groups, but the levels of inflammation were significantly lower in the nutritional intervention group [27]. The absence of any significant differences in the food intake in our study can be attributed to the fact that the usual dietary intake may not be properly reflected by examining only daily meals using the 24-h recall method. As the food items of FBDI comprise fruits and vegetables, there was a limit to the increase in intake due to the seasonal nature of these food items.
The purpose of this study was to evaluate the effect of medical nutrition therapy by encouraging the use of foods with low FBDI scores, through intensive education in patients with diabetes, to improve their metabolic indices and inflammatory markers. However, this study has several limitations. The inflammation in the body increases in various chronic diseases. Hence, it was not possible to generalize the benefits of foods with low FBDI scores in other chronic disease conditions just because index improvement was seen in diabetes patients. Nevertheless, it is worth noting that in this study improvements were seen in the meaningful indicators assessed, and therefore patients with diabetes should see improvement through participation in intensive nutrition education programs. This improvement can be assessed using dietary inflammation indicators that reflect the characteristics of the dietary intake of Koreans. Currently, it has been revealed through several studies, that inflammation is commonly seen in various chronic diseases and can be caused by eating foods that increase inflammation. Therefore, in addition to recommending the intake of select foods for practical medical nutrition therapy in the future, additional practical information that can be applied in everyday life such as supplying cooking recipes using anti-inflammatory foods, grocery shopping tips, and choosing appropriate foods while eating out is required.
 XML Download