

 PDF
PDF Citation
 Print
Print


INTRODUCTION
The prevalence of obesity in Korea is steadily increasing. The adult obesity rate among Koreas aged ≥ 20 increased from 32.4% in 2012 to 38.3% in 2020. The obesity rate for men is higher than for women in 2020 (48.0% and 27.7%) [1]. It has been well established that obesity is strongly associated with increased risks of obesity-related disorders such as type 2 diabetes, hyperlipidemia, hypertension, and metabolic syndrome [2].
Obesity is caused by the growth and expansion of adipose tissue. Most tissues stop growing or reduce in size after adulthood, but adipose tissue increases in adults when caloric intake exceeds expenditure [3]. An increase in adipose tissue is not only dependent on the expressions of adipogenic genes but also requires angiogenesis to establish the blood vessels required to supply the nutrients necessary for adipocyte proliferation, differentiation, and growth.
Adipogenesis is controlled by several adipogenic transcription factors such as CCAAT/enhancer binding protein β (C/EBPβ), C/EBPα (expressed in the early stage of adipogenesis), and peroxisome proliferator-activated receptor γ (PPARγ) (expressed during the later stage) [45]. During adipogenesis, angiogenesis is essential to supply oxygen and nutrients to adipose tissue. Angiogenesis is a complex process stimulated by angiogenesis promoters and proceeds in a series of stages [6]. Angiogenesis-promoting factors are secreted and bind to their respective receptors on vascular endothelial cells, activating these cells. During the initial stage, matrix metalloproteinases (MMPs) are secreted and activated to decompose the basement membrane and extracellular matrix (ECM) around vascular endothelial cells, which then migrate and proliferate from existing blood vessels [7]. These previous observations show that adipogenesis and angiogenesis play important roles in adipocyte hyperplasia and the hypertrophic capacity of adipocytes.
Research on adipocyte differentiation and functional control using food-derived bioactive substances is being conducted [891011121314]. Quercetin (3,5,7,3′,4′-pentahydroxyflavone) is a polyphenol abundantly present in fruits and vegetables (especially onions). It has been reported to have anti-obesity effects by inducing adipocyte apoptosis [15] or inhibiting adipogenesis by inducing the expressions of genes involved in fatty acid oxidation and energy metabolism [16]. However, although it has been reported that the MMPs in adipose tissue play an important role in obesity [67], studies on the relationship between MMPs activation and quercetin are limited to in vitro cell studies [171819]. Thus, mechanistic studies are required in animal models of obesity to identify the biological mechanisms involved. Accordingly, this in vivo study was conducted to determine whether quercetin inhibits adipogenesis, and thus, obesity, by inhibiting MMP expressions in a high-fat diet (HFD)-induced animal model.
MATERIALS AND METHODS
Animals and study design
Five-wk-old C57BL/6J mice (Daehan Biolink, Eumsung, Korea) were randomly allocated to 4 experimental groups; a normal-fat diet group (ND, n = 8; containing 7% fat on a diet weight basis), HFD group (HFD, n = 8; containing 25% fat and 0.5% cholesterol), HFD with 0.05% quercetin group (HFQ0.05, n = 8; containing 25% fat, 0.5% cholesterol, and 0.05% quercetin), and HFD with 0.15% quercetin group (HFQ0.15, n = 8; containing 25% fat, 0.5% cholesterol, and 0.15% quercetin). All mice were fed the AIN-93G diet but with different amounts of fat, cholesterol, quercetin, and carbohydrate (Table 1). Quercetin (purity ≥ 95.0%) was purchased from Sigma-Aldrich (Sigma Aldrich, St. Louis, MO, USA). Mice were housed individually in stainless steel cages in conditioned rooms (temperature 23 ± 1°C, humidity 60%, 12:12-h light-dark cycle) and weighed weekly during the 16-wk experimental period. All experiments were approved beforehand by the Animal Testing Ethics Committee of Dankook University (DKU-19-021).
Table 1
Compositions of the experimental diets
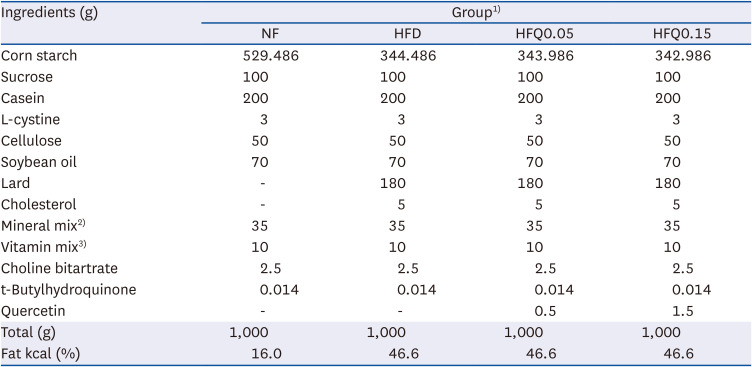
1)ND, normal fat diet; HFD, high fat diet; HFQ0.05, high fat diet + quercetin 0.05%; HFQ0.15, high fat diet + quercetin 0.15%.
2)Mineral mixture (AIN-93G diet, per kg): calcium carbonate anhydrous, 357 g; potassium phosphate monobasic, 196 g; potassium citrate tripotassium monohydrate, 70.78 g; potassium sulfate sodium chloride, 74 g; magnesium oxide, 24 g; ferric citrate, 6.06 g; zinc carbonate, 1.65 g; sodium metasilicate, 1.45 g; manganese carbonate, 0.63 g; cupric carbonate, 0.30 g; chromium potassium sulfate, 0.275 g; boric acid, 81.5 mg; sodium fluoride, 63.5 mg; nickel carbonate, 31.8 mg; lithium chloride, 17.4 mg; sodium selenate anhydrous, 10.25 mg; potassium iodate, 10.0 mg; ammonium paramolybdate, 6.66 mg; powdered sucrose, 221.026 g.
3)Vitamin mixture (AIN-93G diet, per kg): nicotinic acid, 3.0 g; ca pantothenate, 1.6 g; pyridoxine HCl 0.7 g; thiamine HCl, 0.6 g; riboflavin 0.6 g; folic acid, 0.2 g; biotin, 0.02 g; vitamin B12, 2.5 g; vitamin E, 15.0 g; vitamin A, 0.8 g; vitamin D3, 0.25 g; vitamin K-1, 0.075 g; powdered sucrose, 974.655 g.
Sample preparation
After 16 wks of feeding, animals were fasted for 12 h and then anesthetized with CO2. Heart blood samples were placed in test tubes containing sodium heparin. Blood samples were centrifuged at 3,000 rpm for 15 min at 4°C, and plasma was collected. After blood sampling, livers, kidneys, spleens, thymuses, and epididymal fat pads were removed, washed with 0.9% NaCl solution, and weighed. All samples were stored at 70°C until analysis.
Glycerol-3-phosphate dehydrogenase (GPDH) activity in adipose tissue
A GPDH Assay Kit (Abcam, Cambridge, United Kingdom) was used to measure GPDH activity. Homogenized epididymal fat pads (10 mg) were mixed well with 200 μL GPDH buffer in the assay kit and centrifuged at 12,000 rpm for 5 min at 4°C. GPDH activity was determined in supernatants according to the manufacturer’s instructions. Absorbance was measured at 450 nm using a microplate reader (Molecular Devices, San Jose, CA, USA).
mRNA expressions of transcription factors related to adipocyte differentiation in liver
Total RNA isolation: Liver samples (0.2 g) were homogenized in 1 mL of TRI Reagent (Sigma Aldrich) and held for 5 min at room temperature (RT). Chloroform (200 μL; Sigma Aldrich) was added, shaken vigorously, allowed to stand for 3 min at RT, and centrifugated at 13,500 rpm for 45 min at 4°C. Isopropanol (500 μL) was then added to supernatants, mixed, allowed to stand for 10 min at RT, and centrifuged at 13,500 rpm at 4°C. After removing supernatants, RNA pellets were washed with 1 mL 75% ethanol and centrifugated at 9,500 rpm for 10 min at 4°C. Pellets were then thoroughly dried and dissolved in 50 μL RNase-free dH2O containing 0.1 mM ethylenediaminetetraacetic acid by trituration through a pipette tip. Absorbances were measured at 260 and 280 nm using a microplate reader (Molecular Devices). The purity of RNA preparations was evaluated using 260 vs. 280 nm absorbance ratios.
Reverse transcription: To obtain cDNA, total RNAs and RNase-free dH2O were added to a HiSenScript™ RH[] RT PreMix Kit (iNtRON Biotechnology, Seongnam, Korea) to 20 μL/tube. The reaction was conducted at 42°C for 30 min and 85°C for 10 min. Samples were stored at −20°C until required for further analysis.
Real-time polymerase chain reaction (PCR): After dispensing a 2 μL of cDNA into a strap tube, 6 μL of nuclease-free water, 10 μL 2X SYBR green Master mix (Applied Biosystems, Foster City, CA, USA), and 1 μL of each primer (Table 2) were added. Using Applied Biosystems StepOne software v.2.1, samples were subjected to 40 cycles of 10 min at 95°C, 15 min at 95°C, 1 min at 60°C, 15 min at 95°C, 1 min at 60°C, and 15 min at 95°C. The analysis was conducted using the ΔΔCT method.
Table 2
PCR primer sequences of transcription factors related to adipocyte differentiation and MMPs
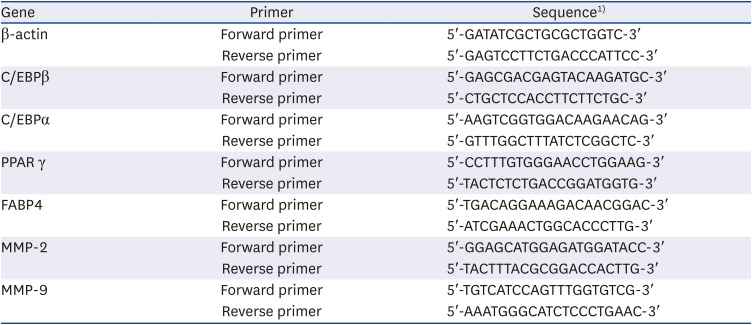
β-actin, beta-actin (control); C/EBPβ, CCAAT/enhancer binding protein β; C/EBPα, CCAAT/enhancer binding protein α; PPARγ, peroxisome proliferator-activated receptor γ; FABP4, fatty acid binding protein 4; MMP-2, matrix metalloproteinase-2; MMP-9, matrix metalloproteinase-9.
1)T, Thymine; A, Adenine; C, Cytosine; G, Guanine.
mRNA expressions and concentrations of MMPs in adipose tissues
MMPs mRNA expression: The mRNA expressions of MMP-2 and MMP-9 were determined by reverse transcription-PCR using the conditions described above for reverse transcription. The forward and reverse primers used are shown in Table 1.
The concentraion of MMPs: MMP-2 and MMP-9 levels were measured using a mouse MMP-2 enzyme-linked immunosorbent assay (ELISA) kit (MBS722437; MyBioSouce, San Diego, CA, USA) and a mouse MMP-9 ELISA kit (MBS720876; MyBioSouce), respectively. Homogenized epididymal fat pads (100 mg) were mixed well with 500 μL phosphate-buffer saline (PBS) and centrifuged at 5,000 rpm for 15 min at 4°C. Supernatants were collected, and MMP-2 and MMP-9 protein levels were determined according to the manufacturer’s instructions. Absorbances were measured at 450 nm using a microplate reader (Molecular Devices).
The concentration of active MMPs: Active MMP-2 and MMP-9 levels were measured using the MMP-2 Biotrack activity assay system kit (RPN 2631; GE Healthcare, Chicago, IL, USA) and an MMP-9 activity assay kit (QuickZyme BioScience, Leiden, Netherlands), respectively. Homogenized epididymal fat pads (100 mg) were thoroughly mixed with 1 mL 50 mM Tris-HCl buffer and centrifuged at 10,338 rpm for 10 min at 4°C. Active MMP-2 and MMP-9 levels were determined in supernatants according to the manufacturer’s instructions by measuring absorbances at 405 nm using a microplate reader (Molecular Devices).
Statistical analysis
Statistical analysis was performed using SPSS version 26 software (SPSS Inc., Chicago, IL, USA). Results are presented as means ± SEs. One-way analysis of variance and Duncan’s multiple range test were used to determine the significance of intergroup differences. Statistical significance was accepted for P-values < 0.05.
RESULTS
Body weights, food intake, and organ weights
Mean initial mouse weights in the four groups were not significantly different. After 12 wk of feeding with the experimental diets, mean body weights were significantly different in the ND and HFD groups (P < 0.05) (Fig. 1, Table 3). Final mean body weights at 16 wk in the ND, HFD, HFQ0.05, and HFQ0.15 groups were 35.0 ± 1.6 g, 40.7 ± 0.9 g, 37.4 ± 1.2 g, and 35.9 ± 1.0 g, respectively, and body weights in the HFD and HFQ0.05 groups were significantly different (P < 0.05). Weight gains in the ND, HFQ0.05, and HFQ0.15 groups were significantly less than in the HFD group (P < 0.05) (Table 3). However, mean dietary intakes in the HFD and HFQ0.15 groups were significantly less than in the ND group, and food efficiency ratios (FER) in the ND, HFQ0.05, and HFQ0.15 groups were significantly lower than in the HFD group (P < 0.05).
Fig. 1
Body weight changes in the experimental groups.
Lines represent mean weights ± SEs of the experimental groups. Five-wk-old C57BL/6J mice (Daehan Biolink) were randomly allocated to 4 experimental groups: normal fat diet (ND); high fat diet (HFD); high fat diet + quercetin 0.05% (HFQ0.05); and high fat diet + quercetin 0.15% (HFQ0.15).
NS, no significant intergroup difference.
Different symbols above lines for each wk indicate significant intergroup differences at P < 0.05 as determined by Duncans multiple range test.
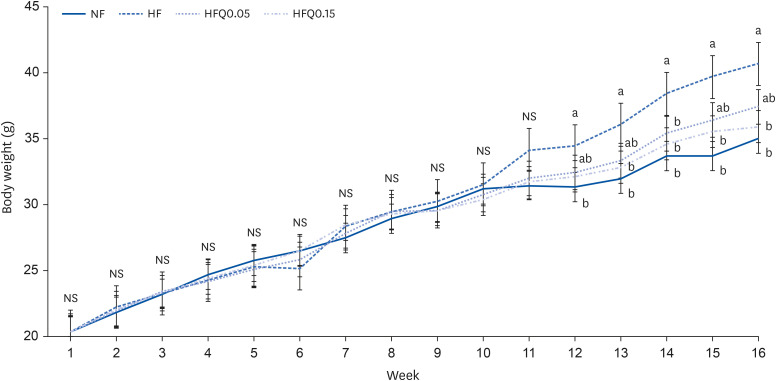
Table 3
Body weights, body weight gains, dietary intakes, and FER of the experimental groups
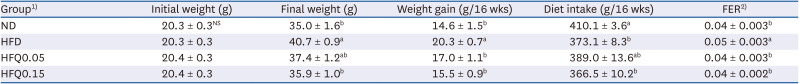
Values are presented as means ± SEs.
FER, food efficiency ratio; NS, not significant.
1)ND, normal fat diet; HFD, high fat diet; HFQ0.05, high fat diet + quercetin 0.05%; HFQ0.15, high fat diet + quercetin 0.15%.
2)FER = Body weight gains during 16 wks (g)/Dietary Intake during 16 wks (g).
Significance was determined using Duncans multiple range test (P < 0.05) (a > b).
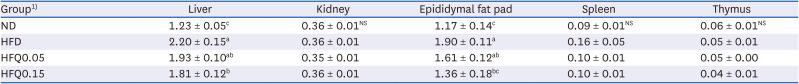
Mean liver weights were significantly lower in the ND, HFQ0.05, and HFQ0.15 groups than in the HFD group, and mean epididymal fat pad weights were significantly lower in the ND and HFQ0.15 groups than in the HFD group (P < 0.05) (Table 4). Mean kidney, spleen, and thymus weights were not significantly different in the experimental groups.
Table 4
Mean organ weights in the experimental groups (g)
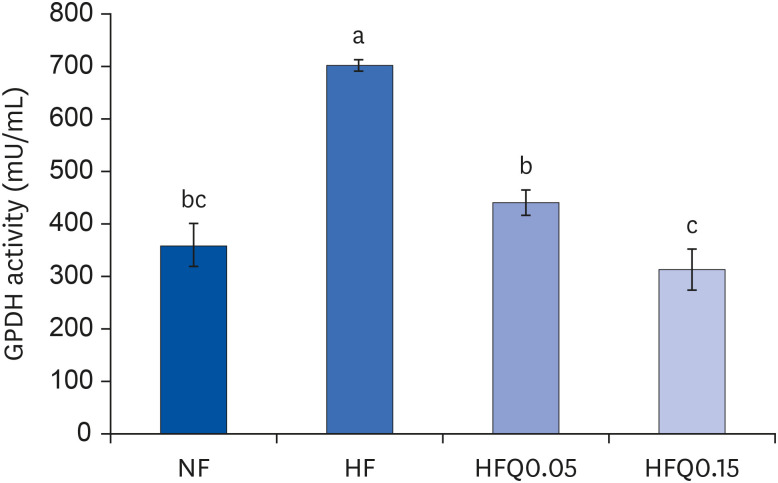
GPDH activity assay
The effect of quercetin intake on triglyceride accumulation in epididymal fat pads was also investigated. GPDH activity was significantly lower in the ND, HFQ0.05, and HFQ0.15 groups than in the HFD group (P < 0.05) (Fig. 2).
Fig. 2
Effect of 16 weeks of quercetin administration on GPDH activity in adipose tissues.
Bars represent means ± SEs of the experimental groups. Five-wk-old C57BL/6J mice (Daehan Biolink) were randomly allocated to 4 experimental groups:normal fat diet (ND); high fat diet (HFD); high fat diet + quercetin 0.05% (HFQ0.05); and high fat diet + quercetin 0.15% (HFQ0.15).
GPDH, glycerol-3-phosphate dehydrogenase.
Different letters above bars indicate significant intergroup differences at P < 0.05 as determined by Duncans multiple range test.
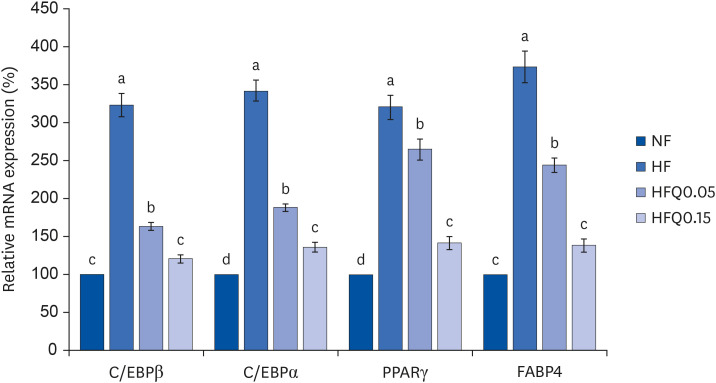
mRNA expressions of transcription factors related to adipocyte differentiation
mRNA expressions of hepatic C/EBPβ, C/EBPα, PPARγ, and fatty acid-binding protein 4 (FABP4) were significantly lower in the ND, HFQ0.05, and HFQ0.15 groups than in the HFD group, and quercetin was found to have a concentration-dependent inhibitory effect (P < 0.05) (Fig. 3).
Fig. 3
Effects of 16 weeks of quercetin administration on the mRNA expressions of transcription factors related to adipocyte differentiation in the liver.
Total RNA was isolated using TRI-Reagent, and cDNA was synthesized using SuperScript II reverse transcriptase from total RNA. Real-time PCR with SYBR Green was performed using standard procedures to assess the mRNA expressions in liver samples obtained from each group. β-Actin levels were used to ensure equal loadings. Applied Biosystems StepOne software v2.1 was used. Bars represent means ± SEs of the experimental groups. Five-wk-old C57BL/6J mice (Daehan Biolink) were randomly allocated to 4 experimental groups: normal fat diet (ND); high fat diet (HFD); high fat diet + quercetin 0.05% (HFQ0.05); and high fat diet + quercetin 0.15% (HFQ0.15).
PCR, polymerase chain reaction; C/EBPβ, CCAT/enhancer-binding protein β; C/EBPα, CCAT/enhancer-binding protein α; PPARγ, peroxisome proliferator activated receptor γ; FABP4, fatty acid binding protein 4.
Different letters above bars indicate significant intergroup differences (P < 0.05 as determined by Duncans multiple range test).
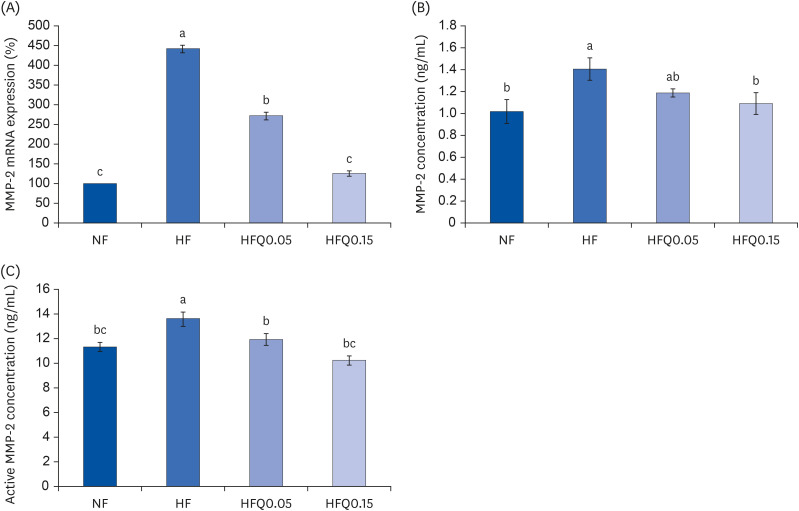
mRNA expressions and concentrations of MMPs
The mRNA expression of MMP-2 (Fig. 4A), MMP-2 concentration (Fig. 4B), and active MMP-2 concentration (Fig. 4C) in epididymal fat pads were significantly lower in the ND, HFQ0.05, and HFQ0.15 groups than in the HFD group, and quercetin had a concentration-dependent inhibitory effect (P < 0.05).
Fig. 4
Effects of 16 weeks of quercetin administration on mRNA expression, concentrations of MMP-2 in adipose tissues.
To measure the mRNA expression of MMP-2, total RNA was isolated using TRI-Reagent, and cDNA was synthesized using total RNA and SuperScript II reverse transcriptase. Real-time PCR with SYBR Green was performed using standard procedures to assess mRNA expressions in epididymal fat pad samples. (A) β-Actin levels were used to ensure equal loadings. Applied Biosystems StepOne software v2.1 was used. (B) MMP-2 protein levels were measured using the MMP-2 ELISA kit (MBS722437, MyBioSouce. (C) MMP-2 activity was measured using the MMP-2 Biotrack activity assay system kit (RPN 2631; GE Healthcare. Bars represent means ± SEs of the experimental groups. Five-wk-old C57BL/6J mice (Daehan Biolink) were randomly allocated to 4 experimental groups: normal fat diet (ND); high fat diet (HFD); high fat diet + quercetin 0.05% (HFQ0.05); and high fat diet + quercetin 0.15% (HFQ0.15).
MMP, matrix metalloproteinase.
Different letters above bars indicate significant intergroup differences (P < 0.05 as determined by Duncans multiple range test).
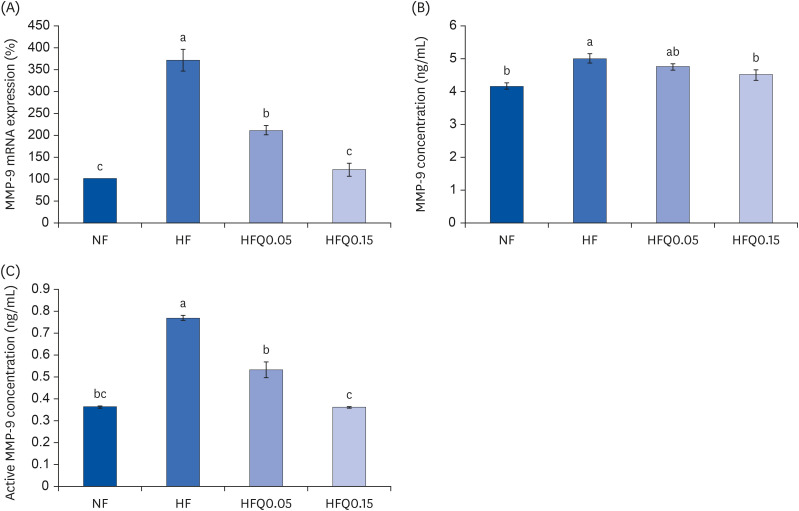
The mRNA expressions (Fig. 5A) and active MMP-9 concentration (Fig. 5C) in epididymal fat pads were significantly lower in the ND, HFQ0.05, and HFQ0.15 groups than in the HFD group, and quercetin had a concentration-dependent inhibitory effect (P < 0.05). MMP-9 levels (Fig. 5B) in epididymal fat pads were significantly lower in the ND and HFQ0.15 groups than in the HFD group (P < 0.05).
Fig. 5
Effects of 16 weeks of quercetin administration on the mRNA expression, concentrations of MMP-9 in adipose tissues.
To measure the mRNA expression of MMP-9, total RNA was isolated using TRI-Reagent, and cDNA was synthesized using total RNA with SuperScript II reverse transcriptase. Real-time PCR with SYBR Green was performed using standard procedures to determine mRNA expressions in epididymal fat pad samples. (A) β-Actin levels were used to ensure equal loadings. Applied Biosystems StepOne software v2.1 was used. (B) MMP-9 levels were measured using the MMP-9 ELISA kit (MBS720876, MyBioSource, and (C) MMP-9 activities were measured using an MMP-9 activity assay kit (QuickZyme BioScience). Bars represent means ± SEs of the experimental groups. Five-wk-old C57BL/6J mice (Daehan Biolink) were randomly allocated to 4 experimental groups: normal fat diet (ND); high fat diet (HFD); high fat diet + quercetin 0.05% (HFQ0.05); and high fat diet + quercetin 0.15% (HFQ0.15).
MMP, matrix metalloproteinase; PCR, polymerase chain reaction; ELISA, enzyme-linked immunosorbent assay.
Different letters above bars indicate significant intergroup differences at P < 0.05 as determined by Duncans multiple range tests.
DISCUSSION
Adipose tissue is highly vascularized, and each adipocyte is nourished by an extensive capillary network, and thus the growth and differentiation of adipocytes are angiogenesis-dependent [5]. During angiogenesis, secreted MMPs degrade ECM components [6] and breach the ECM barrier to promote angiogenesis-related processes such as vascular cell migration to surrounding tissues and the release of angiogenic factors [7]. Therefore, we undertook this in vivo study to determine whether quercetin inhibits adipose tissue differentiation and growth by inhibiting MMPs, which are required for angiogenesis, in an HFD-induced mouse obesity model.
Quercetin is a flavonoid with excellent antioxidant activity and is widely distributed in fruits and vegetables. In a previous study, oral administration of quercetin to rats at 500 mg/kg/day did not cause DNA damage in the stomach or liver tissues and did not induce any toxicity-associated side effects [20]. In the present study, mice were fed 0.05% or 0.15% quercetin in the HFD (46% fat) for 16 wks, and at the end of the experimental period, the mean final body weight was found to be significantly higher in the HFD group than in the ND or HFQ0.15 groups (P < 0.05). Mean weight gain was up to 39% higher in the HFD group than in the ND group and significantly higher than in the HFQ0.05 and HFQ0.15 groups (by 16.3% and 23.6%, respectively; P < 0.05). Notably, mean dietary intake was significantly lower, but weight gain was greater (P < 0.05) in the HFD group than in the ND group. In the HFD group, 46.6% of dietary energy was provided as fat, whereas in the ND group, only 16.0% of dietary energy was provided as fat.
In several animal experiments [2122232425], quercetin intake resulted in weight loss, which is consistent with our results. Moon et al. [21] reported that when onion peel extract (OPE) containing quercetin at a concentration of 276 mg/g was added to HFD at 0.36% or 0.72% (by weight) and fed to 5-wk-old Sprague Dawley rats, mean final weight was significantly lower in the control group and the OPE intake group than in the HFD group. Furthermore, dietary intake was significantly higher in the control group than in the HFD group, but dietary efficiency was significantly higher in the HFD group than in the other groups, which again is consistent with the results of our study. Porras et al. [22] found that when 7-wk-old C57BL/6J mice were provided a HFD containing 0.05% quercetin aglycone, mean body weight was significantly lower in the quercetin group than in the HFD group. Jia et al. [23] also reported that when 12-wk-old apoE C57BL/6 mice with a HFD were administered 12.5 mg/kg of quercetin in water, the mean body weight was lower than that of mice in their HFD group. Lee et al. [24] reported that when quercetin was administered at 50 mg/day orally for 12 wk to 72 Korean overweight adult men and women (body mass index [BMI] > 23 kg/m2), mean body weights, BMI, skin thicknesses, and waist, hip, and thigh circumferences were significantly decreased. The above studies and the results of this study suggest that quercetin effectively reduces body weight in experimental animals and humans. In the present study, liver and epididymal fat weights were not significantly lower in the HFQ0.05 group than in the HFD group but were significantly lower in the HFQ0.15 group (P < 0.05). Jung et al. [25] reported body weight reductions in C57B1/6 mice fed 0.025% or 0.05% quercetin in a HFD, and Porras et al. [22] reported quercetin significantly reduced liver and epididymal adipose tissue weight as compared with HFD fed rat. These results are entirely consistent with the observations made during the current study.
In this study, GPDH activity was significantly higher in the HFD group than in the ND group, and quercetin intake lowered GPDH activity as compared with the HFD group, which suggests quercetin inhibited HFD-induced triglyceride (TG) and epididymal fat weight increases (P < 0.05). GPDH activation increases triglyceride production by converting dihydroxyacetone phosphate to glycerol-3-phosphate, whereas its inhibition reduces lipid accumulation in mature adipocytes [26].
We found the mRNA expressions of all transcription factors related to adipocyte differentiation in the liver examined (C/EBPβ, C/EBPα, PPARγ, and FABP4) were more than three times higher in the HFD group than in the ND group, and quercetin administration lowered their levels dose-dependently (P < 0.05). Adipocytes differentiate from preadipocytes under the influence of transcription factors that promote adipogenesis. C/EBPβ is a transcription factor expressed during the early stages of adipogenesis and adipogenesis and promotes preadipocyte differentiation by inducing the expressions of PPARγ and C/EBPα, which affect late differentiation [272829]. In addition, PPARγ induces the expression of FABP4 [30], a widely used marker of differentiated adipocytes essential for maintaining glucose and lipid metabolisms [31]. Jung et al. [25] found that when C57BL/6J mice were fed a diet containing 0.025% of quercetin in an HFD, the expression of PPARγ mRNA in liver tissue was significantly reduced, and Porras et al. [22] reported that when C57BL/6J mice were fed a diet containing 0.05% quercetin aglycone in an HFD, the mRNA expression of C/EBPα in liver tissues was significantly reduced as compared with those in the HFD group, which is consistent with our results. This observation shows that quercetin significantly inhibited the expressions of transcription factors involved in preadipocyte differentiation from the early to late stages, which is in line with observed reductions in adipose tissue weight.
In this study, the concentration and mRNA expressions of MMP-2 and MMP-9 were increased by the HFD diet, but quercetin administration with a HFD suppressed MMP-2 and MMP-9 concentration and mRNA expressions. These results suggest that quercetin-induced reductions in body weight and adipose tissue weights are driven by inhibition of MMP-2 and MMP-9, which have essential roles in angiogenesis.
Angiogenesis often precedes adipogenesis in developing adipose tissue, and it indicates the requirement of blood vessels for tissue formation and remodeling of ECM, in which MMP-2 and MMP-9 are mainly involved, is essential for both angiogenesis and adipogenesis. Several studies confirmed that blocking the transcription factors related to adipocyte differentiation, such as C/EBPs and PPARγ, pathway in preadipocytes inhibited not only their differentiation into adipocytes but also angiogenetic factors [345]. Among the angiogenic factors, especially MMP-2 and MMP-9 were highly expressed in adipose tissue, and their expression increased significantly during adipocyte differentiation [6].
Several studies have also reported that the inhibition of MMPs reduces adipose tissue expansion and that treatment with MMP inhibitors blocks adipogenesis [32333435]. Bouloumié et al. [32] reported that human adipocytes secrete MMP-2 and MMP-9, and Bauters et al. [33] showed that knockdown of the MMP-2 gene in 3T3-F442A preadipocytes reduced their differentiation and that preadipocyte to adipocyte differentiation was promoted when MMP-2 was overexpressed. In two rat studies, HFD activated the mRNA expressions of MMP-2 in epididymal adipose tissue [34], and the treatment of obese male rats fed HFD containing lemon balm (Melissa officinalis) reduced the gene expressions of vascular endothelial growth factor A and fibroblast growth factor-2 (angiogenesis promoters in adipose tissue), the mRNA expressions of MMP-2 and MMP-9, and blood vessel densities in adipose tissues, adipose tissue weights, and bodyweights [35]. The above studies suggest that adipogenesis is suppressed by the inhibition of angiogenesis.
Although understanding the relationship between adipocyte differentiation and neovascularization in adipose tissue growth is essential, study regarding the effect of quercetin on adipogenesis and MMPs is limited to in vitro cell studies [1718]. Hong et al. [17] reported that quercetin inhibited transcription factors related to adipocyte differentiation and mRNA expression of MMP-2 and MMP-9 in 3T3-L1 cells. Song et al. [18] reported that after MMPs were activated by phorbol 12-myristate 13-acetate in 3T3-L1 cells, quercetin-treatment dose-dependently suppressed both mRNA expressions of transcription factors related to adipocyte differentiation and MMP-9 mRNA levels.
Similar to the above studies, the results of this animal study also confirmed the intake of quercetin along with a HFD resulted in decreased body weight, adipose tissue, mRNA expressions of transcription factors related to adipocyte differentiation (C/EBPβ, C/EBPα, PPARγ, FABP4) and MMPs (MMP-2 and MMP-9). In summary, the present study shows that quercetin suppresses HFD-induced weight gain and fat accumulation in adipose tissues in mice by inhibiting adipogenesis and MMPs.
 XML Download