

 PDF
PDF Citation
 Print
Print


INTRODUCTION
Rehabilitation services aim to increase patients’ independence and restore their functioning and participation in society after trauma, surgery, or disease. Rehabilitation for patients with stroke, spinal cord injury, fracture, or other physical injuries during acute or subacute periods is mainly provided to improve physical ability.1 Even in the chronic phase of central nervous system (CNS) disorders or chronic progressive diseases such as multiple sclerosis and Parkinson’s disease, rehabilitation can improve patients’ quality of life as well as functioning and independence through adaptation and compensation.23
The rehabilitation medical delivery system is a subelement of the health system. Similar to the health system, the rehabilitation medical delivery system includes service delivery, health workforce, financing, and governance as the main components. The purpose of the rehabilitation medical delivery system is to improve health equity between sex, class, and region beyond simply improving health status.4 To achieve health equity in the rehabilitation medical delivery system, the same level of rehabilitation services should be provided to those with the same need for rehabilitation (horizontal equity), and more intensive services should be provided to those with more rehabilitation needs (vertical equity).5
Healthcare disparities undermining health equity indicate that access to available medical institutions or health services varies between population groups or regions.6 In terms of consumers, it is common for people with lower socioeconomic status to have limited access to rehabilitation treatment.7 Rehabilitation service provision also has regional disparities. Some studies have shown that regions with high rehabilitation needs and regions with sufficient rehabilitation resources are different.89
South Korea (hereafter, Korea) is experiencing a rapidly aging population. Accordingly, the demand for medical services for the older population, including rehabilitation, is increasing significantly.1011121314 In addition, regions farther away from the city tend to have a higher proportion of older people and a greater need for medical services for senile diseases.15 However, since the proportion of medical institutions operated by public ownership is less than 10% in Korea, the supply of rehabilitation services is likely to be insufficient compared with the needs in regions where medical services are less profitable.16 Moreover, the supply and use of medical services in Korea are concentrated in urban areas where profitability is guaranteed. The disparity in accessibility and use of medical services, such as emergency medical care or labor and delivery services, exists between regions.1718
In Korea, rehabilitation services specialize in rehabilitative development therapy for CNS diseases, such as stroke and spinal cord injury. Such rehabilitation services were initiated by large medical institutions (tertiary and university hospitals) in large cities in Korea. Since the 2000s, the number of long-term care hospitals has increased to prepare for the aging of the population and have gradually increased their share of rehabilitation treatment providers. However, since many rural areas with a high proportion of older adults are far from large cities, it is difficult to guarantee the profitability of medical institutions. Therefore, the delivery system of rehabilitation services in Korea has a large regional disparity in service provision in response to rehabilitation needs.
In our study, a quantitative analysis was conducted to identify the regional disparities in CNS rehabilitation treatments by analyzing the differences in the use of specialized rehabilitation services between regions. Furthermore, by examining the change in regional differences in the supply of rehabilitation services from 2007 to 2017, we tried to determine the factors that hinder regional equity in the rehabilitation service delivery system.
METHODS
Study population and data
We used the administrative claims database of the National Health Insurance Service (NHIS) for 2007, 2012, and 2017. The NHIS covers the entire Korean population. Claims with procedural codes for physical therapy (PT; MM105) and occupational therapy (OT; MM114) were identified. A total of 28,319,614 inpatient and outpatient claims were submitted for the 874 hospitals that provided rehabilitation treatment in 2007, 2012, and 2017.
Outcome variables
We measured the number of hospital-based PT and OT treatments from the NHIS database separately for inpatients and outpatients in 2007, 2012, and 2017. Then, the number of treatments was aggregated depending on the administrative district (n = 229). Finally, the rates of PT and OT cases per 100,000 people were calculated by dividing the cases of administrative districts by the resident population in 2007, 2012, and 2017 and multiplying by 100,000. The resident population data of administrative districts are publicly available at Korea Statistics. As a result, the following four outcome variables were used: PT inpatients, PT outpatients, OT inpatients, and OT outpatients.
Explanatory variables
We used explanatory variables based on two area levels (administrative district and hospital service area [HSA]19). For the administrative district (N = 229), data on the deprivation index, sex ratio, and the number of people with brain disorders were included. The deprivation index was selected to consider the socioeconomic status of the district and was calculated by summing nine z-standardized items (i.e., the proportion of single-person households; the proportion of female-headed households; the proportion of households without car ownership; the proportion of households not living in an apartment; the proportion of households living below the minimum housing standard; the proportion of the population aged 35–64 with no high school diploma; the proportion of households heads aged 15–64 engaged in manual labor; the proportion of the population who were divorced, separated, or bereaved among those aged 15 or over; and the proportion of the population aged 65 or over).2021 These nine items were measured from the Population Census of Korea in 2005, 2010, and 2015. The sex ratio was assessed by dividing the number of men in each district by the number of women.22 We used the number of people with brain disorders in the district to consider the demands of PT and OT.23
For HSA (n = 55), the number of hospital beds per 1,000 people and the proportion of long-term care hospital beds were included as explanatory variables to consider the healthcare supply, and both variables were collected from the NHIS. The number of hospital beds per 1,000 people was measured using the beds of hospitals with PT and OT treatments in 2007, 2012, and 2017. We used the proportion of long-term care hospitals (LTCHs) to consider the characteristics of LTCHs. The proportion was calculated by dividing the number of LTCH beds having PT and OT per 1,000 people by the number of hospital beds per 1,000 people. If the number of hospital beds per 1,000 people was 0, we coded the proportion of long-term care hospital beds as 0. Furthermore, we included time as an explanatory variable to consider differences in treatment over time.
Statistical analysis
We performed descriptive analyses to assess the dispersion of rehabilitation treatment using interdecile range (IDR) and coefficient of variation (CV). We assessed the IDR by dividing the rates of PT and OT in the 90th percentile by those in the 10th percentile. The CV was estimated by dividing the standard deviation by the mean of the outcomes. Then, we applied univariate kernel density estimation to examine the distribution of the rates of PT and OT.24 Furthermore, we plotted graphs to show the difference in the mean rates over time. Finally, we created a choropleth map for the rates of PT and OT in the districts. Rate density was classified into nine groups according to the 0- and 8-quantile.
Furthermore, we examined the association between the explanatory variables and outcomes. To consider both the correlation of outcomes over time and overdispersion, we used multiple random intercept negative binomial regression using the menbreg command in STATA (Stata Corp., College Station, TX, USA).25 Results from the association analyses are presented as a rate ratio (RR) with 95% confidence intervals (CIs). All statistical analyses were performed using STATA/MP 17.0 (Stata Corp.).
RESULTS
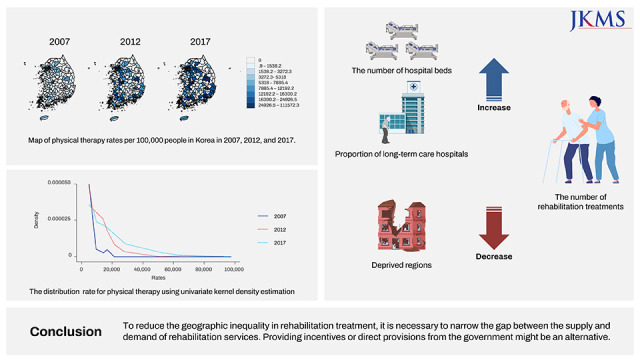
Fig. 1 shows the trends of the mean rates for PT and OT. The mean rate of PT inpatients rapidly increased from 2,390.3 to 13,541.3 in the 2007–2017 period, while that of the other outcome variables slightly increased. The rates of PT inpatients and outpatients were more dispersed than those of OT inpatients and outpatients (Fig. 2). Furthermore, the CVs and IDRs of PT inpatients and outpatients decreased more than those of OT inpatients and outpatients over time (Table 1). For example, the CVs of PT inpatients were reduced by approximately 0.5, but those of OT inpatients decreased by approximately 0.2 from 2007 to 2017. Fig. 3 shows the maps of the rates for PT and OT. Among 229 districts, there were no rehabilitation treatments administered in 70–100 districts during the 2007–2017 period. All rates were concentrated in the Seoul Capital Area and other metropolitan cities.
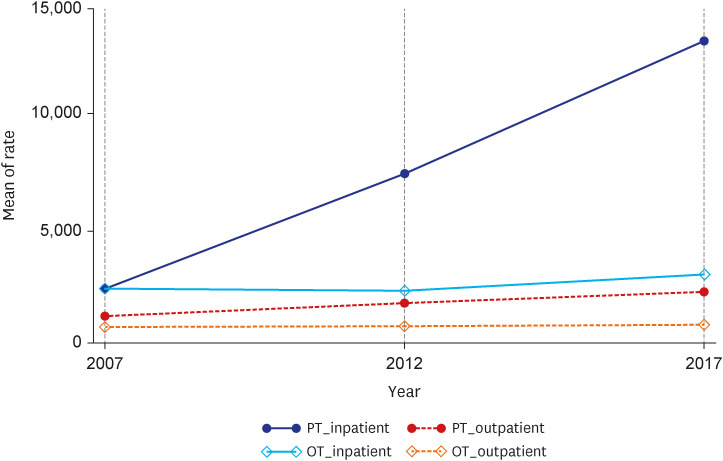
Fig. 2
The distribution rate for PT and OT using univariate kernel density estimation.
PT = physical therapy, OT = occupational therapy.
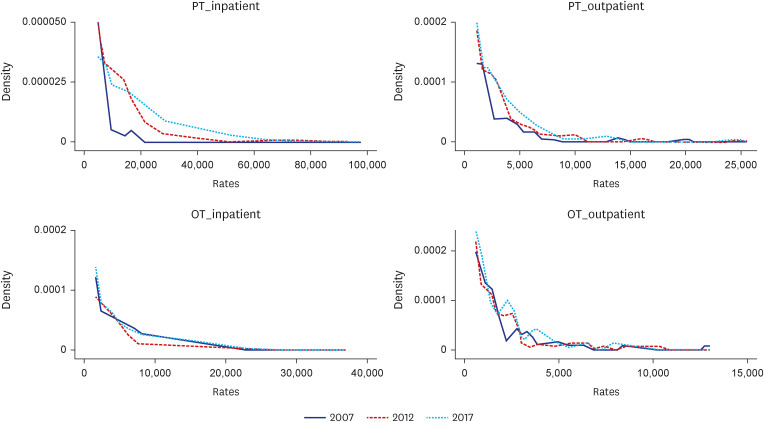
Table 1
Variation statistics for the number of physical therapy rate and occupational therapy rate depending on administrative districts from 2007 to 2017
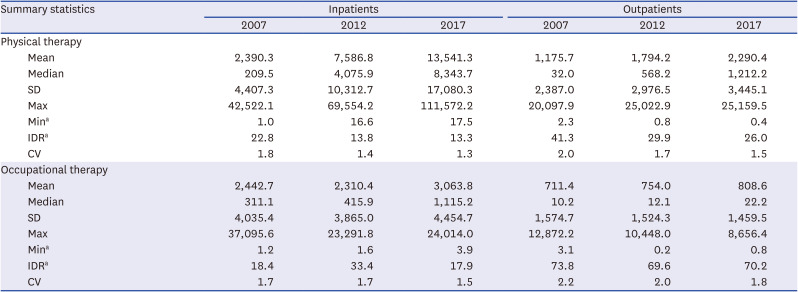
Fig. 3
Map of PT and OT rates per 100,000 people in Korea from 2007 to 2017.
PT = physical therapy, OT = occupational therapy.
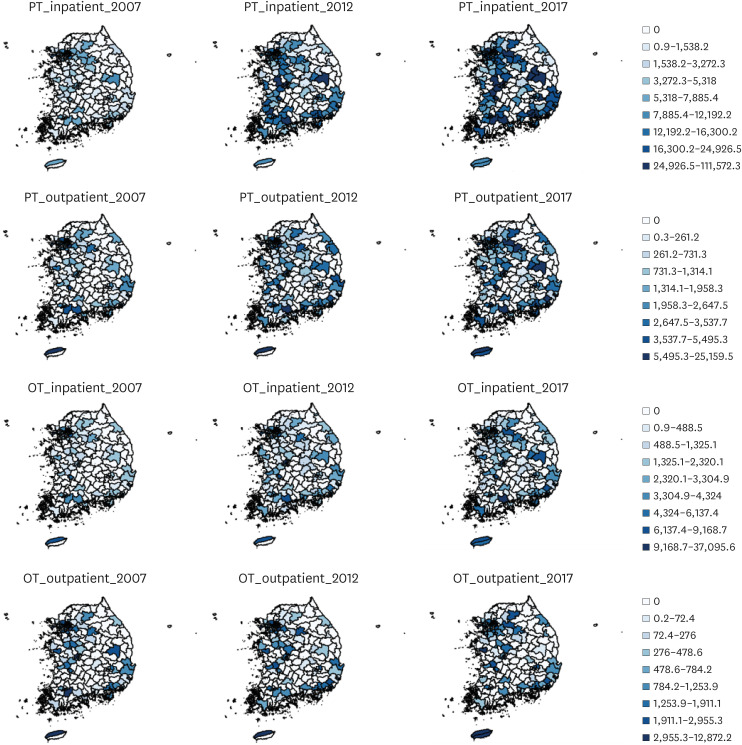
Table 2 summarizes the results of the relationship between the explanatory variables and rates of PT and OT (Model 1). There was a statistically significant relationship between the district-level variables (i.e., sex ratio, the number of people with brain disorders, and deprivation index) and all rates, except PT inpatients. For PT inpatient rates, a 1-unit increase in the deprivation index score was related to a 10% reduction in the rate (RR, 0.90; 95% CI, 0.85–0.95; P < 0.001). Furthermore, a positive association was observed between the number of hospital beds per 1,000 people and the rates of PT inpatients (RR, 1.38; 95% CI, 1.15–1.67; P = 0.001), PT outpatients (RR, 1.44; 95% CI, 1.17–1.76; P < 0.001), OT inpatients (RR, 2.27; 95% CI, 1.72–3.00; P < 0.001), and OT outpatients (RR, 3.30; 95% CI, 2.41–4.50; P < 0.001).
Table 2
The results of multiple random intercept negative binomial regression for physical therapy and occupational therapy from 2007 to 2017
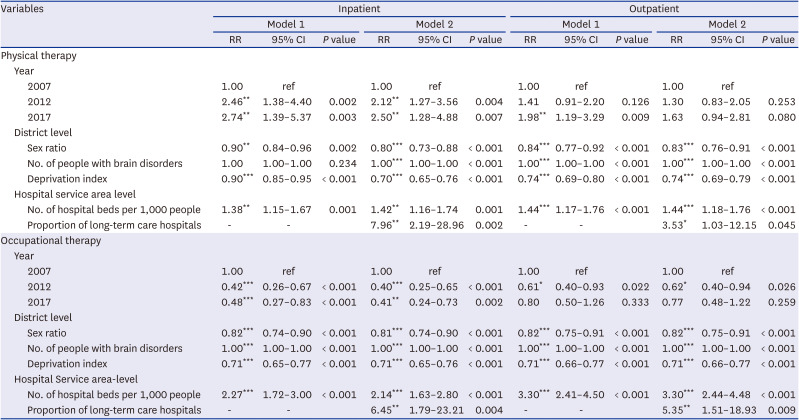
The observed relationships were attenuated but remained significant when we additionally included the proportion of LTCHs (Model 2). Furthermore, the proportion of LTCHs was significantly associated with the rate of PT inpatients (RR, 7.96; 95% CI, 2.19–28.96; P = 0.002), PT outpatients (RR, 3.53; 95% CI, 1.03–12.15; P = 0.045), OT inpatients (RR, 6.45; 95% CI, 1.79–23.21; P = 0.004), and OT outpatients (RR, 5.35; 95% CI, 1.51–18.93; P = 0.009).
DISCUSSION
The results of this study demonstrated geographic variation in the rates of PT and OT in Korea from 2007 to 2017. Both PT and OT were concentrated in the Seoul Capital Area and other metropolitan cities. Except for OT inpatients, the mean PT and OT rates increased from 2007 to 2017. The mean PT rate in 2007 was relatively similar to that of OT in 2007; however, the mean PT rate was more than twice that of OT in 2017. More than 30% of the districts had no treatment for rehabilitation, and the dispersion of PT was reduced more than that of OT from 2007 to 2017. Furthermore, PT and OT were negatively related to sex ratio and deprivation index and positively associated with the number of people with brain disorders, the number of hospital beds per 1,000 people, and the proportion of LTCHs. The differences in trends between inpatient and outpatient treatments were consistent with those of a previous study in Korea.26
The results showed that the number of treatments for inpatients was higher than that for outpatients and that the gap increased over the years. From the perspective of healthcare users, long-term hospitalization is possible for inpatient rehabilitation treatment because Korea does not have a systematic transfer plan in the medical rehabilitation delivery system. In most high-income countries, such as the United States, Canada, Singapore, and Spain, the mean length of stay of patients with stroke is up to 60 days, but the hospitalization period in Korea is longer than 100 days.27 From the perspective of service providers, there is no incentive to provide outpatient rehabilitation services because rehabilitation in inpatient facilities is more profitable and easier to implement than outpatient rehabilitation. However, it is necessary to prevent social hospitalization as much as possible and facilitate the provision of rehabilitation services through outpatient settings to lower social and economic costs.28
Another characteristic of the supply of rehabilitation services in Korea is that PT accounts for a larger proportion than OT. In Korea, PT service can be provided to almost all patients with CNS disorders, such as stroke and spinal cord injury. However, in the case of OT, service provision is only possible for people with a certain level of cognitive function. Therefore, in terms of management costs, PT is more advantageous than OT. In addition, because the supply of rehabilitation treatment is concentrated in large cities where profitability is guaranteed, one-third of the regions do not provide OT at all if they are far away from large cities (Fig. 3).
To fulfill the supply of unmet OT demand, it is necessary to provide incentives for OT service providers. In Japan, with the introduction of the Kaifukuki Rehabilitation Ward system in stroke rehabilitation in 2000, rehabilitation treatment service providers can freely provide services within the range of 3 hours a day among PT, OT, and speech therapy.2930 In Korea, a rehabilitation treatment system for long-term care and maintenance periods was introduced in 2020, providing room to improve the supply of OT services. However, in areas where profitability is not guaranteed, direct provision by public providers can be a plausible alternative.
We also investigated the factors that might influence the number of treatments and observed the following. First, districts with a higher sex ratio reported a higher number of treatments for both PT and OT. These results were inconsistent with the findings from a previous meta-analysis examining the association between sociodemographic factors and outpatient cardiac rehabilitation, which reported that females were less likely to attend rehabilitation than males.31 However, this inconsistency could be based on the sex ratio. For example, Geoje-si, an industrial city, or Dong-gu, Ulsan, an area where there is a concentration of troops, had higher sex ratios in the study. This implied that a district with a higher sex ratio might mean that there were relatively more young and healthy men; therefore, these districts showed a lower number of treatments.
Second, there was a positive association between the number of people with brain disorders and PT and OT treatments. The number of patients with brain disorders could indicate the need for rehabilitation treatment. Moreover, a qualitative study reported that people with cerebral palsy need rehabilitation treatments.32 Thus, districts requiring rehabilitation treatment were more likely to receive treatment. However, considering the number of districts where rehabilitation services are not provided, other important factors might enable the increase in the number of treatments, such as the number of hospitals and beds.
Third, districts with low socioeconomic status reported fewer rehabilitation treatments. Enabling factors refer to factors that affect access to services when a person has a desire for medical services and include income, individual and family resources, and social relationships.33 Socioeconomic status has been considered one of this enabling factors34 because regional socioeconomic status might be a barrier to rehabilitation accessibility.35 Although there is universal health insurance in Korea, more hospital beds could be supplied to advantageous areas with higher purchasing power rather than to areas with medical needs.36 Thus, the districts with low socioeconomic status could have a lack of hospital beds because the regions are not attractive areas for establishing hospitals.
Finally, a positive association was observed between the number of hospital beds and rehabilitation treatments, and the results are consistent with those of previous studies.353738 For example, a cohort study of 4,096 patients undergoing cardiac rehabilitation in the US reported that people who lived farther from rehabilitation centers were less likely to participate in rehabilitation programs.35 According to a scoping review about unmet needs for rehabilitation, the absence of rehabilitation service centers and the distance to the service centers were found to be major barriers for availing rehabilitation treatment.37 Furthermore, our results also showed that the proportion of long-term care facilities was positively related to the number of treatments. The increase in the supply of rehabilitation treatment in proportion to the increase in the number of beds in Korea for 10 years from 2007 to 2017 is related to the expansion of LTCHs. According to the Korean Ministry of Health and Welfare, the number of residential LTCHs has increased from 593 in 2007 to 1,422 in 2017, and LTCH beds accounted for approximately 36.9% of the total hospital beds in 2017.3940 Currently, LTCHs are a major rehabilitation treatment provider for patients with stroke in Korea, accounting for 48% of the total inpatient rehabilitation provision in 2017.27
This study has some limitations. First, we could not consider the personal factors that might be related to the number of rehabilitation treatments because this study was based on regional units. Furthermore, the association between these factors and the number of rehabilitation treatments could not be represented at the individual level. Second, there were unmeasured confounders, including the gross regional domestic product (GRDP). For instance, we could not include GRDP for analysis because GRDP was only measured in units in 2017. However, we used the deprivation index as a proxy for regional socioeconomic status. Third, we could not restrict the study population to those who required rehabilitation treatment. Therefore, the geographic dispersion of rehabilitation reported in the study might not reflect the regional distribution of unmet rehabilitation needs. However, we considered the potential demand factors, including people with brain disorders, to consider the need for treatment. Furthermore, the results might be interpreted as inequality of rehabilitation, considering that more than half of the districts had no rehabilitation treatments. Future studies should be conducted on individuals who require rehabilitation. Finally, the results of the study could not represent the total amount of OT because the ‘MM114’ procedural code for the activities of daily living training used in this study referred to training for community reintegration rather than the total amount of OT for patients with CNS disorders.
Despite these limitations, the findings of this study are valuable because we investigated the geographical dispersion of rehabilitation and its trends over time. To the best of our knowledge, this is the first longitudinal study to investigate the geographic distribution of CNS rehabilitation treatment using a nationally representative administrative dataset in Korea.
 XML Download