

 PDF
PDF Citation
 Print
Print


INTRODUCTION
Paraspinal muscles generally refer to muscles around the vertebral body, such as multifidus, erector spinae, quadratus lumborum, and psoas major.1 Among these, the multifidus and erector spinae muscles, the primary extensors of the lumbar spine, play an important role in maintaining global spinal alignment.23 Previous studies reported that the quality of paraspinal muscle could be one of the various factors that influence spinal sagittal balance.45 Furthermore, some studies reported increased fatty infiltration (FI) of paraspinal muscle is associated with low back pain and progression of other thoracolumbar pathologies.678
When conservative treatment for degenerative lumbar disease fails, surgical treatment is considered. The traditional and most used surgical technique is decompressive laminectomy using the posterior midline approach, and lumbar interbody fusion and posterior instrumentation are also considered depending on the disease severity.9 Decompressive laminectomy demonstrates good clinical outcomes, such as acceptable fusion and low complication rates. However, it causes iatrogenic injury to the paraspinal musculature during the surgical approach, disrupting the posterior tension band and thus leading to complications such as postoperative lower back pain or segmental instability.10
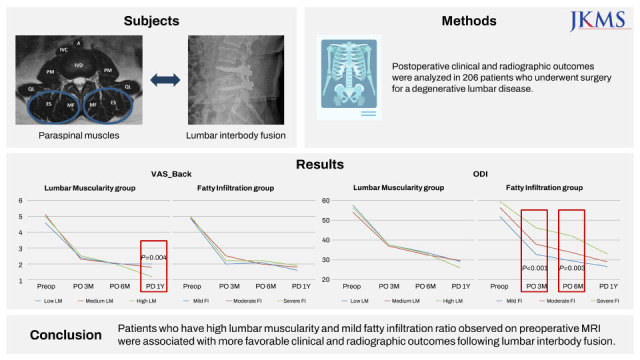
Furthermore, the paraspinal muscle plays an important role in the overall balance of the lumbar spine; therefore, the preoperative condition of the paraspinal muscles is thought to affect the clinical and radiographic outcomes of lumbar interbody fusion. However, most studies on the relationship between paraspinal muscle atrophy and spinal surgery focused on the extent of atrophy before and after surgery.11121314 Therefore, this study aimed to analyze the relationship between preoperative paraspinal muscle condition, including lumbar muscularity (LM; represents muscle quantity), FI (represents muscle quality), and the outcome of lumbar interbody fusion. We hypothesized that lower LM and more severe FI observed on preoperative magnetic resonance imaging (MRI) induce more negative postoperative clinical and radiographic outcomes.
METHODS
Study design and patient population
A retrospective review of 206 consecutive patients with degenerative lumbar diseases was conducted. All patients underwent posterior lumbar interbody fusion (PLIF) or minimally invasive transforaminal lumbar interbody fusion (MITLIF) between January 2011 and February 2019. All surgeries were performed by single orthopedic spinal surgeons. Inclusion criteria were: 1) age 50–80 years; 2) clinical manifestations and physical examinations consistent with degenerative lumbar disease refractory to > three months of conservative treatment; and 3) spinal stenosis or low-grade spondylolisthesis. Exclusion criteria were: 1) long-level fusion of > three levels; 2) history of previous lumbar surgery; 3) other pathological conditions such as fracture, infection, or tumor; and 4) no follow-up for > 1 year.
Surgical procedure
All patients were placed in a knee-flexed prone position on the Jackson spine table under general endotracheal anesthesia. The PLIF surgery was performed using pedicle screw fixation and implantation of the autologous bone in intervody cages, as described in our corresponding author’s previous study.15 MITLIF was performed through surgical microscopic visualization using a tubular retractor system (METRx system; Medtronic Sofamor Danek, Memphis, TN, USA). After making a surgical incision and setting the tubular retractor system, the surgical process for MITLIF was performed according to the description by Schwender et al.16 In addition, autogenous laminectomized local bones were grafted into the disc space, and bilateral pedicle screw fixation was performed.
Measured data
Clinical outcomes included functional status measured using the Oswestry disability index (ODI) and visual analog scale (VAS) score for lower back and leg pain. Other radiographic outcomes included measures of spinal alignment, including lumbar lordosis (LL), pelvic tilt, sacral slope, pelvic incidence, C7 sagittal vertical axis (C7SVA), and pelvic incidence-LL mismatch. All measured data were collected preoperatively and 3, 6, and 12 months postoperatively. In addition, interbody fusion was confirmed 1-year postoperatively using three-dimensional computed tomography (CT).
Lumbar muscularity and fatty infiltration
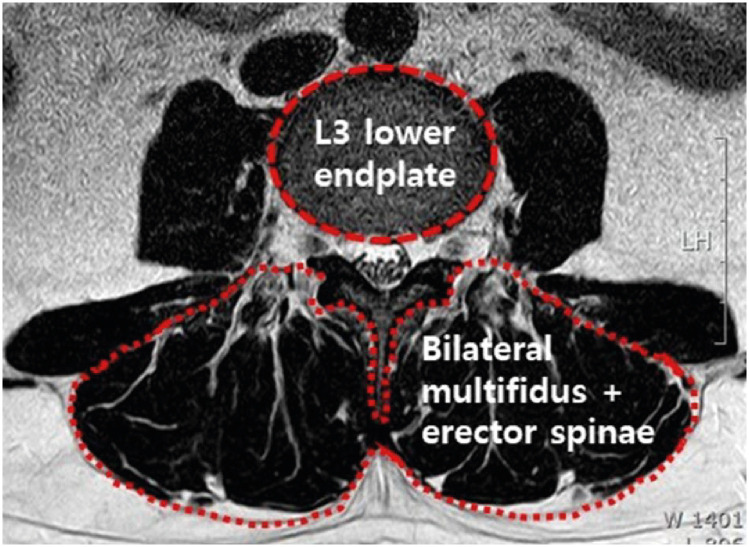
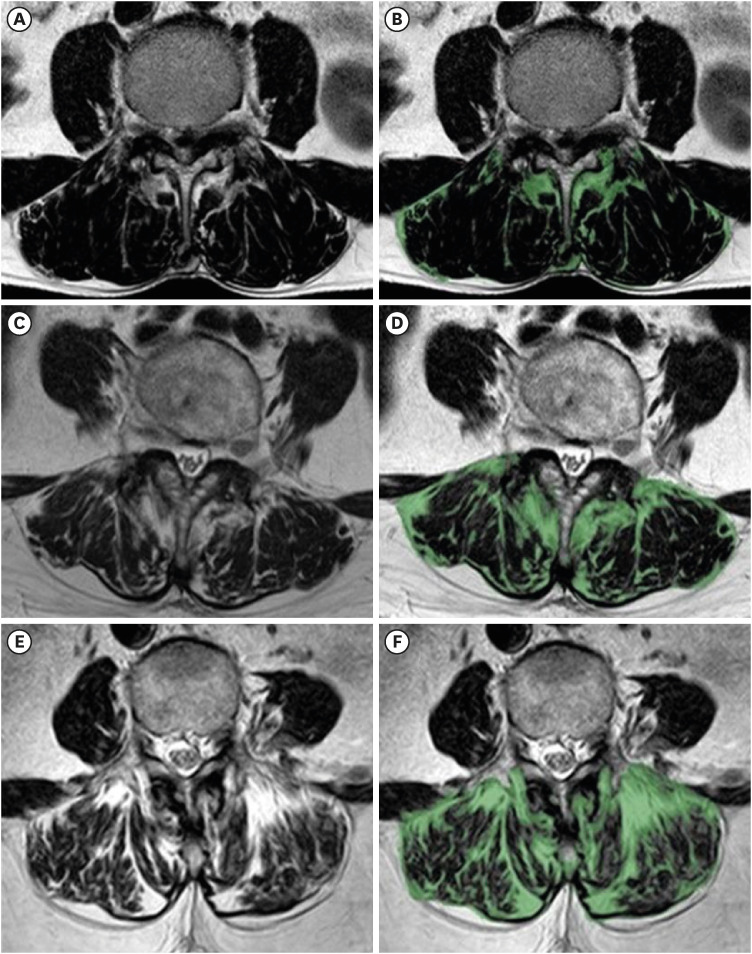
LM and FI were measured preoperatively using T2-weighted axial MRI of the lumbar spine (1.5-T Philips Achieva [Best, The Netherlands], slice thickness: 3–4 mm, slice gap: 0.3–0.4 mm). LM indicates the muscle quantity and is measured according to the description in a previous study.4 LM was measured by dividing the cross-sectional area (CSA) of bilateral multifidus and erector spinae muscle by the CSA of L3 lower endplate to correct for individual differences in body size (Fig. 1). FI indicates the muscle quality and is measured as the ratio of the FI area among the total CSA of both multifidus and erector spinae muscle at L3 lower endplate level (Fig. 2). Measurement of these parameters involved the images being transferred into image-processing software (AVIEW Research, Coreline Soft, Co. Ltd, Seoul, Korea). Two spinal surgeons from the orthopedic surgery department assessed the data measurements. The intraobserver reliability of LM & FI was assessed using the values measured by one examiner, who performed the reassessment 2 weeks later. The interobserver reliability of each parameter was evaluated with an intraclass correlation coefficient (ICC).
Subgroup analysis
All patients were analyzed by dividing them into subgroups according to the preoperative LM and FI. Patients with LM of < 300, 300–400, and > 400 were classified into the low, medium, and high LM groups, respectively. In addition, based on the existing studies of Faur et al.,17 patients were divided into three groups according to FI. Patients with FI of ≤ 30%, 30–50%, and > 50% were classified into mild, moderate, and severe FI groups, respectively (Fig. 2). Clinical and radiographic outcomes were analyzed and compared between the groups.
Statistical analysis
The Chi-square and Fisher’s exact tests were used to analyze demographic data between groups. Analysis of variance was used to analyze clinical outcomes according to groups and significant differences obtained using Tukey post-hoc. The correlations between LM and FI were analyzed using the Pearson correlation coefficient, and multiple linear regression analysis was used to generate linear regression models. The ICC with 95% confidence interval (CI) was used to analyze interobserver reliability of the LM and FI among two observers. The intra- and interobserver reliability was evaluated using the two-way random effects model assuming a single measurement and absolute agreement. SPSS 26.0 statistics software program (IBM Corp., Armonk, NY, USA) was used to perform all statistical analyses. Statistical significance was set at P < 0.05.
RESULTS
Demographic data
This study included 206 patients. When the patients were divided into groups according to LM, 54 were included in the low group, 107 in the medium group, and 45 in the high group. LM tended to be inversely proportional to age; however, no significant difference in demographic data was observed between the groups. Furthermore, when patients were divided into groups according to FI, 56 were included in the mild group, 130 in the moderate group, and 20 in the severe group. FI ratio was proportional to age, and the FI tended to be more severe in women and those with a lower bone mineral density (BMD) T-score (Table 1).
Table 1
Summary of demographic characteristics of LM and FI group
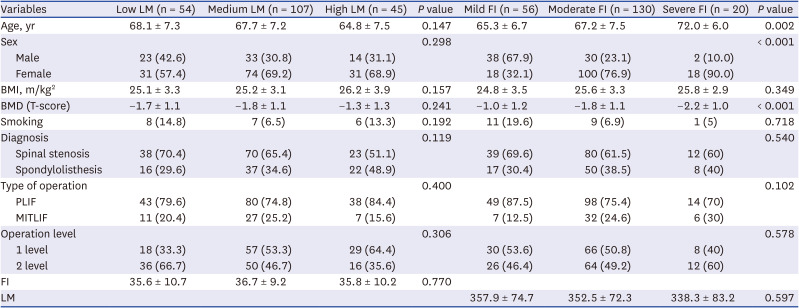
Values are presented as mean ± standard deviation or number (%). Statistical significance was set at P < 0.05.
LM = lumbar muscularity, FI = fatty infiltration, BMI = body mass index, BMD = bone mineral density, PLIF = posterior lumbar interbody fusion, MITLIF = minimally invasive transforaminal lumbar interbody fusion.
VAS score for lower back pain
In all groups, the VAS score for lower back pain improved as time passed postoperatively. The high LM group had a lower score than the low LM group 1-year postoperatively (1.2 ± 1.2 vs. 1.8 ± 1.4, P = 0.004). Furthermore, higher LM indicates more significant improvement in lower back pain (3.9 ± 1.7 vs. 3.1 ± 2.0 vs. 2.8 ± 2.0, P = 0.019). Regarding FI, the VAS score decreased postoperatively regardless of the group; however, there was no consistent tendency (Fig. 3A and B).
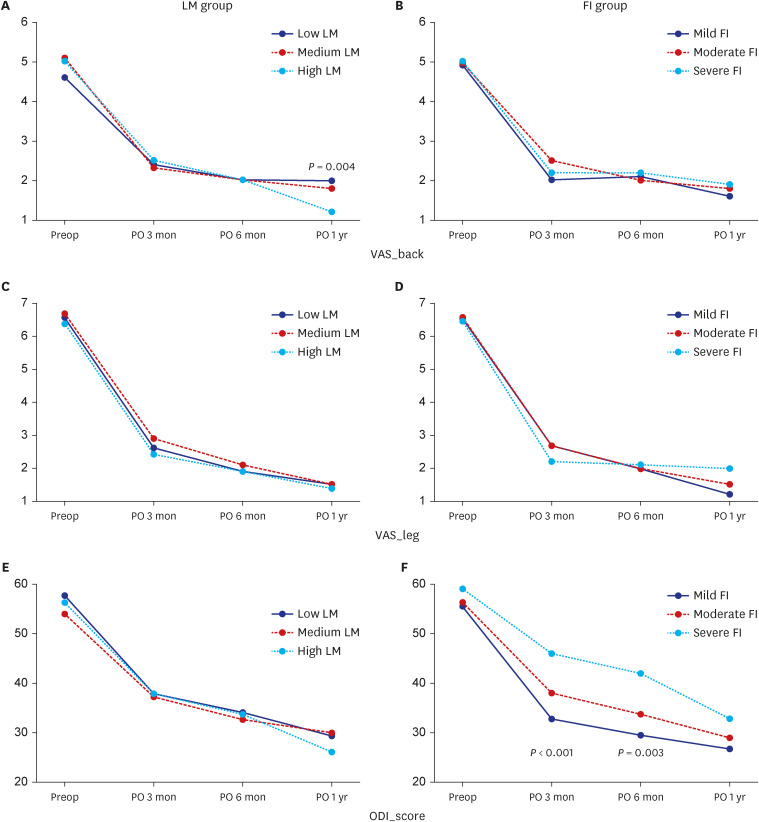
VAS score for leg pain
VAS score for leg pain improved steadily regardless of LM; however, the difference was not statistically significant. Regarding FI, mild and moderate FI groups tended to improve steadily. Furthermore, the severe FI group showed little improvement after 3 months postoperatively; however, the difference was not statistically significant (Fig. 3C and D).
ODI
All groups showed improvement in ODI postoperatively as time passed. The high LM group showed more significant improvement in ODI than the medium LM group 1-year postoperatively (30.1 ± 11.9 vs. 24.2 ± 12.1, P = 0.018). The severe FI group showed more significant improvement in ODI 3 months (46.2 ± 8.7 vs. 38.2 ± 9.7 vs. 32.9 ± 11.3, P < 0.001) and 6 months (42.1 ± 10.0 vs. 33.8 ± 11.6 vs. 29.6 ± 13.2, P = 0.003) postoperatively than other groups. The difference in ODI was larger between FI groups than between LM groups (Fig. 3E and F).
Radiographic outcomes
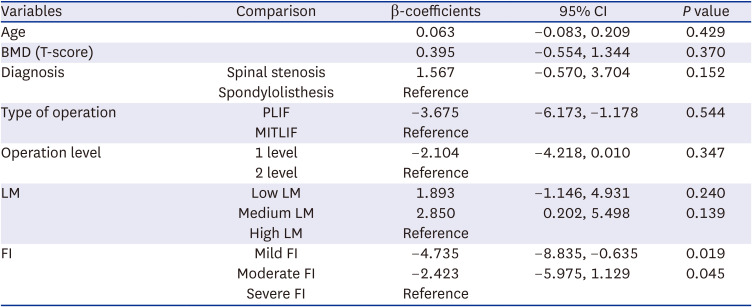
LL and sacral slope demonstrated larger values preoperatively and 1-year postoperatively in the high LM group than in the Low LM group. Furthermore, there was a significant acquirement of more LL postoperatively in the High LM group (P = 0.13; Table 2). Multivariate analysis of PI-LL mismatch revealed that mild FI was most relevant in correcting the preoperative sagittal imbalance. There was a significant improvement in PI-LL mismatch 1-year postoperatively in the mild and moderate FI groups than in the severe FI group (Table 3).
Table 2
Summary of radiographic outcomes of LM group
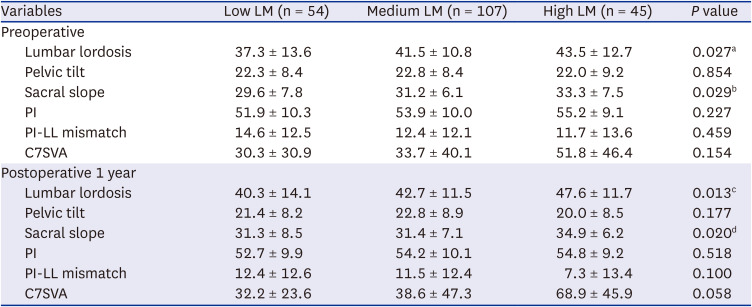
Values are presented as mean ± standard deviation. Statistical significance was set at P < 0.05.
LM = lumbar muscularity, PI = pelvic incidence, LL = lumbar lordosis, C7SVA = C7 sagittal vertical axis.
aBetween Low & High group, P = 0.029; bbetween Low & High group, P = 0.022; cbetween Low & High group, P = 0.010; dbetween Low & High group, P = 0.042, between Medium & High group, P = 0.025.
Table 3
Multivariable analysis of pelvic incidence minus lumbar lordosis mismatch
Fusion rate
In this study, Bridwell grades 1 and 2 indicated fusion 1-year postoperatively using three-dimensional CT.18 The overall fusion rate was 90.3%. There were some differences in fusion rate according to LM and FI subgroups; however, the differences were not statistically significant (LM group: 86.0% vs. 91.0% vs. 90.2%, P = 0.632; FI group: 88.2% vs. 90.2% vs. 88.9%, P = 0.927).
Reliability of measuring lumbar muscularity and fatty infiltration
The intra- and interobserver reliabilities of LM and FI showed a result of ICC 0.80 or higher. For LM, intraobserver reliability was ICC 0.915 (95% CI, 0.873–0.942), and interobserver reliability was ICC 0.899 (95% CI, 0.850–0.932). For FI, intraobserver reliability was ICC 0.956 (95% CI, 0.935–0.971), and interobserver reliability was ICC 0.920 (95% CI, 0.881–0.946).
DISCUSSION
This study evaluated the effect of preoperative lumbar paraspinal muscularity and FI on the outcome of lumbar interbody fusion. Paraspinal muscles are generally known to maintain spinal alignment,45 cause preoperative and postoperative persistent lower back pain,1920 and influence the process of several degenerative lumbar diseases.11 Furthermore, some studies reported that paraspinal muscle atrophy causes pedicle screw loosening after posterior instrumentation and adjacent segment disease.2122 Therefore, the paraspinal muscle was thought to significantly influence the outcome of lumbar interbody fusion; however, in general radiographic preoperative planning, LM and FI were not considered in many cases. Therefore, the present study was conducted.
In this study, the pararspinal muscle was evaluated by dividing it into LM (reflects muscle quantity) and FI (reflects muscle quality). Jun et al.4 evaluated lumbar paraspinal muscle quantity through LM corrected for individual body size rather than simple total muscle volume. However, this study did not suggest the validity of measuring LM. On the other hand, we analyzed the validity and reliability of measuring LM and FI, and the intra- and interobserver reliabilities of the parameters showed excellent value. Therefore, LM and FI could be considered as radiographic parameter of high agreement between measurers.
This study revealed that paraspinal muscle FI ratio was associated with old age, female sex, and lower BMD T-score, which is consistent with previous studies.2023 FI of muscle is considered the primary cause of muscle weakness, and disuse and denervation are thought to be the mechanisms.24 Old age and female sex are thought to cause muscle degeneration due to relatively lower physical activity. In addition, muscle and bone interact as a musculoskeletal unit, and the paraspinal muscle is an interacting tissue close to the lumbar vertebra used to measure BMD. Therefore, lumbar paraspinal FI and lower BMD are thought to have a close relationship.
Studies on intramuscular FI in the lumbar area and other areas in orthopedic surgery have been continuously conducted. In particular, FI progressed actively in the shoulder joint, and Goutallier et al.25 found in 1990 that FI was increased in patients undergoing rotator cuff repair surgery, and it was further classified using the Goutallier classification. Since then, many studies have reported that the FI of the rotator cuff negatively affects the outcomes of rotator cuff repair. Furthermore, a recent study on reverse total shoulder arthroplasty reported that the preoperative FI of the rotator cuff negatively affected the restoration of the postoperative range of motion.26 Regarding the knee joint, it is known that as the fatty contents of the thigh muscle increase, the knee extension power decreases, causing knee osteoarthritis.27 Another study reported that the adipose-to-muscle area ratio could predict the clinical outcome of total knee arthroplasty in older adults with osteoarthritis.28 Similar to the effects of muscle atrophy and FI in other joints, the present study also showed that lower LM and severe FI of paraspinal muscle could negatively affect clinical and radiographic outcomes of lumbar interbody fusion.
Muscle volume and FI are generally measured using the CSA when evaluating paraspinal muscle using CT or MRI.29 Regarding the shoulder, a consensus is reached with the Goutallier classification25; however, there is no standardized method regarding the spine yet. In this study, FI was classified as mild (< 30%), moderate (30–50%), and severe (> 50%), as described in the study of Cosmin Faur et al.17 Furthermore, Kjaer et al.20 classified lumbar paraspinal muscle FI into grade 0 (0–10%), grade 1 (10–50%), and grade 2 (> 50%). The intramuscular FI portion is a non-functional area that increases with age; however, core exercise can slow the change.30 Because interest in exercise therapy and sarcopenia is growing recently,831 a standardized method for evaluating paraspinal muscle is needed.
Long-term stability through solid union is essential for the successful outcome of lumbar interbody fusion. A study on the CSA of the paraspinal muscle and the fusion rate after PLIF revealed that the CSA of the psoas major muscle had a more important effect on the bone union after PLIF than the erector spinae and multifidus muscles.32 In addition, it has been reported that as lumbar paraspinal FI increases, the fusion rate decreases and is associated with pedicle screw loosening.2133 The psoas major muscle was not considered in this study, unlike previous reports; however, it was found that lumbar paraspinal muscularity and FI ratio did not significantly affect the fusion rate after lumbar interbody fusion. For better fusion rates of lumbar interbody fusion, minimizing the paraspinal muscle injury during surgery rather than the condition of the paraspinal muscle before surgery is considered more important. Recently, minimally invasive spinal surgery using a microscope or an endoscope has been attempted to reduce the approach-related complications of paraspinal muscles as much as possible.
This study had some limitations. First, this was a retrospective study. Second, anterior approaches such as anterior and oblique lumbar interbody fusions were not considered. Third, for reasons such as follow-up loss, clinical and radiographic outcomes were confirmed only approximately 1-year postoperatively. Finally, the measurement of LM and FI could not be performed at all levels of the lumbar but at only a single level of the L3 lower endplate. However, despite these limitations, this study is considered meaningful because it is a relatively large-scale study that simultaneously evaluated the quantity and quality of paraspinal muscle and the effect of preoperative LM and FI on the outcome of lumbar interbody fusion.
In conclusion, patients with high LM and mild FI ratio observed on preoperative MRI demonstrated more favorable clinical and radiographic outcomes after lumbar interbody fusion. Therefore, preoperative paraspinal muscle condition should be considered when planning lumbar interbody fusion for degenerative lumbar diseases.
 XML Download