Journal List > Nutr Res Pract > v.17(2) > 1516082200

Shim, Kim, Lee, Yoon, and Lee: Dietary zinc intake and sources among Koreans: findings from the Korea National Health and Nutrition Examination Survey 2016–2019

Abstract

BACKGROUND/OBJECTIVES

Zinc is an essential trace mineral which is important for the growth and development of the human body and immunological and neurological functions. Inadequate zinc intake may cause zinc deficiency with its adverse consequences. In this study, we aimed to estimate the dietary zinc intake levels and sources among Koreans.

SUBJECTS/METHODS

For this secondary analysis, we obtained data from the Korea National Health and Nutrition Examination Survey (KNHANES) 2016–2019. Individuals aged ≥ 1 yr who had completed a 24-h recall were included. The dietary zinc intake of each individual was calculated by applying data from a newly developed zinc content database to the KNHANES raw data. We also compared the extracted data with the sex-, age-specific reference values suggested in the Korean Dietary Reference Intakes 2020. The prevalence of adequate zinc intake was then evaluated by the proportion of the individuals who met the estimated average requirement (EAR).

RESULTS

The mean zinc intake of Koreans aged ≥ 1 yr and adults aged ≥ 19 yrs were 10.2 and 10.4 mg/day, equivalent to 147.4% and 140.8% of the EAR, respectively. Approximately 2 in 3 Koreans met the EAR for zinc, but the zinc intake differed slightly among the different age and sex groups. In children aged 1–2 yrs, 2 out of 5 exceeded the upper level of intake, and nearly half of the younger adults (19–29 yrs) and the elders (≥ 75 yrs) did not meet the EAR. The major contributing food groups were grains (38.9%), meats (20.4%), and vegetables (11.1%). The top 5 food contributors to zinc intake were rice, beef, pork, egg, and baechu kimchi, which accounted for half of the dietary intake.

CONCLUSION

The mean zinc intake among Koreans was above the recommended level, but 1 in 3 Koreans had inadequate zinc intake and some children were at risk of excessive zinc intake. Our study included zinc intake from diet only, thus to better understand zinc status, further research to include intake from dietary supplements is needed.

INTRODUCTION

The trace element zinc is essential to the human organism. It is a component of enzymes, coenzymes, and transcription factor proteins, and plays diverse roles in the growth and development of the human body and its immune and neurological functions [12]. The zinc status in the human body is maintained by zinc homeostasis through increasing the efficiency of zinc absorption and decreasing the endogenous excretion of zinc when the dietary zinc intake insufficient; however, long-term inadequate zinc intake may cause zinc deficiency [34]. Adverse health consequences follow, such as growth retardation, poor appetite, diarrhea, infection, delayed wound healing, emotional disorders, and alopecia [15]. Therefore, health professionals have recommended the dietary assessment of zinc intake as a means of estimating the risk of zinc deficiency and identifying populations at elevated risk of zinc inadequacy [6].
Along with other nutritional problems (e.g., low intake of antioxidant nutrients due to poor diet), zinc deficiency is a major public health problem in developing countries [78]. However, an inadequate intake of zinc has been observed worldwide [91011121314]. The problem with inappropriate zinc intake has different aspects depending on the age group and the specific dietary pattern. For example, concerns exist that older adults have an inadequate intake that does not meet the estimated average requirement (EAR) [9]. On the other hand, infants and children in some developed countries have a dietary zinc intake above the tolerable upper level (UL) [1114]. In addition, vegetarians have been reported to have lower dietary zinc intakes than omnivores [15].
The dietary zinc intake of Koreans has been evaluated in previous studies [16171819202122232425]. However, most of them were small-sized, involving only specific age groups [1617181920212324], or residents of a particular region [1722232425]. Moreover, the values employed to assess the zinc content used in these studies were derived from foreign databases (e.g., the U.S. Department of Agriculture food database) due to the lack of the analytical values of the zinc content of domestically consumed food; therefore, limitations have hindered the adequate estimation of the zinc intake of Koreans [182123].
Recently, the Korea Disease Control and Prevention Agency (KDCA) in charge of the Korea National Health and Nutrition Examination Survey (KNHANES) started the expansion of its existing nutrient content database for a more precise estimate of the dietary micronutrient intakes of Koreans. As a part of these important efforts, we established a database of the zinc content of foods reported to be consumed in the KNHANES 2016–2019 [26]. In this work, using this newly-constructed zinc database, we aimed to estimate the dietary zinc intakes, evaluate the dietary adequacy of zinc, and examine the dietary sources of this trace element in the diet of Koreans.

SUBJECTS AND METHODS

Study design and study population

This is a secondary analysis study, in which we used data from the KNHANES study (2016–2019). The KNHANES is a nationwide survey implemented to evaluate the health and nutrition status of Koreans aged ≥ 1 yr. Its target population comprises non-institutionalized Korean citizens. The KNHANES consist of a health interview, a health examination, and a nutrition survey. More details have been provided elsewhere [2728].
Of the 31,379 participants in the KNHANES 2016–2019, a total number of 28,418 individuals, who completed the 24-h recall of the nutrition survey, were included in the present study.
In the present study, we used the raw data released by the KDCA in charge of the survey (https://knhanes.cda.go.kr, accessed on 21 November 2021). The KNHANES survey protocols and procedures were approved by the Institutional Review Board of the KDCA (2018-01-03-P-A and 2018-01-03-C-A). Written informed consent was obtained from all the participants.

Dietary assessment

The dietary intake of the participants was assessed by the 1-day 24-h recall method. Trained dietitians visited each participant’s home and gathered dietary information via an in-depth interview, including the list and amount of food and beverages consumed on the previous day. If a composite dish (e.g., bibimbab) was consumed, the food intake of each ingredient was estimated using the recipe. Then, the nutrient intake from the foods they consumed was calculated using the data in the nutrient content database for each food [2930]. The KNHANES raw data contained the dietary intake of energy, macro- and micronutrients, including minerals and vitamins. However, the raw data contained no information on the dietary zinc intake, because no data was available on the zinc content of the food consumed by participants. More details on the 24-h recall method implemented in the KNHANES are available elsewhere [2731].

Establishment of a zinc content database and estimation of the dietary zinc intake

To estimate dietary zinc intake of Koreans using the KNHANES data, we established a database of the zinc content of each food which the participants in the KNHANES consumed [26]. For the establishment of the zinc content database, we first set the principles for the data sources to be used, the priorities, and the application of substitute values, considering the guidelines for the production, management, and use of food composition data suggested by Greenfield and Southgate [32] and the Food and Agriculture Organization and International Network of Food Data Systems [33]. More details on the establishment of the zinc content database are available elsewhere [26]. In brief, we collected information on the zinc content of food from all available resources, including domestic and overseas food composition tables and nutrition fact labels of processed foods [3435363738394041]. Next, we performed the following steps for the generation of the database of the food zinc content. In cases of the availability of several original analytical values obtained from various data sources for the same food, we selected the value from domestic and the latest data sources. At this stage, we took the original analytical values of the zinc content from the Korean food composition table. For foods imported from other countries, the values of zinc content in the food composition table of the country of origin were selected. The zinc content of foods with no established analytical value was replaced or calculated based on the analytical value of a similar food from domestic or foreign data sources. The zinc database which we established in the present study covered 99.83% (n = 4,207) of the foods reported in the KNHANES 2016–2019 (n = 4,214), with data obtained from domestic (n = 3,797) and foreign (n = 410) sources. The database consists of 1,447 analytical values, 466 calculated values, and 2,294 replaced values. The dietary zinc intake was calculated by applying the newly developed zinc content database to the raw data obtained by 24-h recall in the KNHANES study.

Statistical analysis

Data are expressed as mean, standard error, percentiles, and percentages, and were analyzed for the total population and by sex and age groups (≥ 1, ≥ 19, 1–2, 3–5, 6–11, 12–18, 19–29, 30–49, 50–64, 65–74, and ≥ 75 yrs).
The absolute zinc intake (mg/day) as well as the relative intake to the sex- and age-specific EAR and UL, suggested in the Korean Dietary Reference Intakes 2020 [1], was estimated. The prevalence of the adequate intake was evaluated by the proportion of participants who met the EAR. Consumption exceeding the UL was defined as excessive consumption. To investigate the major dietary sources of zinc intake, we calculated the intake from each food group and its contribution (%) to the total zinc intake. The same analysis was also performed at the individual food level (using the tertiary food code in the KNHANES raw dataset), and the top 20 individual foods for zinc intake by sex and age groups were presented.
All analyses were performed using SAS 9.4 software (SAS Institute, Cary, NC, USA). In all analyses, we considered the sampling weights and survey design of the KNHANES study. A P-value < 0.05 indicated a statistically significant difference.

RESULTS

Dietary zinc intake and prevalence of adequate intake

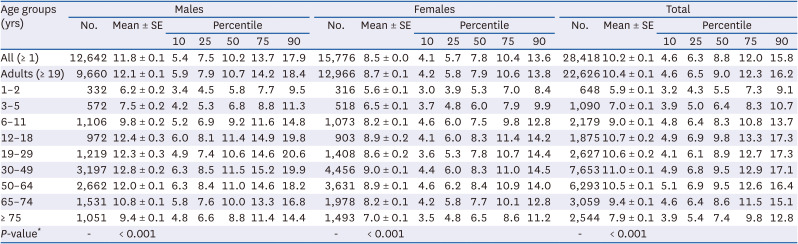
The mean values and distribution of dietary zinc intake are presented in Table 1. The mean zinc intake values of Koreans aged ≥ 1 yr and adults aged ≥ 19 yrs were 10.2 and 10.4 mg/day, respectively. Overall, males consumed more zinc than females in all age groups (P < 0.001), and adolescents and adults had a higher zinc intake than children and the elderly in both males and females (P < 0.001).
Table 1

Dietary zinc intake (mg/day) of Koreans, KNHANES 2016–2019

nrp-17-257-i001
Age groups (yrs) Males Females Total
No. Mean ± SE Percentile No. Mean ± SE Percentile No. Mean ± SE Percentile
10 25 50 75 90 10 25 50 75 90 10 25 50 75 90
All (≥ 1) 12,642 11.8 ± 0.1 5.4 7.5 10.2 13.7 17.9 15,776 8.5 ± 0.0 4.1 5.7 7.8 10.4 13.6 28,418 10.2 ± 0.1 4.6 6.3 8.8 12.0 15.8
Adults (≥ 19) 9,660 12.1 ± 0.1 5.9 7.9 10.7 14.2 18.4 12,966 8.7 ± 0.1 4.2 5.8 7.9 10.6 13.8 22,626 10.4 ± 0.1 4.6 6.5 9.0 12.3 16.2
1–2 332 6.2 ± 0.2 3.4 4.5 5.8 7.7 9.5 316 5.6 ± 0.1 3.0 3.9 5.3 7.0 8.4 648 5.9 ± 0.1 3.2 4.3 5.5 7.3 9.1
3–5 572 7.5 ± 0.2 4.2 5.3 6.8 8.8 11.3 518 6.5 ± 0.1 3.7 4.8 6.0 7.9 9.9 1,090 7.0 ± 0.1 3.9 5.0 6.4 8.3 10.7
6–11 1,106 9.8 ± 0.2 5.2 6.9 9.2 11.6 14.8 1,073 8.2 ± 0.1 4.6 6.0 7.5 9.8 12.8 2,179 9.0 ± 0.1 4.8 6.4 8.3 10.8 13.7
12–18 972 12.4 ± 0.3 6.0 8.1 11.4 14.9 19.8 903 8.9 ± 0.2 4.1 6.0 8.3 11.4 14.2 1,875 10.7 ± 0.2 4.9 6.9 9.8 13.3 17.3
19–29 1,219 12.3 ± 0.3 4.9 7.4 10.6 14.6 20.6 1,408 8.6 ± 0.2 3.6 5.3 7.8 10.7 14.4 2,627 10.6 ± 0.2 4.1 6.1 8.9 12.7 17.3
30–49 3,197 12.8 ± 0.2 6.3 8.5 11.5 15.2 19.9 4,456 9.0 ± 0.1 4.4 6.0 8.3 11.0 14.5 7,653 11.0 ± 0.1 4.9 6.8 9.5 12.9 17.1
50–64 2,662 12.0 ± 0.1 6.3 8.4 11.0 14.6 18.2 3,631 8.9 ± 0.1 4.6 6.2 8.4 10.9 14.0 6,293 10.5 ± 0.1 5.1 6.9 9.5 12.6 16.4
65–74 1,531 10.8 ± 0.1 5.8 7.6 10.0 13.3 16.8 1,978 8.2 ± 0.1 4.2 5.8 7.7 10.1 12.8 3,059 9.4 ± 0.1 4.6 6.4 8.6 11.5 15.1
≥ 75 1,051 9.4 ± 0.1 4.8 6.6 8.8 11.4 14.4 1,493 7.0 ± 0.1 3.5 4.8 6.5 8.6 11.2 2,544 7.9 ± 0.1 3.9 5.4 7.4 9.8 12.8
P-value* - < 0.001 - < 0.001 - < 0.001
KNHANES, Korea National Health and Nutrition Examination Survey.
*P-value for the differences between the age groups. P-values < 0.001 for the differences between sexes within each age group, except for the group of 1–2 yrs (0.006).
The data of the relative intake of dietary zinc to the sex- and age-specific EAR (% EAR) and the prevalence of adequate zinc intake are presented in Table 2. The values of the relative intake to the EAR for Koreans aged ≥ 1 yr and adults aged ≥ 19 yrs were 147.4% and 140.8%, respectively. The relative zinc intake was above the EAR in all groups, with differences by sex and age. In children under 5 yrs of age, the zinc intake was more than twice that of EAR, and thus deficiency was rarely observed, whereas excessive intake (exceeding the UL) was found in 41.9% of the infants aged 1–2 yrs and in 19.2% of the children aged 3–5 yrs. In adults aged ≥ 19 yrs, excessive zinc intake was very rare, less than 1%. Nearly 1 out of 3 did not meet the EAR, and this inadequate intake was more profound in females, young adults aged 19–29 yrs, and the elderly aged ≥ 75 yrs.
Table 2

Dietary zinc intake relative to the EAR and prevalence of those meeting the EAR and exceeding the UL for zinc, KNHANES 2016–2019

nrp-17-257-i002
Age groups (yrs) Males Females P-value* Total
EAR (mg) Intake (%EAR) % (≥ EAR) UL (mg) % (> UL) EAR (mg) Intake (%EAR) % (≥ EAR) UL (mg) % (≥ UL) Intake (%EAR) % (≥ EAR) % (> UL) Intake (%EAR) % (≥ EAR) % (> UL)
All (≥ 1) - 156.7 76.8 - 2.7 - 138.2 68.1 - 1.3 < 0.001 < 0.001 < 0.001 147.4 72.5 2.0
Adults (≥ 19) - 149.4 74.9 - 1.0 - 132.2 65.9 - 0.2 < 0.001 < 0.001 < 0.001 140.8 70.4 0.6
1–2 2 309.6 98.8 6 43.7 2 282.0 98.0 6 40.1 < 0.001 0.392 0.418 296.1 98.4 41.9
3–5 3 249.1 96.4 9 23.4 3 215.1 95.2 9 14.5 < 0.001 0.349 < 0.001 233.2 95.8 19.2
6–11§ 5,7 165.3 86.1 13,19 7.8 4,7 158.6 81.3 13,19 3.3 0.048 0.009 < 0.001 162.0 83.7 5.6
12–18 7,8 162.6 78.8 27,33 1.6 6,7 134.7 68.2 27,33 0.3 < 0.001 < 0.001 0.009 149.4 73.8 1.0
19–29 9 136.6 63.5 35 1.5 7 122.5 56.9 35 0.3 < 0.001 0.002 0.019 130.0 60.4 1.0
30–49 8 160.1 79.3 35 1.3 7 126.5 62.5 35 0.2 < 0.001 < 0.001 < 0.001 143.8 71.1 0.7
50–64 8 150.5 78.2 35 0.6 6 149.0 76.9 35 0.1 0.444 0.264 0.010 149.8 77.6 0.3
65–74 8 135.5 71.2 35 0.3 6 136.9 70.9 35 0.1 0.548 0.903 0.318 136.3 71.0 0.2
≥ 75 7 133.7 71.7 35 0.0 6 116.7 57.1 35 0.0 < 0.001 < 0.001 0.318 122.9 62.5 0.0
P-value - < 0.001 < 0.001 - < 0.001 - < 0.001 < 0.001 - < 0.001 < 0.001 < 0.001 < 0.001 < 0.001 < 0.001 < 0.001
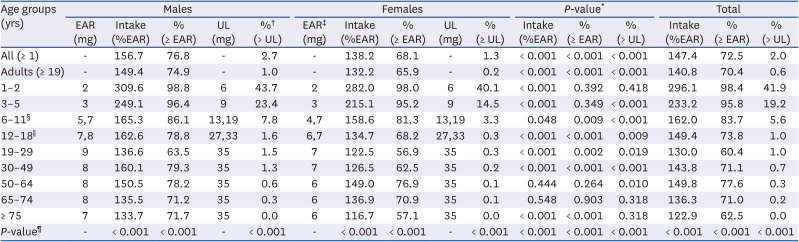
EAR, estimated average requirement; UL, tolerable upper level of intake; KNHANES, Korea National Health and Nutrition Examination Survey.
*P-value for differences between sexes.
The number of those with excessive intake exceeding the UL in some groups (65–74, ≥ 75 yrs in males; all age groups of ≥ 12 yrs in females) is less than 10.
The EAR for pregnant females is set by adding 2.0 mg/day to the EAR of the relevant age group, and 4 mg/day for breast-feeding females.
§In this group, EAR and UL were set separately for each age group of 6–8 and 9–11 yrs, respectively. For example, the EAR of boys aged 6–8 yrs was 5 mg/day and the EAR of boys aged 9–11 yrs was 7 mg/day.
In this group, EAR and UL were set separately for each age group of 12–14 and 15–18 yrs, respectively. For example, the EAR of boys aged 12–14 yrs was 7 mg/day and the EAR of boys aged 15–18 yrs was 8 mg/day.
P-value for the differences between the age groups.

Dietary sources of zinc intake

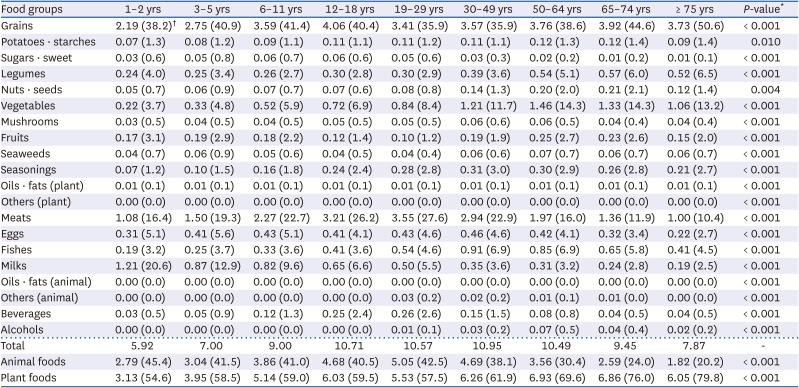
Tables 3 and 4 display data of the zinc intake from different food groups and its contribution to the total intake. In the total population, two-thirds of the total zinc intake was obtained mainly from plant-based foods. The major contributing food groups were grains (38.9%), meats (20.4%), and vegetables (11.1%). Zinc intake and its contribution differed slightly by sex and age groups, but overall, females and older individuals had relatively higher zinc intakes from plant-based foods than males and younger individuals, respectively. The analysis by age groups revealed that grains, meats, and milks accounted for more than 70% of the total zinc intake of infants and children under 11 yrs of age. In adolescents and adults, the major food groups contributing to the total zinc intake were grains, meats, and vegetables.
Table 3

Dietary zinc intake of Koreans from foods by sex, KNHANES 2016–2019
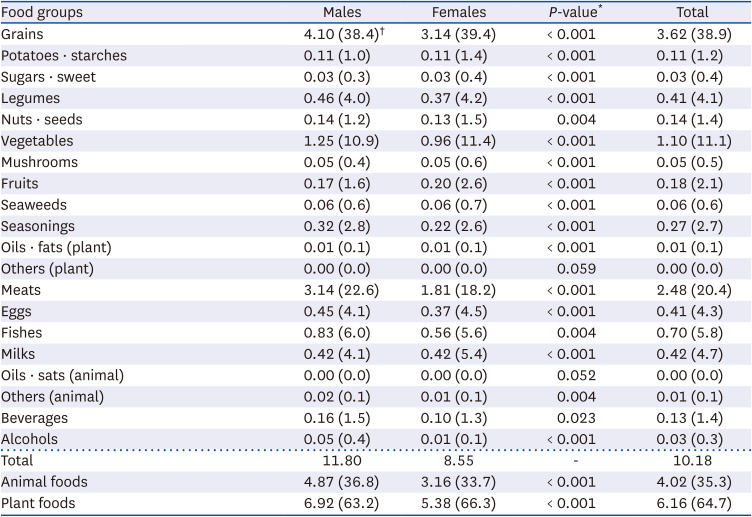
nrp-17-257-i003
Food groups Males Females P-value* Total
Grains 4.10 (38.4) 3.14 (39.4) < 0.001 3.62 (38.9)
Potatoes · starches 0.11 (1.0) 0.11 (1.4) < 0.001 0.11 (1.2)
Sugars · sweet 0.03 (0.3) 0.03 (0.4) < 0.001 0.03 (0.4)
Legumes 0.46 (4.0) 0.37 (4.2) < 0.001 0.41 (4.1)
Nuts · seeds 0.14 (1.2) 0.13 (1.5) 0.004 0.14 (1.4)
Vegetables 1.25 (10.9) 0.96 (11.4) < 0.001 1.10 (11.1)
Mushrooms 0.05 (0.4) 0.05 (0.6) < 0.001 0.05 (0.5)
Fruits 0.17 (1.6) 0.20 (2.6) < 0.001 0.18 (2.1)
Seaweeds 0.06 (0.6) 0.06 (0.7) < 0.001 0.06 (0.6)
Seasonings 0.32 (2.8) 0.22 (2.6) < 0.001 0.27 (2.7)
Oils · fats (plant) 0.01 (0.1) 0.01 (0.1) < 0.001 0.01 (0.1)
Others (plant) 0.00 (0.0) 0.00 (0.0) 0.059 0.00 (0.0)
Meats 3.14 (22.6) 1.81 (18.2) < 0.001 2.48 (20.4)
Eggs 0.45 (4.1) 0.37 (4.5) < 0.001 0.41 (4.3)
Fishes 0.83 (6.0) 0.56 (5.6) 0.004 0.70 (5.8)
Milks 0.42 (4.1) 0.42 (5.4) < 0.001 0.42 (4.7)
Oils · sats (animal) 0.00 (0.0) 0.00 (0.0) 0.052 0.00 (0.0)
Others (animal) 0.02 (0.1) 0.01 (0.1) 0.004 0.01 (0.1)
Beverages 0.16 (1.5) 0.10 (1.3) 0.023 0.13 (1.4)
Alcohols 0.05 (0.4) 0.01 (0.1) < 0.001 0.03 (0.3)
Total 11.80 8.55 - 10.18
Animal foods 4.87 (36.8) 3.16 (33.7) < 0.001 4.02 (35.3)
Plant foods 6.92 (63.2) 5.38 (66.3) < 0.001 6.16 (64.7)
KNHANES, Korea National Health and Nutrition Examination Survey.
*P-value for the differences of the contribution to the total dietary intake (%) between sexes.
The data represent the dietary zinc intake (mg/day) of each food group and the contribution to the total dietary zinc intake (%).
Table 4

Dietary zinc intake of Koreans from foods by age group, KNHANES 2016–2019

nrp-17-257-i004
Food groups 1–2 yrs 3–5 yrs 6–11 yrs 12–18 yrs 19–29 yrs 30–49 yrs 50–64 yrs 65–74 yrs ≥ 75 yrs P-value*
Grains 2.19 (38.2) 2.75 (40.9) 3.59 (41.4) 4.06 (40.4) 3.41 (35.9) 3.57 (35.9) 3.76 (38.6) 3.92 (44.6) 3.73 (50.6) < 0.001
Potatoes · starches 0.07 (1.3) 0.08 (1.2) 0.09 (1.1) 0.11 (1.1) 0.11 (1.2) 0.11 (1.1) 0.12 (1.3) 0.12 (1.4) 0.09 (1.4) 0.010
Sugars · sweet 0.03 (0.6) 0.05 (0.8) 0.06 (0.7) 0.06 (0.6) 0.05 (0.6) 0.03 (0.3) 0.02 (0.2) 0.01 (0.2) 0.01 (0.1) < 0.001
Legumes 0.24 (4.0) 0.25 (3.4) 0.26 (2.7) 0.30 (2.8) 0.30 (2.9) 0.39 (3.6) 0.54 (5.1) 0.57 (6.0) 0.52 (6.5) < 0.001
Nuts · seeds 0.05 (0.7) 0.06 (0.9) 0.07 (0.7) 0.07 (0.6) 0.08 (0.8) 0.14 (1.3) 0.20 (2.0) 0.21 (2.1) 0.12 (1.4) 0.004
Vegetables 0.22 (3.7) 0.33 (4.8) 0.52 (5.9) 0.72 (6.9) 0.84 (8.4) 1.21 (11.7) 1.46 (14.3) 1.33 (14.3) 1.06 (13.2) < 0.001
Mushrooms 0.03 (0.5) 0.04 (0.5) 0.04 (0.5) 0.05 (0.5) 0.05 (0.5) 0.06 (0.6) 0.06 (0.5) 0.04 (0.4) 0.04 (0.4) < 0.001
Fruits 0.17 (3.1) 0.19 (2.9) 0.18 (2.2) 0.12 (1.4) 0.10 (1.2) 0.19 (1.9) 0.25 (2.7) 0.23 (2.6) 0.15 (2.0) < 0.001
Seaweeds 0.04 (0.7) 0.06 (0.9) 0.05 (0.6) 0.04 (0.5) 0.04 (0.4) 0.06 (0.6) 0.07 (0.7) 0.06 (0.7) 0.06 (0.7) < 0.001
Seasonings 0.07 (1.2) 0.10 (1.5) 0.16 (1.8) 0.24 (2.4) 0.28 (2.8) 0.31 (3.0) 0.30 (2.9) 0.26 (2.8) 0.21 (2.7) < 0.001
Oils · fats (plant) 0.01 (0.1) 0.01 (0.1) 0.01 (0.1) 0.01 (0.1) 0.01 (0.1) 0.01 (0.1) 0.01 (0.1) 0.01 (0.1) 0.01 (0.1) < 0.001
Others (plant) 0.00 (0.0) 0.00 (0.0) 0.00 (0.0) 0.00 (0.0) 0.00 (0.0) 0.00 (0.0) 0.00 (0.0) 0.00 (0.0) 0.00 (0.0) < 0.001
Meats 1.08 (16.4) 1.50 (19.3) 2.27 (22.7) 3.21 (26.2) 3.55 (27.6) 2.94 (22.9) 1.97 (16.0) 1.36 (11.9) 1.00 (10.4) < 0.001
Eggs 0.31 (5.1) 0.41 (5.6) 0.43 (5.1) 0.41 (4.1) 0.43 (4.6) 0.46 (4.6) 0.42 (4.1) 0.32 (3.4) 0.22 (2.7) < 0.001
Fishes 0.19 (3.2) 0.25 (3.7) 0.33 (3.6) 0.41 (3.6) 0.54 (4.6) 0.91 (6.9) 0.85 (6.9) 0.65 (5.8) 0.41 (4.5) < 0.001
Milks 1.21 (20.6) 0.87 (12.9) 0.82 (9.6) 0.65 (6.6) 0.50 (5.5) 0.35 (3.6) 0.31 (3.2) 0.24 (2.8) 0.19 (2.5) < 0.001
Oils · fats (animal) 0.00 (0.0) 0.00 (0.0) 0.00 (0.0) 0.00 (0.0) 0.00 (0.0) 0.00 (0.0) 0.00 (0.0) 0.00 (0.0) 0.00 (0.0) < 0.001
Others (animal) 0.00 (0.0) 0.00 (0.0) 0.00 (0.0) 0.00 (0.0) 0.03 (0.2) 0.02 (0.2) 0.01 (0.1) 0.01 (0.0) 0.00 (0.0) < 0.001
Beverages 0.03 (0.5) 0.05 (0.9) 0.12 (1.3) 0.25 (2.4) 0.26 (2.6) 0.15 (1.5) 0.08 (0.8) 0.04 (0.5) 0.04 (0.5) < 0.001
Alcohols 0.00 (0.0) 0.00 (0.0) 0.00 (0.0) 0.00 (0.0) 0.01 (0.1) 0.03 (0.2) 0.07 (0.5) 0.04 (0.4) 0.02 (0.2) < 0.001
Total 5.92 7.00 9.00 10.71 10.57 10.95 10.49 9.45 7.87 -
Animal foods 2.79 (45.4) 3.04 (41.5) 3.86 (41.0) 4.68 (40.5) 5.05 (42.5) 4.69 (38.1) 3.56 (30.4) 2.59 (24.0) 1.82 (20.2) < 0.001
Plant foods 3.13 (54.6) 3.95 (58.5) 5.14 (59.0) 6.03 (59.5) 5.53 (57.5) 6.26 (61.9) 6.93 (69.6) 6.86 (76.0) 6.05 (79.8) < 0.001
KNHANES, Korea National Health and Nutrition Examination Survey.
*P-value for the differences between age groups in the contribution to the total dietary intake (%).
The data represent the dietary zinc intake (mg/day) of each food group and the contribution to the total dietary zinc intake (%).
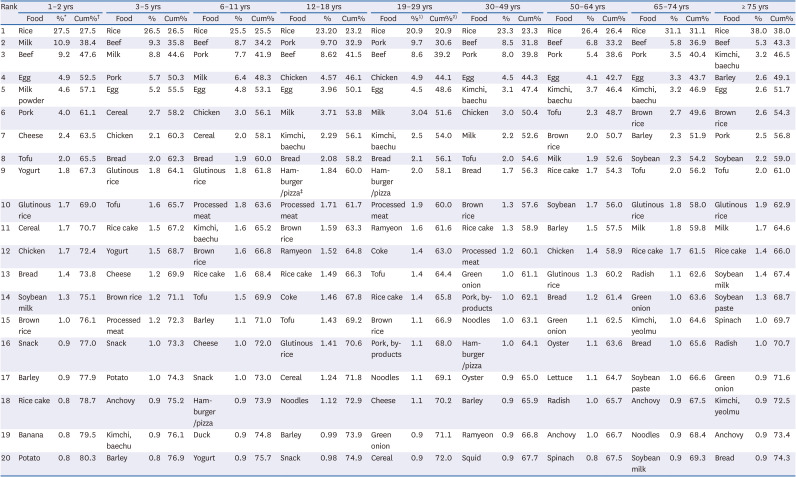
The top 20 individual food contributors to the total zinc intake by sex and age groups are listed in Tables 5 and 6. The top 20 individual foods contributed to approximately 70% of the total zinc intake. In the total population, rice (25.4%), beef (7.8%), pork (6.9%), eggs (4.2%), and baechu kimchi (2.9%) were the top 5 items, which accounted for half of the total zinc intake. Similarly to the results concerning the major contributing food groups, the top 20 individual food contributors to zinc intake differed slightly by sex and age groups. Rice, pork, beef, egg, and baechu kimchi were the top 5 individual food contributors to the total zinc intake of males, whereas rice, beef, pork, egg, and milk were the top 5 contributors in females. In younger age groups, dairy products (e.g., milk powder, yogurt, and cheese), processed meat, hamburger, pizza, sandwich, bread, snack, and coke were the major food sources of zinc. Conversely, in the older age group, much vegetables (e.g., radish and green onion) and fishes (e.g., oyster and anchovy, which are high in zinc) were ranked as the major source foods.
Table 5

Top 20 individual foods for dietary zinc intake and their contribution by sex, KNHANES 2016–2019
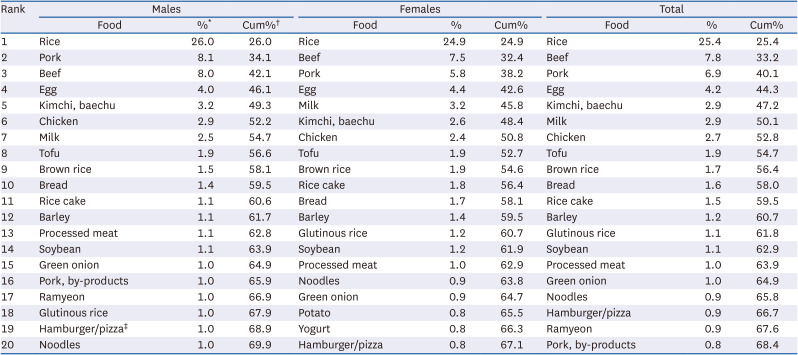
nrp-17-257-i005
Rank Males Females Total
Food %* Cum% Food % Cum% Food % Cum%
1 Rice 26.0 26.0 Rice 24.9 24.9 Rice 25.4 25.4
2 Pork 8.1 34.1 Beef 7.5 32.4 Beef 7.8 33.2
3 Beef 8.0 42.1 Pork 5.8 38.2 Pork 6.9 40.1
4 Egg 4.0 46.1 Egg 4.4 42.6 Egg 4.2 44.3
5 Kimchi, baechu 3.2 49.3 Milk 3.2 45.8 Kimchi, baechu 2.9 47.2
6 Chicken 2.9 52.2 Kimchi, baechu 2.6 48.4 Milk 2.9 50.1
7 Milk 2.5 54.7 Chicken 2.4 50.8 Chicken 2.7 52.8
8 Tofu 1.9 56.6 Tofu 1.9 52.7 Tofu 1.9 54.7
9 Brown rice 1.5 58.1 Brown rice 1.9 54.6 Brown rice 1.7 56.4
10 Bread 1.4 59.5 Rice cake 1.8 56.4 Bread 1.6 58.0
11 Rice cake 1.1 60.6 Bread 1.7 58.1 Rice cake 1.5 59.5
12 Barley 1.1 61.7 Barley 1.4 59.5 Barley 1.2 60.7
13 Processed meat 1.1 62.8 Glutinous rice 1.2 60.7 Glutinous rice 1.1 61.8
14 Soybean 1.1 63.9 Soybean 1.2 61.9 Soybean 1.1 62.9
15 Green onion 1.0 64.9 Processed meat 1.0 62.9 Processed meat 1.0 63.9
16 Pork, by-products 1.0 65.9 Noodles 0.9 63.8 Green onion 1.0 64.9
17 Ramyeon 1.0 66.9 Green onion 0.9 64.7 Noodles 0.9 65.8
18 Glutinous rice 1.0 67.9 Potato 0.8 65.5 Hamburger/pizza 0.9 66.7
19 Hamburger/pizza 1.0 68.9 Yogurt 0.8 66.3 Ramyeon 0.9 67.6
20 Noodles 1.0 69.9 Hamburger/pizza 0.8 67.1 Pork, by-products 0.8 68.4
KNHANES, Korea National Health and Nutrition Examination Survey.
*The data represent the mean contribution (%) of dietary zinc intake from each food.
The data express the cumulative contribution (%) of dietary zinc intake.
Also including sandwich.
Table 6

Top 20 individual foods for dietary zinc intake and their contribution by age groups, KNHANES 2016–2019

nrp-17-257-i006
Rank 1–2 yrs 3–5 yrs 6–11 yrs 12–18 yrs 19–29 yrs 30–49 yrs 50–64 yrs 65–74 yrs ≥ 75 yrs
Food %* Cum% Food % Cum% Food % Cum% Food % Cum% Food %1) Cum%2) Food % Cum% Food % Cum% Food % Cum% Food % Cum%
1 Rice 27.5 27.5 Rice 26.5 26.5 Rice 25.5 25.5 Rice 23.20 23.2 Rice 20.9 20.9 Rice 23.3 23.3 Rice 26.4 26.4 Rice 31.1 31.1 Rice 38.0 38.0
2 Milk 10.9 38.4 Beef 9.3 35.8 Beef 8.7 34.2 Pork 9.70 32.9 Pork 9.7 30.6 Beef 8.5 31.8 Beef 6.8 33.2 Beef 5.8 36.9 Beef 5.3 43.3
3 Beef 9.2 47.6 Milk 8.8 44.6 Pork 7.7 41.9 Beef 8.62 41.5 Beef 8.6 39.2 Pork 8.0 39.8 Pork 5.4 38.6 Pork 3.5 40.4 Kimchi, baechu 3.2 46.5
4 Egg 4.9 52.5 Pork 5.7 50.3 Milk 6.4 48.3 Chicken 4.57 46.1 Chicken 4.9 44.1 Egg 4.5 44.3 Egg 4.1 42.7 Egg 3.3 43.7 Barley 2.6 49.1
5 Milk powder 4.6 57.1 Egg 5.2 55.5 Egg 4.8 53.1 Egg 3.96 50.1 Egg 4.5 48.6 Kimchi, baechu 3.1 47.4 Kimchi, baechu 3.7 46.4 Kimchi, baechu 3.2 46.9 Egg 2.6 51.7
6 Pork 4.0 61.1 Cereal 2.7 58.2 Chicken 3.0 56.1 Milk 3.71 53.8 Milk 3.04 51.6 Chicken 3.0 50.4 Tofu 2.3 48.7 Brown rice 2.7 49.6 Brown rice 2.6 54.3
7 Cheese 2.4 63.5 Chicken 2.1 60.3 Cereal 2.0 58.1 Kimchi, baechu 2.29 56.1 Kimchi, baechu 2.5 54.0 Milk 2.2 52.6 Brown rice 2.0 50.7 Barley 2.3 51.9 Pork 2.5 56.8
8 Tofu 2.0 65.5 Bread 2.0 62.3 Bread 1.9 60.0 Bread 2.08 58.2 Bread 2.1 56.1 Tofu 2.0 54.6 Milk 1.9 52.6 Soybean 2.3 54.2 Soybean 2.2 59.0
9 Yogurt 1.8 67.3 Glutinous rice 1.8 64.1 Glutinous rice 1.8 61.8 Hamburger/pizza 1.84 60.0 Hamburger/pizza 2.0 58.1 Bread 1.7 56.3 Rice cake 1.7 54.3 Tofu 2.0 56.2 Tofu 2.0 61.0
10 Glutinous rice 1.7 69.0 Tofu 1.6 65.7 Processed meat 1.8 63.6 Processed meat 1.71 61.7 Processed meat 1.9 60.0 Brown rice 1.3 57.6 Soybean 1.7 56.0 Glutinous rice 1.8 58.0 Glutinous rice 1.9 62.9
11 Cereal 1.7 70.7 Rice cake 1.5 67.2 Kimchi, baechu 1.6 65.2 Brown rice 1.59 63.3 Ramyeon 1.6 61.6 Rice cake 1.3 58.9 Barley 1.5 57.5 Milk 1.8 59.8 Milk 1.7 64.6
12 Chicken 1.7 72.4 Yogurt 1.5 68.7 Brown rice 1.6 66.8 Ramyeon 1.52 64.8 Coke 1.4 63.0 Processed meat 1.2 60.1 Chicken 1.4 58.9 Rice cake 1.7 61.5 Rice cake 1.4 66.0
13 Bread 1.4 73.8 Cheese 1.2 69.9 Rice cake 1.6 68.4 Rice cake 1.49 66.3 Tofu 1.4 64.4 Green onion 1.0 61.1 Glutinous rice 1.3 60.2 Radish 1.1 62.6 Soybean milk 1.4 67.4
14 Soybean milk 1.3 75.1 Brown rice 1.2 71.1 Tofu 1.5 69.9 Coke 1.46 67.8 Rice cake 1.4 65.8 Pork, by-products 1.0 62.1 Bread 1.2 61.4 Green onion 1.0 63.6 Soybean paste 1.3 68.7
15 Brown rice 1.0 76.1 Processed meat 1.2 72.3 Barley 1.1 71.0 Tofu 1.43 69.2 Brown rice 1.1 66.9 Noodles 1.0 63.1 Green onion 1.1 62.5 Kimchi, yeolmu 1.0 64.6 Spinach 1.0 69.7
16 Snack 0.9 77.0 Snack 1.0 73.3 Cheese 1.0 72.0 Glutinous rice 1.41 70.6 Pork, by-products 1.1 68.0 Hamburger/pizza 1.0 64.1 Oyster 1.1 63.6 Bread 1.0 65.6 Radish 1.0 70.7
17 Barley 0.9 77.9 Potato 1.0 74.3 Snack 1.0 73.0 Cereal 1.24 71.8 Noodles 1.1 69.1 Oyster 0.9 65.0 Lettuce 1.1 64.7 Soybean paste 1.0 66.6 Green onion 0.9 71.6
18 Rice cake 0.8 78.7 Anchovy 0.9 75.2 Hamburger/pizza 0.9 73.9 Noodles 1.12 72.9 Cheese 1.1 70.2 Barley 0.9 65.9 Radish 1.0 65.7 Anchovy 0.9 67.5 Kimchi, yeolmu 0.9 72.5
19 Banana 0.8 79.5 Kimchi, baechu 0.9 76.1 Duck 0.9 74.8 Barley 0.99 73.9 Green onion 0.9 71.1 Ramyeon 0.9 66.8 Anchovy 1.0 66.7 Noodles 0.9 68.4 Anchovy 0.9 73.4
20 Potato 0.8 80.3 Barley 0.8 76.9 Yogurt 0.9 75.7 Snack 0.98 74.9 Cereal 0.9 72.0 Squid 0.9 67.7 Spinach 0.8 67.5 Soybean milk 0.9 69.3 Bread 0.9 74.3
KNHANES, Korea National Health and Nutrition Examination Survey.
*The data represent the mean contribution (%) of dietary zinc intake from each food.
The data express the cumulative contribution (%) of dietary zinc intake.
Also including sandwich.

DISCUSSION

In the present study, we estimated the dietary zinc intake in the Korean population by applying our newly-constructed database of the zinc content in foods to the 24-h recall raw data of the KNHANES (2016–2019). We also evaluated the prevalence of inappropriate intake and investigated the dietary sources of zinc intake. This study found that the mean zinc intake of Koreans was above the EAR in all sex and age groups, whereas approximately 1 in 3 Koreans did not meet the EAR for zinc. The inadequate zinc intake was more profound in females, younger adults aged 19–29 and the elderly aged ≥ 75 yrs. In contrast, 2 in 5 children aged 1–2 yrs consumed excessive amounts of zinc. The major contributing foods in the Korean population were grains, meats, and vegetables, with slight differences by sex and age.
Several studies have been conducted on the dietary zinc intake of Koreans [16171819202122232425], most of which were small-sized with specific age groups or included residents of particular regions. The dietary zinc intake of Koreans in our study was slightly higher than that reported in most of the previous studies. For example, we established that young males and females aged 19–29 yrs had an average daily intake of 12.3 and 8.6 mg, respectively. However, in a study conducted by Park and Chyun in 1993 [21], adult males and females aged 20–25 yrs had an average daily intake of 8.5 and 6.4 mg of zinc, correspondingly. Additionally, Son and Sung [20] reported in 1996 that the daily mean zinc intake of female college students was 4.5 mg, calculated by the use of a Korean food composition table available at the time. They also directly analyzed the foods which each participant consumed to compensate for the incompleteness of the food composition table for the zinc content, reporting a mean intake of 5.5 mg. In another study, Jang et al. [19] examined the changes in the dietary intake of college students in 1999 and 2009. These authors found that in male students, the daily zinc intake increased from 7.8 mg in 1999 to 10.2 mg in 2000, and from 5.9 to 7.3 mg in female students in the 2 yrs, respectively. In contrast, Bae et al. [18] published their results in 2012, according to which female college students had an average intake of 12.8 mg/day, which was higher zinc intake than the one established in our study.
Direct comparison of these results is not relevant because there are differences in the accuracy and coverage of the zinc content database between studies [23], as well as in the dietary assessment method [42]. We consider that the zinc intake found in our study was slightly higher than those in previous studies due to the improved coverage of the newly constructed zinc database. In Korea, zinc content information was first included in the Recommended Dietary Allowances for Koreans, the 6th revision published by the Korean Nutrition Society, including only a limited number of foods [43]. The initial limited coverage of the database has been considered to be the cause of zinc intake underestimation [171823]. In addition, our results are likely to have reflected the continuous trends of an increasing zinc intake observed also in a previous study [19], and of an elevated intake of animal foods high in zinc content [44].
In our study, approximately 1 out of 3 Koreans aged ≥ 1 yr did not meet the EAR. As mentioned above, zinc deficiency is commonly observed in developing countries [13], but the prevalence of those with inadequate zinc intake has also been pointed out as a public health concern in other countries [91012]. The findings of an inappropriate intake of zinc of our study are in line with those obtained in previous research. More specifically, our and earlier results consistently show that the inadequacy of zinc intake is more profound in females and older adults [9], whereas excessive intakes above the UL have been frequently observed in children under 5 yrs of age in developed countries (e.g., Australia and US) [111416].
Food groups, such as fishes, meats, whole grains, and beans have high zinc content [126]. However, our study revealed that the food groups most significantly contributing to the total zinc intake among Koreans aged ≥ 1 yr were arranged in the following descending order: grains (38.9%), meats (20.4%), vegetables (11.1%), fishes (5.8%), and milks (4.7%). The top 5 individual food contributors were rice (25.4%), beef (7.8%), pork (6.9%), egg (4.2%), and baechu kimchi (2.9%), which accounted for 47.2% of the total zinc intake. The contribution (%) to total intake varies slightly by age and sex, but these tendencies are consistent with the ones established in previous studies of Koreans [17182021232425]. Rice and vegetables are relatively low in zinc, but they seem to have become a major source of zinc due to their high absolute intake. In our study, older adults had a lower zinc intake than younger adults and were more dependent on plant-based food. As known, phytic acid, which is a component of plant-based foods, interferes with the absorption of dietary zinc and decreases its utilization in the human body [1]. Thus, ways are to be found that facilitate obtaining an appropriate zinc intake by older adults. In contrast, meat and its products, milk and dairy products, and cereals and grains are the main sources of this trace element in countries such as Spain and Australia, which have different food cultures [1011].
In this study, we developed a new zinc content database for the dietary assessment and processing of the KNHANES (2016–2019) dietary data. Our database covers almost all foods consumed by the participants in this important nationwide survey. Applying this novel information to the KNHANES raw data, we estimated the most recent dietary zinc intake of Koreans and its food sources. Besides, inappropriate intakes of zinc (including adequate and excessive intake) were established, and the at-risk population was identified. However, our study has several limitations. Similarly to other micronutrients, zinc can be obtained through food and taken as a dietary supplement. In a study of the NHANES 2005–2016 [9], the mean zinc intake of US adults was found to be 11.6 mg (food only) and 15.9 mg (food plus supplement); the prevalence of an inadequate intake was 15% (food only) and 11% (food plus supplement), respectively. However, we assessed the zinc intake from food only because no data were available on the zinc content obtained through dietary supplements in the KNANES data. Besides, the KNHANES assessed only the 1-day dietary intake by the 24-h dietary recall method, which might have led to a slight overestimation of the prevalence of the inappropriate zinc intake [42].
In conclusion, the mean zinc intake among Koreans was above the recommended intake, but a substantial proportion of Koreans consumed an inadequate amount of magnesium. To better understand the current status of zinc intake, further research is needed that also considers the intake of this important trace element from dietary supplements.

Notes

Funding: This work was supported by a grant from the Korea Disease Control and Prevention Agency (2021-11-006) in 2021.

Conflict of Interest: The authors declare no potential conflicts of interests.

Author Contributions:

  • Conceptualization: Shim JS, Lee HS.

  • Formal analysis: Shim JS.

  • Funding acquisition: Lee HS.

  • Investigation: Shim JS, Kim KN, Lee JS, Yoon MO, Lee HS.

  • Methodology: Shim JS, Kim KN, Lee JS, Yoon MO, Lee HS.

  • Supervision: Lee HS.

  • Writing - original draft: Shim JS.

  • Writing - review & editing: Shim JS, Kim KN, Lee JS, Yoon MO, Lee HS.

References

1. Ministry of Health and Welfare. Korean Nutrition Society. Dietary Reference Intakes for Koreans 2020. Sejong: Ministry of Health and Welfare;2020.
2. Li Z, Li B, Song X, Zhang D. Dietary zinc and iron intake and risk of depression: a meta-analysis. Psychiatry Res. 2017; 251:41–47. PMID: 28189077.
3. Lee DY, Prasad AS, Hydrick-Adair C, Brewer G, Johnson PE. Homeostasis of zinc in marginal human zinc deficiency: role of absorption and endogenous excretion of zinc. J Lab Clin Med. 1993; 122:549–556. PMID: 8228573.
4. Herbst CA, Menon KC, Ferguson EL, Thomson CD, Bailey K, Gray AR, Zodpey S, Saraf A, Das PK, Skeaff SA. Dietary and non-dietary factors associated with serum zinc in Indian women. Biol Trace Elem Res. 2014; 161:38–47. PMID: 25080861.
5. Prasad AS. Clinical, endocrinological and biochemical effects of zinc deficiency. Clin Endocrinol Metab. 1985; 14:567–589. PMID: 3905080.
6. de Benoist B, Darnton-Hill I, Davidsson L, Fontaine O, Hotz C. Conclusions of the joint WHO/UNICEF/IAEA/IZiNCG interagency meeting on zinc status indicators. Food Nutr Bull. 2007; 28:S480–S484. PMID: 17988008.
7. Gupta S, Brazier AK, Lowe NM. Zinc deficiency in low- and middle-income countries: prevalence and approaches for mitigation. J Hum Nutr Diet. 2020; 33:624–643. PMID: 32627912.
8. Smith MR, DeFries R, Chhatre A, Ghosh-Jerath S, Myers SS. Inadequate zinc intake in India: past, present, and future. Food Nutr Bull. 2019; 40:26–40. PMID: 30974983.
9. Reider CA, Chung RY, Devarshi PP, Grant RW, Hazels Mitmesser S. Inadequacy of immune health nutrients: intakes in US adults, the 2005-2016 NHANES. Nutrients. 2020; 12:1735. PMID: 32531972.
10. Olza J, Aranceta-Bartrina J, González-Gross M, Ortega RM, Serra-Majem L, Varela-Moreiras G, Gil Á. Reported dietary intake and food sources of zinc, selenium, and vitamins A, E and C in the Spanish population: findings from the ANIBES study. Nutrients. 2017; 9:697. PMID: 28684689.
11. Rangan AM, Samman S. Zinc intake and its dietary sources: results of the 2007 Australian National Children’s Nutrition and Physical Activity Survey. Nutrients. 2012; 4:611–624. PMID: 22852053.
12. Qin Y, Melse-Boonstra A, Shi Z, Pan X, Yuan B, Dai Y, Zhao J, Zimmermann MB, Kok FJ, Zhou M. Dietary intake of zinc in the population of Jiangsu Province, China. Asia Pac J Clin Nutr. 2009; 18:193–199. PMID: 19713178.
13. Freeland-Graves JH, Sachdev PK, Binderberger AZ, Sosanya ME. Global diversity of dietary intakes and standards for zinc, iron, and copper. J Trace Elem Med Biol. 2020; 61:126515. PMID: 32450495.
14. Arsenault JE, Brown KH. Zinc intake of US preschool children exceeds new dietary reference intakes. Am J Clin Nutr. 2003; 78:1011–1017. PMID: 14594789.
15. Foster M, Samman S. Vegetarian diets across the lifecycle: impact on zinc intake and status. Adv Food Nutr Res. 2015; 74:93–131. PMID: 25624036.
16. Yu KH. A study on the nutrient intakes and zinc nutritional status of preschool children in Ulsan. Korean J Nutr. 2007; 40:385–394.
17. Lee EM, Kim SH. Dietary zinc intake assessed by dietary survey and zinc analysis of foods consumed by elementary schoolchildren in Chungnam province in Korea: comparison between remote rural and urban areas. J Korean Soc Food Cult. 2010; 25:100–107.
18. Bae YJ, Kim MH, Yeon JY. Evaluation of dietary zinc, copper, manganese and selenium intake in female university students. Korean J Community Nutr. 2012; 17:146–155.
19. Jang HB, Lee HY, Han YH, Song J, Kim KN, Hyun T. Changes in food and nutrient intakes of college students between 1999 and 2009. Korean J Community Nutr. 2011; 16:324–336.
20. Son SM, Sung SI. Zinc and copper intake with food analysis and levels of zinc and copper in serum, hair and urine of female college students. Korean J Nutr. 1999; 32:705–712.
21. Park JS, Chyun JH. Dietary zinc analysis and changes of zinc nutriture with zinc supplementation in Korean adults. Korean J Nutr. 1993; 26:1110–1117.
22. Lee SG, Lee DT, Kim HN, Kim AJ, Sung CJ. The comparison mineral intakes with serum lipids and minerals in some rural housewives. J Korean Soc Food Nutr. 1990; 19:411–417.
23. Lee JY, Paik HY, Joung H. Supplementation of zinc nutrient database and evaluation of zinc intake of Korean adults living in rural area. Korean J Nutr. 1998; 31:1324–1377.
24. Choi MK, Kim HS, Lee WY, Lee H, Ze K, Park JD. Comparative evaluation of dietary intakes of calcium, phosphorus, iron, and zinc in rural, coastal, and urban district. J Korean Soc Food Sci Nutr. 2005; 34:659–666.
25. Lee K, Park JR, Seo JS. Nutritional status of the elderly living in a private silver town of Busan metropolitan city, Korea. J Korean Soc Food Sci Nutr. 2007; 36:1293–1299.
26. Korean Nutrition Society. Korea Disease Control and Prevention Agency. Development of Database of Magnesium and Zinc for Korea National Health and Nutrition Examination Survey’s Data Processing. Cheongju: Korea Disease Control and Prevention Agency;2022.
27. Kweon S, Kim Y, Jang MJ, Kim Y, Kim K, Choi S, Chun C, Khang YH, Oh K. Data resource profile: the Korea National Health and Nutrition Examination Survey (KNHANES). Int J Epidemiol. 2014; 43:69–77. PMID: 24585853.
28. Korea Disease Control and Prevention Agency. 2019 Guidebook for Using the Data from Korea National Health and Nutrition Examination Survey. Cheongju: Korea Disease Control and Prevention Agency;2021.
29. National Institute of Agricultural Sciences. Korean Food Composition Table (version 9.1). Wanju: National Institute of Agricultural Sciences;2019.
30. National Institute of Agricultural Sciences. Korean Food Composition Table (version 9.2). Wanju: National Institute of Agricultural Sciences;2020.
31. Shim JS, Kim KN, Lee JS, Yoon MO, Lee HS. Magnesium intake and dietary sources among Koreans: findings from the Korea National Health and Nutrition Examination Survey 2016–2019. Nutr Res Pract. 2023; 17:48–61. PMID: 36777797.
32. Greenfield SS. Food Composition Data, Production, Management and Use. 2nd ed. Rome: FAO/INFOODS;2003.
33. Food and Agriculture Organization of the United Nations. Compilation tool version 1.2.1 (FAO/INFOODS) and user guidelines, International Network of Food Data Systems (INFOODS) [Internet]. Rome: Food and Agriculture Organization;2021. cited 2021 April 15. Available from: https://www.fao.org/infoods/infoods/software-tools/en/ .
34. National Institute of Agricultural Sciences. Korean Food Composition Table (version 9.3). Wanju: National Institute of Agricultural Sciences;2021.
35. Ministry of Food and Drug Safety. Nutrition Facts of Processed Food (2019). Cheongju: Ministry of Food and Drug Safety;2019.
36. Ministry of Food and Drug Safety. Nutrition Facts of Processed Food (2020). Cheongju: Ministry of Food and Drug Safety;2020.
37. Ministry of Food and Drug Safety. Nutrition Facts of Eating-Out (2019). Cheongju: Ministry of Food and Drug Safety;2019.
38. Ministry of Food and Drug Safety. Nutrition Facts of Eating-Out (2020). Cheongju: Ministry of Food and Drug Safety;2020.
39. Ministry of Education, Culture, Sports, Science and Technology. Standard tables of food composition in Japan- 2021 - (8th Revised Version). Tokyo: Ishiyaku Publishere Inc.;2021.
40. U.S. Department of Agriculture. FoodData Central 2020 [Internet]. Washington, D.C.: U.S. Department of Agriculture;2020. cited 2021 March 7. Available from: https://fdc.nal.usda.gov/Laboratory .
41. Food Standards Australia & New Zealand. Food nutrient database 2019 [Internet]. Kingston: Food Standards Australia & New Zealand;2019. cited 2021 June 10. Available from: https://www.foodstandards.gov.au/science/monitoringnutrients/ausnut/foodnutrient/Pages/default.aspx .
42. Shim JS, Oh K, Kim HC. Dietary assessment methods in epidemiologic studies. Epidemiol Health. 2014; 36:e2014009. PMID: 25078382.
43. Korean Nutrition Society. Recommended Dietary Allowances for Koreans. 6th rev. Seoul: Korean Nutrition Society;1995.
44. Korea Disease Control and Prevention Agency. Korea Health Statistics 2020: Korea National Health and Nutrition Examination Survey (KNHANES VIII-2). Cheongju: Korea Disease Control and Prevention Agency;2020.
TOOLS
Similar articles