

 PDF
PDF Citation
 Print
Print


INTRODUCTION
Traumatic brain injury (TBI) is an important public health problem owing to its high fatality and disability rates. In 2016, the annual incidence of TBI worldwide was estimated to be approximately 27.8 million, and the age-standardized incidence was approximately 369 per 100,000 population.12 Moreover, globally, the number of years lived with disability due to TBI is estimated to be 8.1 million. In South Korea, the age-standardized incidence of TBI per 100,000 population in 2017 was approximately 476.3 In addition, according to a study in New Zealand, the average lifetime cost per new case of TBI at 12 months after the injury was 5,922 USD.4 As such, many countries are working on the development of surveillance systems and effective strategies for preventing TBI.
Globally, 81%, 11%, and 8% of the reported TBI cases account for mild, moderate, and severe TBI.1 However, because the greatest burden of TBI (i.e., long-term disability and death) is attributed to severe TBI,56 prevention efforts should focus on moderate-to-severe TBI.
Studies examining the association between individual-level socioeconomic status (SES), such as the lack of health insurance or income, and the incidence of TBI have shown increasing incidence in people with low SES.789 As moderate-to-severe TBI is more likely to require hospitalization as well as higher costs for management and treatment than mild TBI, SES is an important factor that may influence the outcomes of moderate-to-severe TBI.1011
Increasing geographical segregation is known to exacerbate inequalities in access to health amenities, and health inequalities by geographical area are also a public health concern.912 Individuals living in socioeconomically deprived areas and lower-income tracts are at an increased risk of TBI.1314 To the extent that socioeconomic inequalities in health are avoidable, measuring health gaps help to identify opportunities to target future interventions.12 Additionally, understanding the inequality of moderate-to-severe TBI by area-based SES can help appraise the development and implementation of area-based TBI prevention strategies.
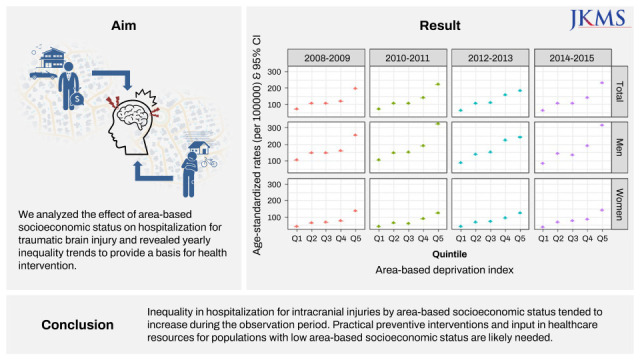
Although some studies on the risk of TBI for individual-based SES exist,1516 few studies have examined the relationship between SES and TBI at the geographic area level. This study aimed to explore inequalities in hospitalization rates for intracranial injuries (ICIs) by area-based SES in South Korea. Furthermore, we analyzed the effect of area-based SES on hospitalization for TBI and revealed inequality trends by year to provide a basis for health intervention.
METHODS
Data and study subjects
Data from the Korea National Hospital Discharge Survey (KNHDS) were used in this study. The KNHDS aims to identify the incidence and characteristics of patients hospitalized for injury.17 The target population for this survey included all patients discharged from hospitals with > 100 beds, excluding nursing homes; long-term care centers; and geriatric, military, and rehabilitation hospitals. A stratified two-stage cluster sampling method was used, with individual hospitals as the primary sampling unit and discharged patients in a sampled hospital as the secondary sampling unit.18 The study hospitals were selected based on a cluster random sample of hospitals stratified by geographic location and number of beds. To reflect the complex sampling, weightage was assigned to the variable that was the variance of the estimated total number of discharged patients, the medical institution code corresponding to the primary sampling unit of the sample design was set to cluster, and the number of beds was set to strata. The total number of discharged patients was estimated by summing the product of the number of discharged patients per sample hospital and the weights.
The KNHDS includes in-depth surveys of discharged patients hospitalized for accidental injury or violence. Among 242,084 cases of KNHDS data collected from 2008 to 2015, we extracted data on patients hospitalized for ICI. The basic survey items for all discharged patients included hospital information, demographic information, hospital admission and discharge date, and diagnostic codes based on the International Classification of Diseases, 10th Revision (ICD-10). In-depth information on injuries, such as intention, mechanism, place of occurrence of injury, and activity at the time of injury, was also collected according to the International Classification of External Causes of Injury version 1.2. The exclusion criterion was the lack of information on home addresses, which was essential for the application of area-based SES.
Outcome and other variables
Moderate-to-severe TBI was defined according to the 8th Korean Standard Classification of Diseases and Causes of Death19 based on ICD-10 codes with localization for Korea, ranging from S06.1 to S06.8 (traumatic cerebral edema, diffuse TBI, focal TBI, epidural hemorrhage, traumatic subdural hemorrhage, traumatic subarachnoid hemorrhage, and other specified ICIs). The places of occurrence of injury were classified as homes, roads, and others, including public places. Age groups were categorized into < 15 years, 15–64 years, and ≥ 65 years.
Constructing the area-based SES
In South Korea, there are 17 administrative divisions: 9 provinces (including Jeju Special Self-Governing Province), 6 metropolitan cities, 1 “special city” (Seoul), and 1 “special autonomous city” (Sejong). Seoul is both the largest city in South Korea and the national capital and the Sejong Special Autonomous City was founded to disperse government agencies in Seoul. These divisions are further subcategorized into cities (Korean phrase, si), counties (gun), and districts (gu). Counties have a population of less than 150,000, whereas cities have a population of at least 150,000. Cities with populations exceeding 500,000 are subcategorized into districts. In 2015, there were 252 districts in South Korea.
We used the area-based deprivation index to represent the area-based SES and assigned it according to the patient’s home address.20 The deprivation index was generated by 10% of the 2010 Korean population census data recorded at the district level by the Korean National Statistics Office.21 We conducted principal components analyses by varimax rotation using 11 variables presented in Supplementary Table 1, reduced to two factors. The two factors corresponded to material (poor residential environment, low level of education, older age, and low social class) and social components (single-parent family, female household, lack of a car, non-apartment living, and marital status). Among the indicators, male unemployment and home ownership were excluded because they showed negative values. The variables used to construct our deprivation index were very similar to those used in previous studies.222324 Each variable was Z-score-standardized. Subsequently, the values were combined to calculate the deprivation indices at the district level.25 The deprivation index created in this method has been validated through a study confirming regional inequality related to infant mortality in Korea.24 Each district was categorized into quintile groups (least deprived [Q1] to most deprived [Q5]) according to the deprivation index.
Statistical analysis
We used the “Surveymeans” and “Surveyfreq” procedures in SAS version 9.4 (SAS Institute Inc., Cary, NC, USA) to calculate the weighted numbers of patients and reflect the contents of the two-stage stratified clustered sampling.17 The Wald χ2 test was used to evaluate the categorical variables to test the independence of the row and column variables in two-way tables, considering the complex survey design.26 Statistical significance was set at P < 0.05 (2-tailed). The proportion of patient characteristics obtained from a weighted number was presented by area deprivation quintiles, study period, and sex.
Age-standardized ICI-related hospitalization rates were calculated according to area-based SES and divided by period and sex. Direct age standardization was carried out for a total of nine age groups, divided into 10-year intervals from 0 to 80 years and a group aged over 80 years, based on the Korean population in 2015.
Inequalities in the ICI-related hospitalization rates were assessed using the relative index of inequality (RII)27 and the slope index of inequality (SII)28; these measures are used in epidemiological studies to quantify the socioeconomic gradient in relative and absolute terms, respectively, when compared over time or across populations. The RII can be interpreted as the ratio of hospitalization rates between the lowest and highest area-based SES groups in a given population. An RII of > 1 indicates the concentration of adverse health outcomes among the disadvantaged, whereas a value of < 1 shows the concentration among the more advantaged. SII represents the estimated absolute difference in hospitalization rates between individuals in the lowest and highest classes. A positive SII value indicates that the concentration of unfavorable health outcomes is high in the disadvantaged group. In contrast, a negative value indicates that the concentration is high in the advantaged group.
The “svydesign” function, which reports on the design elements in the survey in R (version 4.0.5; R Foundation, Vienna, Austria), was used to calculate crude ICI-related hospitalization rates. The midpoints of the cumulative distribution of each area-based SES quintile were calculated by considering the population size of each group. The midpoints of the area-based SES group were used as independent variables. Generalized linear regression models (GLMs) were performed using the log-link function for RII and the identity-link function for SII.29 Since RII and SII were based on crude hospitalization rates, the models used to estimate RII and SII for the total population were adjusted for sex, age group, and interactions between sex and age group.30 The models for men and women were adjusted for the age group. The linear trends in RII and SII over time were assessed by adding an interaction term between the midpoints of the area-based SES quintile and the year group by adjusting for sex, age group, and the interactions between sex and age group (model for the total population) or by adjusting for age group (models for males and females). Positive/negative and statistically significant interaction terms (midpoint by year group) in GLMs indicated an increase/decrease in inequality on a relative scale. All models were also adjusted for overdispersion when necessary.
Ethics statement
The KNHDS was conducted as part of the national injury surveillance system, and all analyses in this study used publicly available data. The Institutional Review Board (IRB) of Hallym University Dongtan Sacred Heart Hospital approved this study (IRB No. HDT 2020-05-009). The requirement for the acquisition of informed consent from patients was waived owing to the retrospective nature of the analysis.
RESULTS
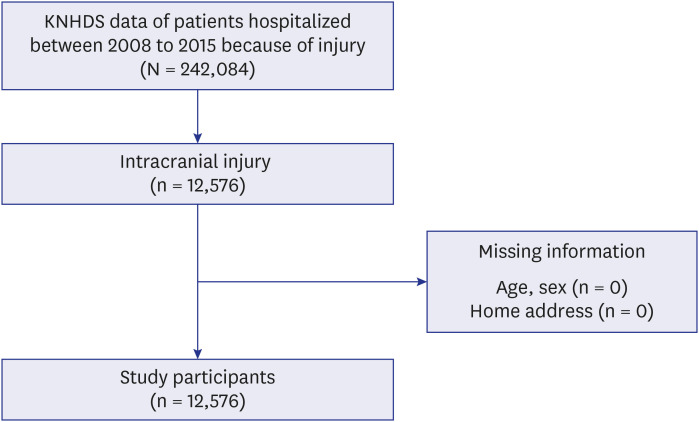
Between 2008 and 2015, a total of 12,576 patients were diagnosed with ICI, which means moderate-to-severe TBI, and no patients were excluded because of unknown sex or home address (Fig. 1). The total weighted number of patients with ICI was estimated at 377,694. By area-based SES quintiles, 84,227 (22.3%) and 120,764 (32.0%) were in the Q1 and Q2 groups, respectively. The group with the lowest number of patients with ICI was Q5 (n = 37,572; 9.9%), followed by Q4 (n = 51,971; 13.8%) and Q3 (n = 83,160; 22.0%).
The characteristics of patients with ICI by area-based SES quintiles are presented in Supplementary Table 2. The proportions of children and adults were high in areas with low deprivation, whereas the proportion of those aged over 65 years was significantly higher in areas with high deprivation (P < 0.001). Men showed a higher ICI hospitalization rate than women, and no significant difference was observed in sex between quintile groups (P = 0.762). In addition, the proportions of ICIs occurring on the road in the Q4 and Q5 groups were 47.0% and 50.7%, respectively, which were relatively higher than those reported in the other groups.
Table 1 shows the characteristics of patients with ICI by period and sex. The proportions of children and adults decreased across the study period, although the proportion of adults aged over 65 years continued to increase for both men and women. During all periods, the highest proportion of injuries sustained by both men and women was on the road, and women were observed to have a higher proportion of injuries at home than men. For men, the proportion of patients injured at home slightly increased to 13.3% (95% confidence interval [CI]: 11.1–15.4) in 2014/2015 from 12.3% (95% CI, 10.5–14.1) in 2008/2009; conversely, for women, it slightly decreased to 22.5% (95% CI, 19.7–25.4) from 23.3% (95% CI, 20.1–26.6).
Table 1
Intracranial injury-related hospitalizations by period and sex
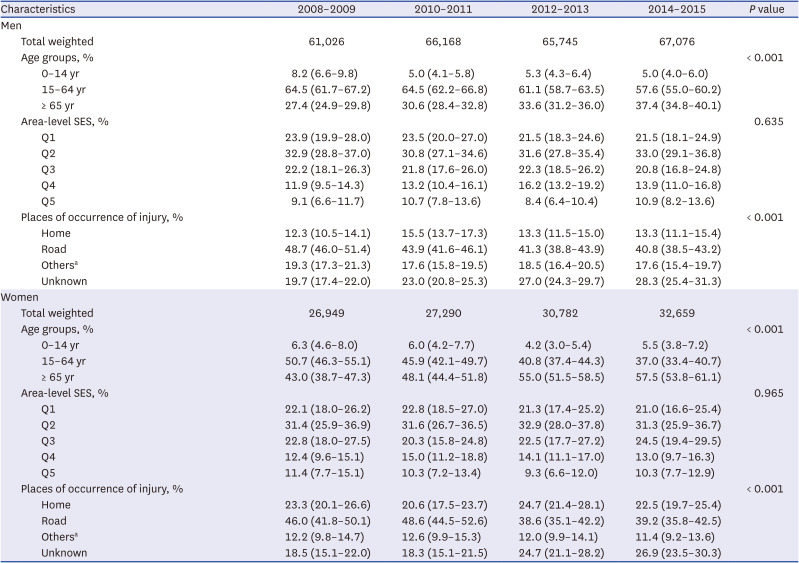
The proportion of patient characteristics obtained from a weighted number was presented by study period and sex. Values are presented as percentages and 95% confidence intervals within parentheses. P values were calculated using the Wald χ2 test.
Q1 = least deprived group, Q5 = most deprived group, SES = socioeconomic status.
aAny place other than home or road, including public places.
The age-standardized hospitalization rate for ICI increased from Q1 to Q5 groups in all periods, and the difference in hospitalization rates between Q1 and Q5 was higher in men than in women (Fig. 2, Table 2). The increase in the hospitalization rate from Q1 to Q5 can also be confirmed by the RII and SII values in Table 3.
Fig. 2
Age-standardized hospitalization rates due to intracranial injury according to area-level deprivation. Rates are shown in sex and study periods.
ICI = intracranial injury, Q1 = least deprived group, Q5 = most deprived group.
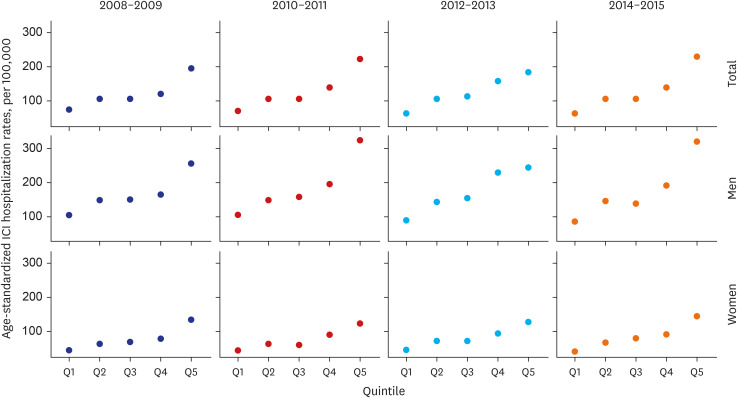
Table 2
Age-standardized hospitalization rates due to intracranial injury according to area-level deprivation
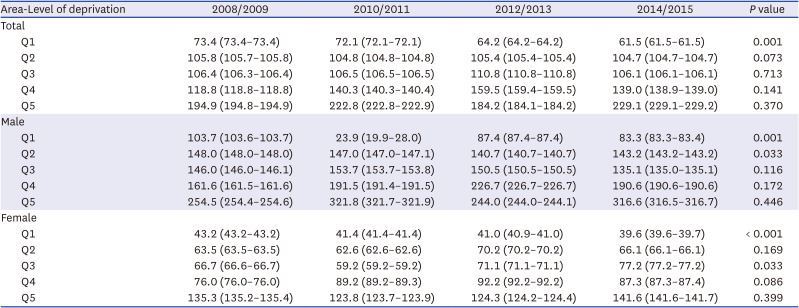
Table 3
Inequality indices of intracranial injury-related hospitalizations during the study periods
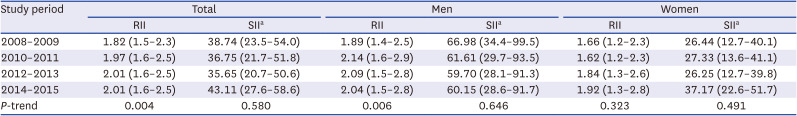
Both RIIs and SIIs are expressed with a 95% confidence interval within parentheses. The model for the total population was adjusted for sex, age group, and the interaction between sex and age group. The models for men and women were adjusted for the age group. The linear trends of RII and SII over time were assessed by adding an interaction term between the year group and the midpoints of area-level socioeconomic status.
RII = relative index of inequality, SII = slope index of inequality.
aAbsolute difference in rate per 100,000 population.
The RIIs in all groups and periods were greater than 1, suggesting that those living in the most deprived area had a higher risk of ICI-related hospitalization than those living in the least deprived area. In addition, because all the SIIs were positive, the absolute difference in the risk of hospitalization due to ICI was also greater in the most deprived area than in the least deprived area.
As with the age-standardized hospitalization rate, both the RIIs and SIIs of women were smaller than those of men. In addition, there were significant increasing linear trends in the RII between study periods in the total population and men (P-trend = 0.004 and P-trend = 0.006, respectively), indicating that relative inequalities were increasing. The RII for women also showed increasing changes, although these were insignificant (P-trend = 0.323). The temporal trend of SII in the total population and women showed an increase, and in men, it appeared to decrease; however, it was not significant in all groups (P-trend = 0.580, P-trend = 0.491, and P-trend = 0.646, respectively).
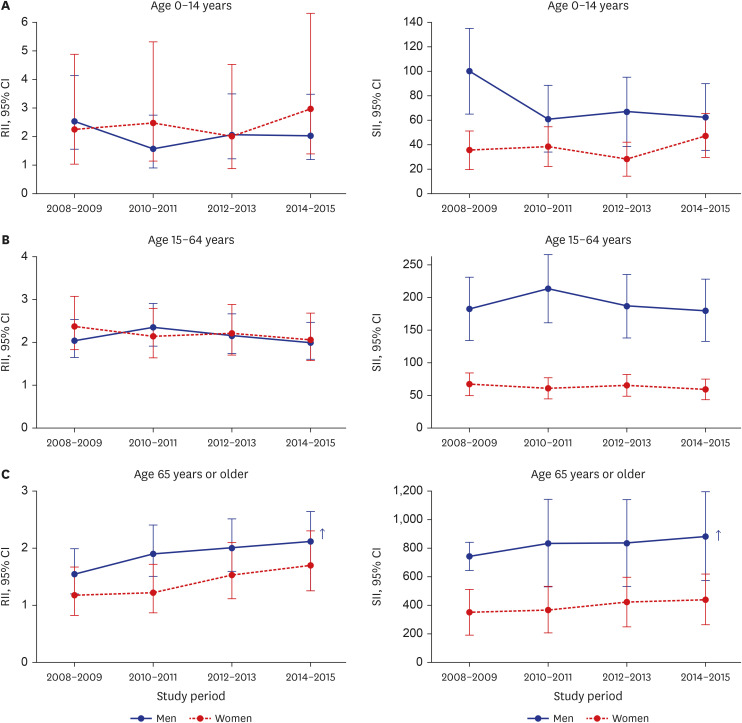
The RIIs and SIIs were stratified by age group and sex (Fig. 3, Supplementary Figs. 1 and 2). Among men aged 0–14 and 15–64 years, the RIIs and SIIs showed no linear trend. In contrast, there was a significant linear increase among men aged ≥ 65 years, with a P-trend = 0.013 for RII and a P-trend = 0.005 for SII. A similar trend was observed in women aged ≥ 65 years, although it was insignificant. In addition, no significant trend was observed in the other age groups in women.
Fig. 3
Time trends in the indices of inequality in intracranial injury-related hospitalization. Estimates are displayed by age group. SII indicates the absolute difference in rate per 100,000 populations. Arrows indicate a significant linear trend.
RII = relative index of inequality, SII = slope index of inequality, CI = confidence interval.
DISCUSSION
This study investigated the trends in ICI-related hospitalizations for 8 years by area-based socioeconomic inequalities in South Korea using nationwide hospital discharge surveillance. When the ICI-related hospitalization rates were compared relatively (RII) and absolutely (SII) according to area-based SES, a significant inequality was found between people living in the least deprived area and those living in the most deprived area during the period included in the study. This inequality in ICI-related hospitalization rate existed irrespective of age group or sex. Moreover, trend analysis showed that the relative inequality continued to become serious during the study period, especially among men aged 65 and older.
We used the hospitalization rate with specific ICD-10 codes as a surrogate outcome for the incidence of moderate-to-severe TBI. Clinically, TBI severity can be classified into mild, moderate, and severe using the Glasgow Coma Scale (GCS) score and the presence/absence of loss of consciousness, post-traumatic amnesia, impairment of mental state at the time of injury, and/or transient neurological deficits.3132 However, this classification does not predict the functional outcomes of patients, and the GCS scores may lead to a severity biased by drug, alcohol use, and sedative use at the time of injury.1333
As epidemiological studies of TBI depend on an accurate classification, it is important to use the appropriate classification.34 Although the ICD-based TBI definition is a feasible method to analyze the population-based dataset being used for TBI research, there is no consensus on the use of the ICD-10 codes to define TBI.35 Furthermore, the appropriateness of diagnosis using ICD-10 for the severity of TBI is debatable. Nonetheless, positive predictive values of the ICD-10 TBI surveillance code for detecting TBI through reviews of medical records have been proven; in particular, the ICI code S06 has a high positive predictive value to capture true TBI cases.36 Whereas some studies have found that the incidence of TBI-related hospitalizations tends to be underestimated, particularly concerning mild TBI,3738 other studies have shown that ICD-based codes are sensitive to severe TBI.39 In addition, Andelic’s study40 also found that 45% of patients diagnosed with S06 with a GCS score of 8 or less belonged to GCS 3–4 category, suggesting that S06 in ICD-10 may reflect severe TBI. Although concussions fall within the clinical spectrum of TBI, they may not be sufficiently severe to require routine hospitalization when they occur. Therefore, we decided not to include concussions in the diagnostic definition of ICI.
The deprivation index was used to denote the area-based SES of the patient’s residence in this study, similar to that for neighborhood SES. Area-based SES provides the socioeconomic profile of a geographic area, such as the availability of infrastructure and health-promoting services, that is not identified at the individual level.41 Although our findings may not reflect the individual-based socioeconomic trends,42 the use of area-based SES could help researchers identify associations for inequality in the incidence of TBI across neighborhoods. Moreover, our approach can lead to meaningful reductions in injury-related inequality outcomes; thus, it can be useful for implementing large-scale injury prevention policies.
Considering the causal relationship, the injury mechanism is believed to be a mediator. In the case of mediator adjustment, the effect of area-based SES on the inequality of hospitalization related to TBI can be identified, excluding the effects through injury mechanisms. However, the association between area-based SES and severe TBI may be across multiple factors such as sex, age group, type of injury mechanisms, safety behavior, and safety environment. Because this study intended to examine the overall association between area-based SES and the inequality of hospitalization related to TBI, we decided not to include the injury mechanism in the final analysis.
Previous studies have also shown that the proportion of death due to injuries is high among people with low SES living in disadvantaged areas.4344 These results suggest that area-based SES can affect an individual’s health because the nature of a community can affect the residents of that community.45 The reason for the area-based inequality in the incidence of TBI can be inferred from the effect of area-based SES on road traffic accidents (RTAs) and falls, which are the characteristic causes of TBI.2 For example, traffic volume, and road structure account for a significant proportion of inequality in road traffic injuries between poor and wealthy areas.46 In another study related to falls, the participation rate in exercise/physical activity for fall prevention was lower in the group living in disadvantaged neighborhoods than in the group living in affluent areas.47
Several studies have reported persistent injury inequalities.48 Despite the downward trends in the incidence and mortality of TBI in a previous study,3 our study showed that relative and absolute social inequalities in the incidence of TBI remained persistent and constituted major public health issues in South Korea. Magid et al.49 also found that inequality in RTAs between Arabs and Jews persisted even though the injury due to RTAs decreased over the past decade for both populations. This means that injury prevention programs should focus on vulnerable groups because the results of efforts to reduce RTAs vary by population.
Injury is known to have age-dependent characteristics,5051 and the most common cause of TBI in older adults are traffic accidents in men and falls in women.52 Although the incidence of RTA has decreased53 through the implementation of a program that improves the traffic environment and raises safety awareness, the results of these efforts may differ according to age and sex, as seen in the Israeli study by Magid et al.49 Therefore, the trend of increasing inequalities in TBI hospitalizations among older men indicates that intensive traffic environment improvement is needed in areas with low SES.
While there were several meaningful findings, our study has some limitations that restrict the generalizability of the results. First, because this study used the KNHDS data, the observed incidence of TBI may differ from the actual incidence. People with low SES or those living in medically disadvantaged areas may be less likely to visit a hospital because of limited finances/health insurance and/or poor access to hospitals than those living in affluent areas.54 Therefore, in this study, severe TBI, which strongly corresponds to ICI, was selected as the study target, and caution is needed in extending and interpreting the results of this study to the entire TBI spectrum. In addition, patients who died before hospitalization were not included in this data and only those who died after hospitalization were included. If death before hospitalization were to be included, there might be more differences between Q1 and Q5. Second, the deprivation index was used to measure health inequality between districts. The census data used to calculate the area-based deprivation index were obtained from the census surveys conducted every 5 years. Therefore, the deprivation index can also be calculated every 5 years. In this study, the deprivation index was calculated using the 2010 census, and it is possible that the socioeconomic level of the districts changed in a short period from 2008 to 2015. Finally, our analysis has a limitation in establishing an association with the place of occurrence. As presented in Table 1 and Supplementary Table 2, the place of occurrence differed depending on the area-based SES or sex. This may have contributed to the differences in hospitalization rates for moderate-to-severe TBI by area-based SES or sex. However, this variable couldn’t be included in the model because the number of weighted cases with unknown places of occurrence was 90,385. This issue arose from the medical record-based data collection system of KNHDS, and we couldn’t assume the random missing of this variable. If we had excluded these many cases with the unknown in place of occurrence, the analysis could have led to bias in the final model of revealing associations within other variables. Therefore, we excluded the place of occurrence to avoid potential selection bias and keep the power of the model.
In conclusion, our findings showed relative inequalities in ICI-related hospitalizations, which tended to become serious throughout the study period. Further, the results showed that these trends differed according to sex and age group. Currently, much of the ongoing and future research on injury prevention is focused on addressing the needs of vulnerable populations. Our approach in this study, i.e., measuring the health inequality in ICI hospitalization using area-based SES, has implications for prevention activities, programs, and policies.
 XML Download