

 PDF
PDF Citation
 Print
Print


INTRODUCTION
Glycation is a process by which glucose is irreversibly bound to the amino groups of proteins non-enzymatically. HbA1c is the most common form of glycated Hb, which is equivalent to HbA with a hexose attached to the N-terminal valine of one or both beta chains [1]. As the HbA1c concentration reflects the glycemic status of the last 2–3 months, it is widely used as a biomarker of long-term glycemia [2]. The American Diabetes Association guideline on the management of diabetes mellitus (DM) includes assessment of HbA1c concentration among the diagnostic criteria and treatment goal recommendations [3-5]. Therefore, accurate measurement of HbA1c is crucial for the diagnosis and management of patients with DM.
HbA1c measurement methods can be classified into three groups depending on the techniques employed to distinguish HbA1c from other forms of Hb: those based on charge differences, structural differences, and chemical reactivity [6]. Ion-exchange HPLC and capillary electrophoresis methods detect charge differences, whereas affinity chromatography and immunoassays detect structural differences to distinguish HbA1c. Ion-exchange HPLC uses cation exchange to extract HbA1c, whereas capillary electrophoresis separates charged molecules by the electrolyte pH, electroosmotic flow, and electrophoretic mobility of the molecule in alkaline buffer. Affinity chromatography uses an affinity column for binding HbA1c. Immunoassays employ antibodies that recognize a combination of the Amadori product and the first few amino acids at the N-terminus of the Hb β-chain. Enzymatic methods employ enzymatic reactions to measure HbA1c.
We evaluated the HbA1c measurement performance of the DxC 700 AU chemistry analyzer (Beckman Coulter, Brea, CA, USA) in comparison with another immunoassay device, the Cobas c 513 analyzer (Roche Diagnostics, Mannheim, Germany), as well as HPLC-tandem mass spectrometry (MS/MS) as the reference measurement procedure (RMP) approved by the International Federation of Clinical Chemistry and Laboratory Medicine (IFCC). The comparison also included samples with variant Hb to determine how different variant types affect the performance of different HbA1c measurement methods. For example, a newly discovered Hb variant, Hb Murica, was found to affect different HbA1c methods differently [7]. The variant type was genetically determined using direct sequencing and multiplex ligation-dependent probe amplification (MLPA).
METHODS
Samples
A total of 120 residual whole-blood patient samples collected in EDTA tubes from 2015 to 2022 for routine HbA1c measurement (ranging from 4.2% [22.4 mmol/mol] to 12.9% [117.5 mmol/mol]) were used in this prospective study. The study was conducted at Sinchon Severance Hospital (Seoul, Korea) and complied with all relevant national regulations, institutional policies, and tenets of the Declaration of Helsinki (as revised in 2013). This study was approved by the Institutional Review Board of Severance Hospital, Seoul, Korea (4-2020-0800), and the requirement for informed consent was waived.
Immunoassay devices
HbA1c values of the 120 samples were measured using two immunoassay analyzers: Cobas c 513 analyzer (Roche Diagnostics) and DxC 700 AU analyzer (Beckman Coulter). Both devices use the turbidimetric inhibition immunoassay method with whole blood (treated with EDTA or heparin as an anti-coagulant) as the sample type. The Cobas c 513 analyzer was operated in batch mode with a throughput of 400 tests/hr. The DxC 700 AU analyzer was also operated in batch mode and random-access mode and could process up to 800 tests/hr. Cobas c 513 and DxC 700 AU are traceable to the National Glycohemoglobin Standardization Program (NGSP) and IFCC, respectively.
Accuracy using non-variant Hb samples
Twenty additional samples of varying HbA1c concentrations (4.9%–12.3% [30.1–110.9 mmol/mol]) were obtained for accuracy determination in May 2022. HbA1c was measured in these 20 samples using both the Cobas c 513 and DxC 700 AU analyzers. The residual portions were analyzed with HPLC-MS/MS as the IFCC RMP [8]. Red blood cells were isolated by centrifugation and lysed [8]. The hemolysates were sent to the Korea Centers for Disease Control and Prevention (KCDC) for HbA1c analysis using the IFCC RMP. The allowable total error rate was 6.7% [9]. The HbA1c concentration representing a pre-diabetic state (5.7% [38.8 mmol/mol)] and a diabetic state (6.5% [47.5 mmol/mol]) served as the medical decision points [4, 10].
Accuracy using variant Hb samples
Fourteen residual whole-blood samples that tested positive for variant Hb on routine Hb electrophoresis (EP) between 2015 and 2021 were selected to obtain a diverse variant pool. HbA1c was measured in the 14 variant Hb samples using Cobas c 513. Six variant Hb samples collected before April 2018 were analyzed using the Cobas Integra 800 analyzer instead of the Cobas c 513 analyzer. These samples were stored at −80°C until August 2021, when they were thawed and analyzed using the DxC 700 AU analyzer. For genetic analysis, 200 µL of each sample was aliquoted into separate microtubes. The remaining samples were pre-treated for conversion into hemolysates and sent to the KCDC for HbA1c measurement using the RMP (HPLC-MS/MS). The pre-treatment consisted of a lysis step followed by centrifugation, after which the pellet was discarded. The samples used for the RMP and DxC 700 AU detection were stored at −80°C for at least 1 month (in some cases up to 5 years), whereas fresh samples (no older than a few days and never frozen) were used in the other devices. We postulated that a meaningful portion of the percent difference would be attributable to this incongruity in the storage conditions. Therefore, we applied a 10% difference cut-off (allowable total error rate) in these variant Hb samples rather than the strict cut-off value of 6.7%.
Linearity and precision
To verify the linearity of HbA1c measured using DxC 700 AU, QC material from the Bio-Rad HbA1c Linearity Set (Bio-Rad Laboratories, Hercules, CA, USA) was used. Six different concentrations were analyzed twice. Recovery was assessed as the percentage of measured concentrations relative to the expected concentrations ([mean of repeated measured concentrations/expected concentration]×100), and the allowable range was set at 90%–110%.
To verify precision, the low- and high-concentration HbA1c QC materials (HbA1c Liquid Control Set, extendSURE, Christchurch, New Zealand) were measured twice daily for 20 days using two DxC 700 AU devices (referred to as Device I and Device II). The CV (%) was calculated as described in the CLSI document EP05-A3 [11]. The acceptable intra-laboratory %CV was 4% [11].
Carryover
Among the 120 samples collected, one sample each with low and high concentration was selected for the carryover analysis. The presence of sample carryover was evaluated by four consecutive measurements of high (12.30% [110.9 mmol/mol]) HbA1c concentrations (H1–4), followed by four consecutive measurements of low (4.70% [27.9 mmol/mol]) HbA1c concentrations (L1–4). The carryover ratio was calculated according to the following equation: (L1−[L3+L4]/2×100)/([H2+H3]/2 −[L3+L4]/2), and a value of 1.0% was used as the reference value, as described in the CLSI EP10-A3 guideline [12].
Genetic analysis
The 14 variant Hb samples underwent either HBA1/HBA2 MLPA, HBA1/HBA2 sequencing, HBB MLPA, HBB sequencing, or all of the above in sequential order, depending on the pattern of peaks obtained using Hb EP and whether mutations were detected in prior genetic analyses. DNA was extracted using a QIAamp DNA Blood Mini Kit (Qiagen, Valencia, CA, USA). MLPA was performed using a SALSA MLPA Probemix P140 HBA system (MRC Holland, Amsterdam, the Netherlands) and a 3730 DNA analyzer (Applied Biosystems, Waltham, MA, USA). BigDye Terminator v3.1 Cycle Sequencing Kit (Applied Biosystems) and 3730 DNA Analyzer (Applied Biosystems) were used for direct sequencing. The obtained sequences were analyzed using Sequencher 5.3 (Gene Codes Corporation, Ann Arbor, MI, USA).
Statistical analysis
Microsoft Excel 2013 (Seattle, WA, USA), Analyse-it for Microsoft Excel method evaluation edition version 5.40.2 (Analyse-it Software, Ltd., Leeds, UK), Statistical Package for the Social Sciences (SPSS) v.23 (SPSS Inc., Chicago, IL, USA), and Prism 8.0 (GraphPad Software, Inc, La Jolla, CA, USA) were used for statistical analyses. Passing–Bablok regression and Bland–Altman analysis were used for the comparison analysis, and only Passing–Bablok regression was used for the accuracy analysis.
RESULTS
Comparison between Cobas c 513 and DxC 700 AU results
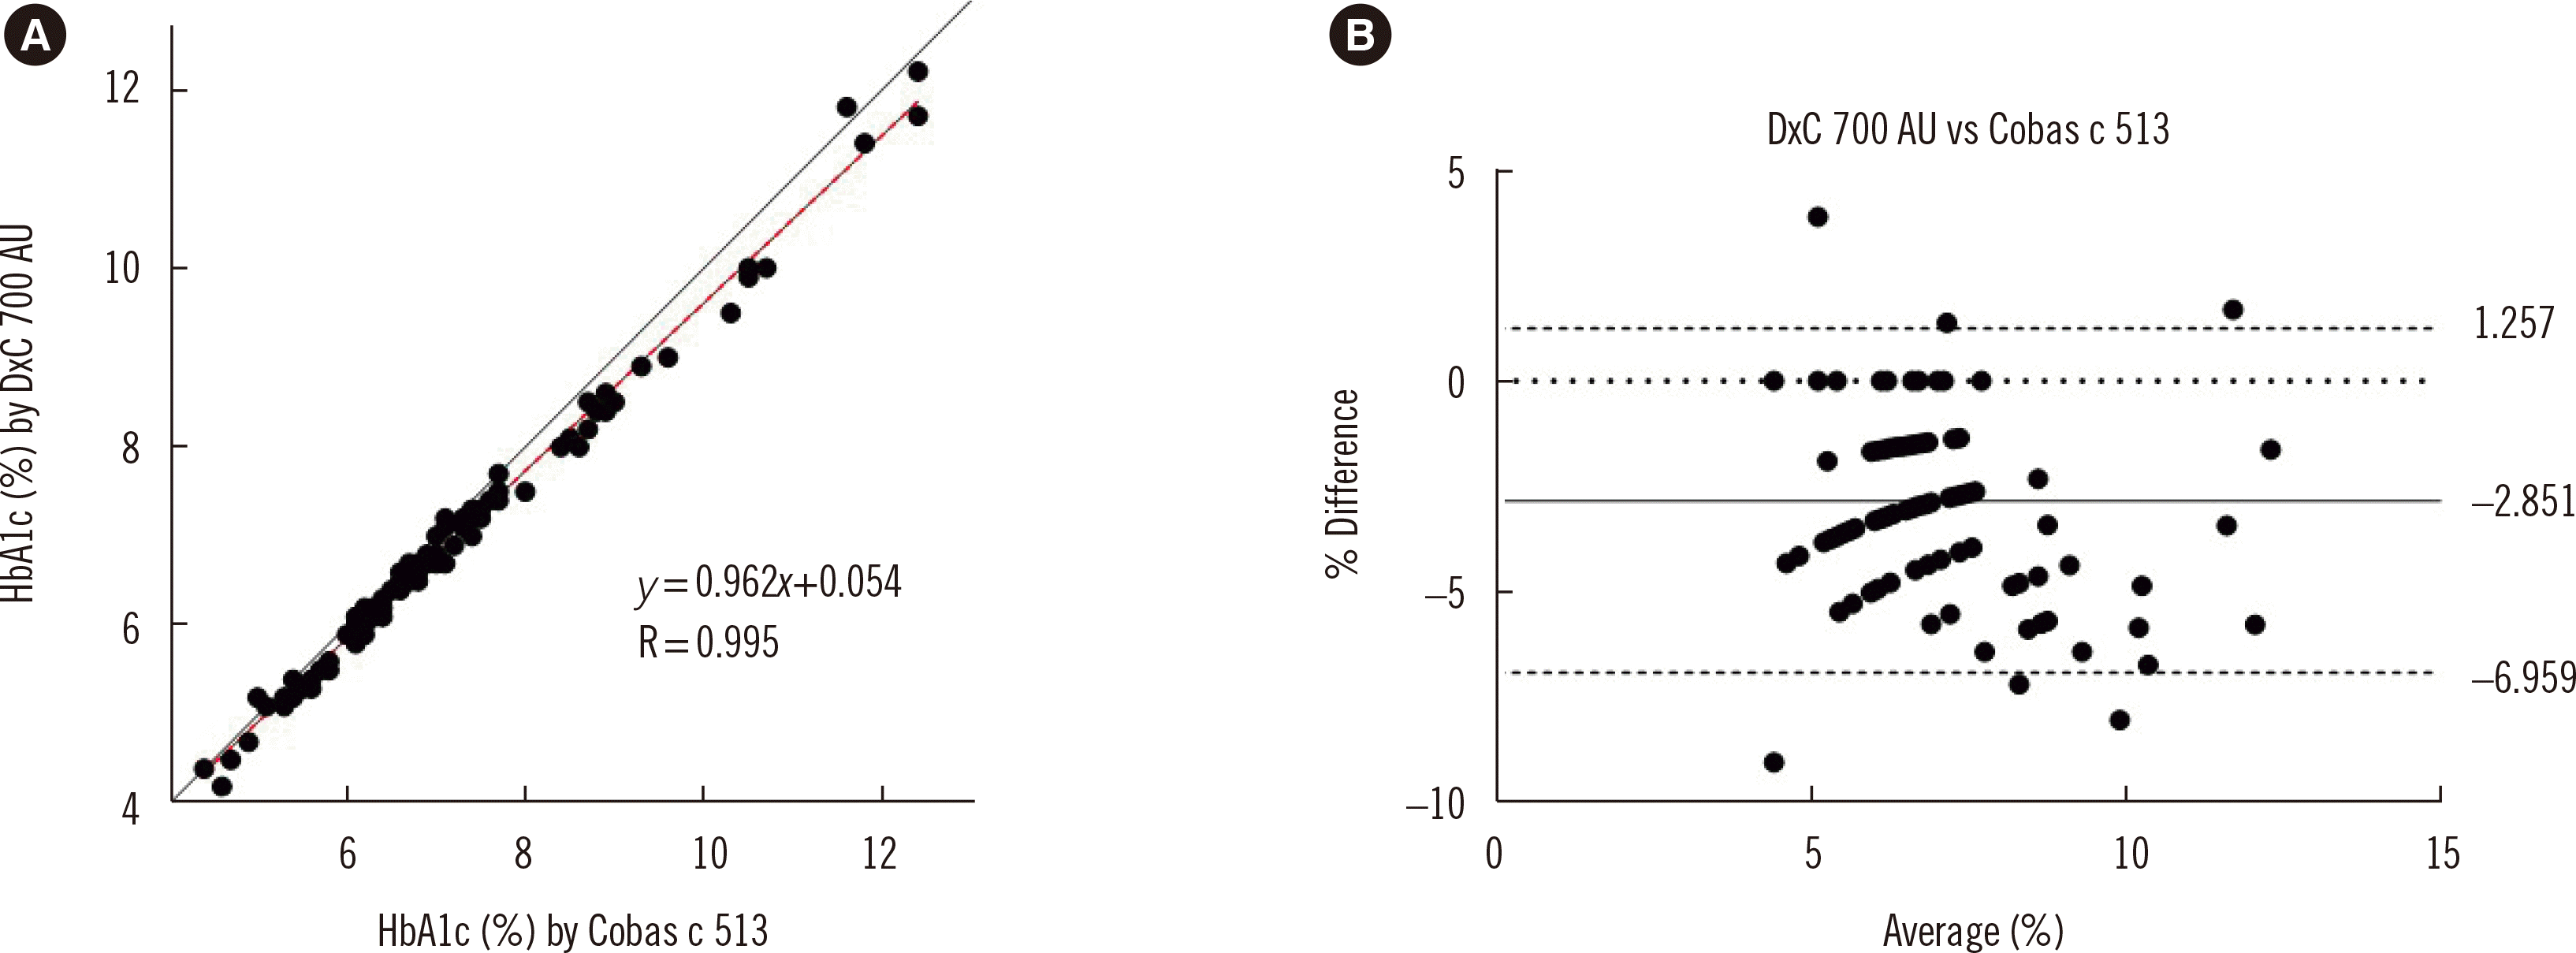
Fig. 1 compares the Cobas c 513 and DxC 700 AU results. The equation of the Passing–Bablok regression line was y=0.962x+ 0.054 (slope 95% confidence interval [CI]: 0.921 to 1.000; Y-intercept 95% CI: −0.200 to 0.334), and the correlation coefficient was 0.995. The average bias between the methods was −2.9% (DxC 700 AU–Cobas c 513), with no specific trend noted as HbA1c concentrations increased.
Linearity
The six different concentrations included in the Bio-Rad Hemoglobin A1c Linearity Set were measured twice. The equation for the linear regression line was y=1.008χ−0.215, and its determination coefficient was 1.000. The recoveries at all six concentrations were within 90%–110% (exact range was 92.9%–100.2%).
Precision and carryover
The within-run, between-run, between-day, and total imprecision for the low-concentration (6.0% [42.1 mmol/mol]) and high-concentration (9.9% [84.7 mmol/mol]) samples were evaluated for devices I and II. The exact values are presented in Table 1. The calculated carryover ratio between high and low HbA1c was −0.66, which was below the preset acceptance criterion of 1.0%.
Accuracy using non-variant Hb samples
Regression analysis of HbA1c values for the 20 non-variant samples obtained using DxC 700 AU compared with those obtained using the reference method (HPLC-MS/MS) yielded a slope of 1.000 (95% CI: 0.941 to 1.059) and a Y-intercept of 0.000 (95% CI: −0.366 to 0.421). The percentage difference between the two medical decision points was 0.0% (Table 2).
Accuracy using variant Hb samples and genetic analysis
Variants included those of both alpha and beta globins, causing hemoglobinopathies and thalassemias, including three alpha thalassemias (variants 10, 11, and 12), one alpha hemoglobinopathy (variant 3), one beta-thalassemia (variant 13), and eight beta-hemoglobinopathies. The last sample (variant 14) did not contain a variant of Hb but instead had an elevated HbF value as it was drawn from a newborn. The EP results and whether they significantly affected the HbA1c concentrations measured by the different devices are summarized in Table 3. The result was considered to be affected by presence of a variant if the percentage difference compared with the reference method was >10%. The DxC 700 AU result was affected only by the high HbF in the newborn sample and one case of abnormal HbH. The Cobas device result was affected by one case of heterozygote Hb Yamagata (Integra) and the case of beta-thalassemia (Cobas c. 513). Among the 14 variant samples, variant 13 demonstrated an unexpected result upon HBB sequencing. The zone EP pattern showed a large peak in zone D (57.2%) and a small peak in zone S (5.1%), while HbA2 decreased to 0.3%.
DISCUSSION
Both the DxC 700 AU and Cobas c 513 analyzers rendered accurate results in measuring HbA1c in 20 samples without variant Hb compared with the reference method (HPLC-MS/MS). The predicted values at two medical points (5.7% [38.8 mmol/mol] and 6.5% [47.5 mmol/mol]) were within the allowable total error range of ±6.7%.
DxC 700 AU showed excellent agreement with Cobas c 513; there was no proportional or constant difference between the methods. The percent bias between DxC 700 AU and Cobas c 513 was within the allowable total error interval of ±6.7%. DxC 700 AU results were linear over a wide HbA1c range (3.39%–18.3% [13.6–176.5 mmol/mol]). The within-run, between-run, between-day, and total CV values were all <2%. No carryover effect was observed, indicating that reliable measurements can be obtained even when samples of different concentrations are ordered randomly, as is the case in true clinical settings.
Many factors can interfere with HbA1c measurements, such as various types of anemia, acute and chronic blood loss, splenic state, several medications, and variant Hbs [13]. The most common Hb variants are HbS, HbE, HbC, and HbD, in descending order of prevalence [14]. HbS has a valine residue in place of glutamic acid at position 6 of the beta chain, whereas HbC has a lysine residue at the same position. HbE harbors glutamic acid at position 26 of the beta chain rather than lysine, and HbD has glutamine instead of glutamic acid at position 121 [15]. Because HbS and HbC have substitutions near the N-terminus of the Hb beta chain, some immunoassays are affected by their presence. As HbE and HbD substitutions are located much further down the beta chain, they rarely affect measurement by immunoassay methods.
The prevalence of Hb variants among Koreans is unique; instead of the four most common variants worldwide, Hb G-Coushatta (β22Glu → Ala) and Hb Queens (α34Leu → Arg) are the most common beta and alpha chain variants, respectively [8]. Other variants found in the Korean population include Hb Yamagata (β), Hb Beckman (β), and Hb Ube-4 (α). Approximately half of the Hb variants analyzed in our study were from foreigners, mostly Southeast Asians, meaning that diverse variants were included in this analysis.
In case of variant 13, when the molecular analysis result indicated beta-thalassemia caused by a nonsense mutation in HBB, the peak in zone D and the decreased HbA2 concentration could only be explained if the patient also carried a mutation in HBD. Faten, et al. [16] reported a similar case in 2019, in which the proband was affected by beta-thalassemia intermedia and also had a mutation in HBD, resulting in an electrogram indicating a low HbA2 concentration. We did not have the appropriate tools to analyze the HBD gene; thus, the presence of an HBD variant could not be verified. Taking into account the considerable bias this Hb variant had on HbA1c measurement using an immunoassay method, it is considered that the HBD mutation is located within the codons near the N-terminus of the peptide chain.
There were two samples with classical HbH variants (variants 11 and 12); however, DxC 700 AU gave a biased HbA1c value to only one of them. The only difference between these two samples was the proportion of variant Hb: the affected sample (percentage difference compared to reference sample >10%) had a higher proportion of variant Hb than the non-affected sample. This may have contributed to the different degrees of bias in these two samples.
The variant identified in sample number 14 was drawn from a newborn; thus, it was rich in HbF. DxC 700 AU was the only device affected by the high HbF concentration. Interference by HbF is expected for immunoassay-based devices because HbA1c antibodies cannot recognize glycated HbF, whereas total Hb includes HbF, resulting in an artificially lowered HbA1c value [17]. Cobas c 513 was also expected to be affected by high HbF; a previous study reported a negative bias at HbF concentrations >10% with this device [18]. The actual percent bias in the present study was –9.8% (Table 3), which was barely below the cut-off value of 10%. Although the Cobas c 513 HbA1c value was deemed as “not affected” according to the cut-off value (10%) set for variant samples, it cannot be concluded that Cobas c 513 did not show a negative bias in the case of high HbF.
Our study had some limitations. First, we used stored samples for cases with variant Hbs. This may have induced additional disparity due to the freeze-thaw process and temporal differences in the variant Hb samples used to measure HbA1c in these devices. HbA1c of samples with variant Hb was measured using the Cobas c 513 or Cobas Integra 800 analyzer immediately after variant Hbs were verified using EP. Samples were then stored at −80°C for as long as 5 years in some cases until HbA1c concentrations were measured using HPLC-MS/MS and the DxC 700 AU analyzer. The presence of Hb variants may have also affected the red cell lifespan, which is known to affect HbA1c concentrations [19].
Overall, the analytical performance of the DxC 700 AU analyzer was acceptable; it was accurate, precise, and linear over a wide HbA1c range. We observed a high correlation between the results of DxC 700 AU and Cobas c. 513. The accuracy of DxC 700 AU did not fall drastically except in the rare cases mentioned above. Caution should be exercised when measuring HbA1c concentrations in patients with high HbF and HbH. These results support the conclusion that the DxC 700 AU chemistry analyzer can be safely used to measure HbA1c concentrations and assess the long-term glycemic status of patients with diabetes.
 XML Download