

 PDF
PDF Citation
 Print
Print


INTRODUCTION
Excessive sugars intake has been shown to be detrimental to human health [12345]. Dietary Sugars, which refer to monosaccharides and disaccharides, are consumed in the form of sugars naturally present in foods and also those added to foods during food processing by the manufacturer, food preparation by the cook, or at the table by the consumer [6]. There is no evidence that the consumption of natural sugars or foods high in natural sugars (e.g., milk and fruits) has adverse effects on health, but excessive consumption of added sugars has been reported to increase the risk of obesity, diabetes, cardiovascular diseases, and cancer [2345]. Therefore, the World Health Organization strongly recommends reducing the intake of free sugars, including all sugars added to foods plus those naturally present in honey, syrup, and fruit juices, to less than 10% of total energy intake (% TE) [3]. The US recommends that added sugars intake should be reduced to less than 10% TE [7]. In contrast, the Dietary Reference Intakes for Koreans suggests that total sugars, including both natural and added sugars, should be within 10–20% TE [8]. Although the terminology used in guidelines varies and the cutoffs are slightly inconsistent, health authorities and governments are currently making efforts to reduce dietary sugars intake. A recent study that reviewed multiple national nutrition surveys showed that, although worldwide dietary sugars intake is decreasing or remains stable, it still remains above recommendation [9]. Although for Koreans the mean intake of total sugars is within the recommended range, the intake exceeds the cutoff in some subgroups (e.g., children and young adults), highlighting the need for intervention [10].
Ultra-processed foods have been demonstrated to drive excessive sugars intake [1112131415]. These foods are industrial products manufactured from substances extracted from foods or derived from food constituents and synthesized from organic sources, with little or even no whole food [16]. They include sugar-sweetened drinks, snacks and cookies, chocolate, candies, breads and cakes, breakfast cereals, and diverse types of instant foods and ready-to-eat products. These foods are typically high in sugars, fat, and salt, energy density, and low in fiber, protein, minerals, and vitamins [1617]. There is growing evidence of a significant positive, linear association between ultra-processed food consumption and added or free sugars intake [1112131415], thereby suggesting that reducing ultra-processed food consumption could be an effective way of limiting excessive sugars intake. However, there is no evidence on the ultra-processed food consumption of Koreans and its association with dietary sugars intake. Therefore, this study aimed to estimate the contribution of ultra-processed food consumption to total sugars intake, and to investigate the association between ultra-processed food consumption and total sugars intake in Koreans.
SUBJECTS AND METHODS
Study population
This study used data from the Korea National Health and Nutrition Examination Survey (KNHANES), 2016–2018. KNHANES is a continuous, nationwide, cross-sectional survey that provides diverse information about the health and nutrition status of Koreans aged 1 year or older. KNHANES consists of health interviews, health examinations, and nutrition surveys. The survey protocols and procedures were approved by the Institutional Review Board (2018-01-03-P-A) of the Korea Disease Control and Prevention Agency (KDCA). Written informed consent was obtained from all participants.
In the KNHANES 2016–2018, a total of 31,639 individuals aged 1 year or older were sampled. Among them, 24,269 (76.6%) participated in at least one of the three component surveys. Of these, 21,271 completed a 24-h dietary recall of the nutrition survey. This study included 21,075 participants for which 24-h dietary recall data was available and were not pregnant or breastfed at the time of the survey.
Dietary assessment
Dietary intake was assessed via a 24-h recall. A trained dietitian surveyed details of foods and beverages consumed on the recall day using the multi-pass method, similar to the US Department of Agriculture (USDA) Automated Multi-Pass Method [18]. Individuals provided information on food description, quantity, and preparation method of each food item they consumed both within and outside the home, as well as additional details including time, place, accompanying meals, and so on. All food items were coded and edited. For a dish (i.e., multi-ingredient food such as Bibimbap), dietary information was disaggregated into individual ingredients by applying the participant’s home recipe for the dish or the standard recipe developed for the KNHANES [192021]. Dietary energy and nutrient intake were calculated by applying the food composition database to food intake data [192021]. The food composition database used until 2015 did not include the total sugars content in food, but recently KDCA has established a database for total sugars content, permitting to evaluate dietary total sugars intake of Koreans since 2016 [22]. More details on dietary assessment methods and databases applied in nutrient intake calculation can be found elsewhere [17192021].
Food classification according to processing
For this study, we used the food information derived from the raw dataset released by the KDCA. In the 24-h dietary recall of KNHANES 2016–2018, a total of 3,894 food items were reported to be consumed either on their own or as ingredients in dishes. All reported items were classified into one of the four NOVA food groups and subgroups within each NOVA group. The NOVA food classification system classifies foods based on the nature, extent, and purpose of food processing [1623], and comprises the following groups: group 1, unprocessed or minimally processed foods; group 2, processed culinary ingredients; group 3, processed foods; and group 4, ultra-processed foods. More details on the NOVA system and food classification are described elsewhere [161723]. Briefly, unprocessed or minimally processed foods include raw foods directly obtained from natural or minimally altered foods without any additional ingredients (e.g., natural raw food, dried, ground, crushed, frozen, or vacuumed packed foods). Processed culinary ingredients are foods derived from group 1 foods or from nature via processing such as pressing, extracting, and refining (e.g., plant oil, sugar, animal fat, salt). These foods are usually used when cooking and seasoning group 1 foods. Processed foods are food products made by adding group 2 foods to group 1 foods (e.g., canned fish, fruit jam, and fermented food). The main purpose of this processing is to store group 1 foods for a long time and to improve their sensory qualities. These foods are edible by themselves and in combination with other foods. Finally, ultra-processed foods are products formulated mostly or entirely with industrial substances derived from foods and additives. These foods contain little or no group 1 foods and are generally created for the pursuit of convenience (i.e., easy consumption anytime and anywhere), high palatability, and profit. Ultra-processed foods include sugar-sweetened beverages (SSBs), soft drinks, packaged snacks, confectionaries, and diverse types of instant foods.
Sociodemographic variables
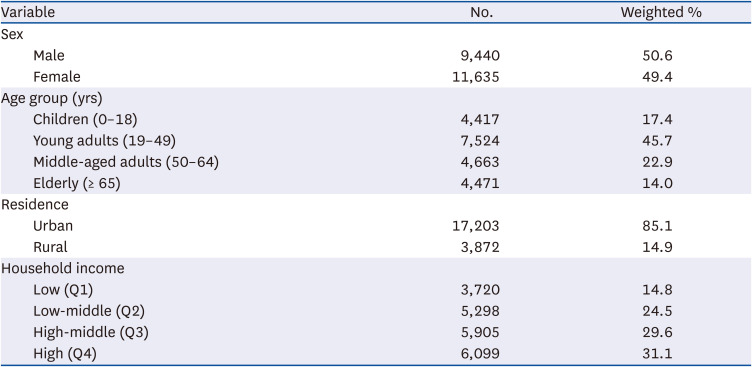
This study included sex, age, residential area, and income as sociodemographic variables. Sociodemographic variables were categorized as follows: sex (male and female), age (1–18 years, 19–49 years, 50–64 years, and 65 years or older), residential area (urban and rural), and income (lowest: quartile 1–highest: quartile 4).
Statistical analysis
We estimated dietary energy and total sugars intake for the entire population according to the NOVA food groups and subgroups. Energy intake from each food group was expressed as absolute (kcal/day) and relative intake (% TE). Total sugars intake was expressed as absolute intake (g/day), relative intake (% TE and % of total sugars intake), and the proportion of energy from total sugars among energy intake within each food group (%). We also compared the average intake of energy and total sugars according to the four NOVA food groups by sex and age groups and tested whether the intake differed by sex and age groups.
Next, we estimated total sugars intake (% TE) and the prevalence of excessive total sugars intake (≥ 20% TE from total sugars) across quartiles of dietary energy contribution of ultra-processed foods. This cutoff (≥ 20% TE from total sugars) is the upper limit recommended by the Korean Nutrition Society (KNS) [8]. Crude and adjusted logistic regression analyses were performed to estimate the prevalence ratio (PR) and 95% confidence interval (CI) for the association between quartiles of ultra-processed foods (% TE) and the prevalence of excessive total sugars intake. In the adjusted models, sex, age group, residence area, and income were included as cofounding factors. Linear trends were tested using the median value of ultra-processed food consumption (% TE) for each quartile. We additionally assessed whether the total sugars intake (% TE) increased across quartiles of ultra-processed foods using linear regression analyses. All analyses were stratified by sex and age. For subgroup analyses, sex- and age-specific quartiles of ultra-processed food consumption were used.
According to the comprehensive action plan for reducing sugars consumption launched by the Korea Ministry of Food and Drug Safety (KMFDA) in 2016, sugars intake should be less than 10% TE from processed foods. Thus, we additionally analyzed the association between ultra-processed food consumption and total sugars intake based on the standards recommended by the KMFDA. We calculated the total sugars intake from both processed and ultra-processed foods (% TE) of NOVA food groups and estimated the prevalence of excessive total sugar intake, defined as ≥ 10% TE from total sugars from both processed and ultra-processed foods. Total sugars intake and the prevalence of excessive total sugars intake from processed and ultra-processed foods were presented according to quartiles of energy contribution of ultra-processed foods. Crude and adjusted logistic regression analyses were performed to assess whether the prevalence differed across quartiles of ultra-processed foods. Adjustments were made for sex, age group, residence area, and income. Linear trends were tested using the median of ultra-processed food consumption (% TE) of each quartile. Linear regression analyses were used to assess whether the total sugars intake from processed and ultra-processed foods (% TE) increased across quartiles of ultra-processed foods. Subgroup analyses were performed in a similar manner.
Sample weights and survey designs were considered in all analyses. PROC SURVEYMEANS, PROC SURVEYLOGISTIC, and PROC SURVEYPREG procedures were used. Data analyses were performed using SAS software (version 9.4; SAS Institute, Cary, NC, USA), and results were regarded as significant at a P-value < 0.05.
RESULTS
Survey-weighted proportion of the study population are depicted in Table 1.
Table 1
Distribution of study population
Dietary intake of total energy and total sugars by food groups
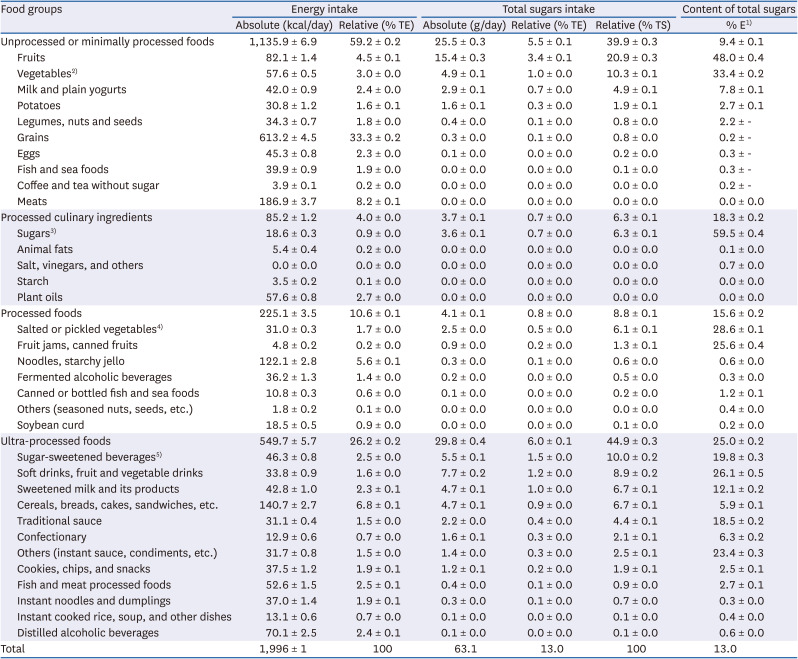
The average daily energy intake among Koreans aged 1 year or older was 1,996 kcal, with 26.2% TE arising from ultra-processed foods (Table 2). The average total sugars intake was 63.1 g and total sugars accounted for 13.0% TE. Nearly half of the daily total sugars intake (44.9%) came from ultra-processed foods. The contribution of total sugars to energy intake in each food group was 9.4% TE in unprocessed or minimally processed foods, but that within ultra-processed foods was up to 25.0% TE.
Table 2
Dietary intake of total energy and total sugars according to NOVA food groups and subgroups
Data are presented as mean ± SE.
This analysis was performed using 1-day 24-h dietary recall data from the KNHANES 2016–2018 (n = 21,075). The complex KNHANES sampling design and the sample weights were accounted for in this analysis.
TE, total energy intake; TS, total sugars intake; KNHANES, Korea National Health and Nutrition Examination Survey.
1)% of energy from total sugars intake within each food group.
2)Vegetables include mushrooms and seaweeds.
3)Sugars include sugar, honey, and molasses.
4)Salted or pickled vegetables include diverse types of kimchi.
5)Sugar-sweetened beverages include coffee or tea products with added sugar or milk, cocoa, or other sugar-sweetened beverages.
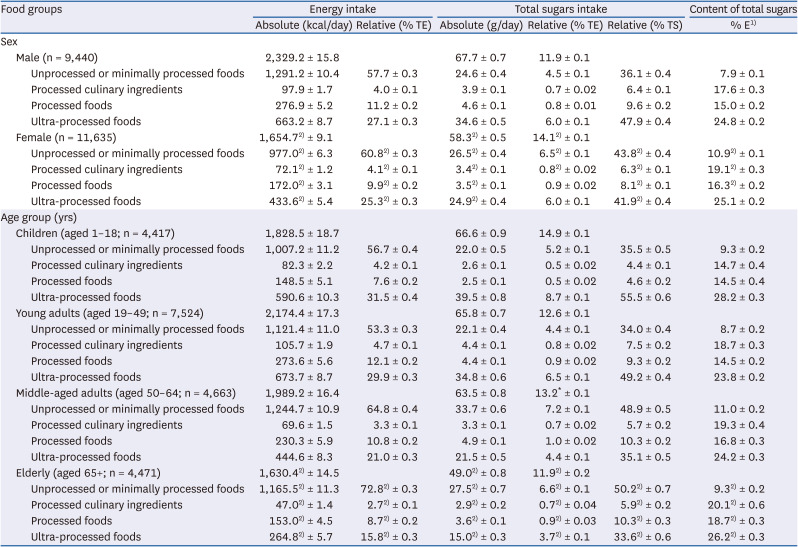
Table 3 shows the dietary intake of total energy and total sugars according to the four NOVA food groups by sex and age groups. The consumption of ultra-processed foods (% TE) was higher in males and in the younger population (both P < 0.001). The absolute intake of total sugars was slightly higher in males, but the relative intake to total energy (% TE) was higher in females (both P < 0.001). Males consumed nearly half (47.9%) of daily total sugars from ultra-processed foods, whereas females presented a total sugars intake from ultra-processed foods lower than that of males (41.9%) and instead consumed more total sugars from unprocessed or minimally processed foods (all P < 0.001). By age group, both absolute and relative intake of total sugars were higher in the younger population (all P < 0.001).
Table 3
Dietary intake of total energy and total sugars according to NOVA food groups by sex and age groups
Data are presented as mean ± SE.
This analysis was performed using 1-day 24-h dietary recall data from the KNHANES 2016–2018 (n = 21,075). The complex KNHANES sampling design and the sample weights were accounted for in this analysis.
TE, total energy intake; TS, total sugars intake; KNHANES, Korea National Health and Nutrition Examination Survey.
1)% of energy from total sugars intake within each food group.
2)P-value < 0.05 of differences in mean dietary intakes between sex and age groups.
Association between ultra-processed food consumption and total sugars intake
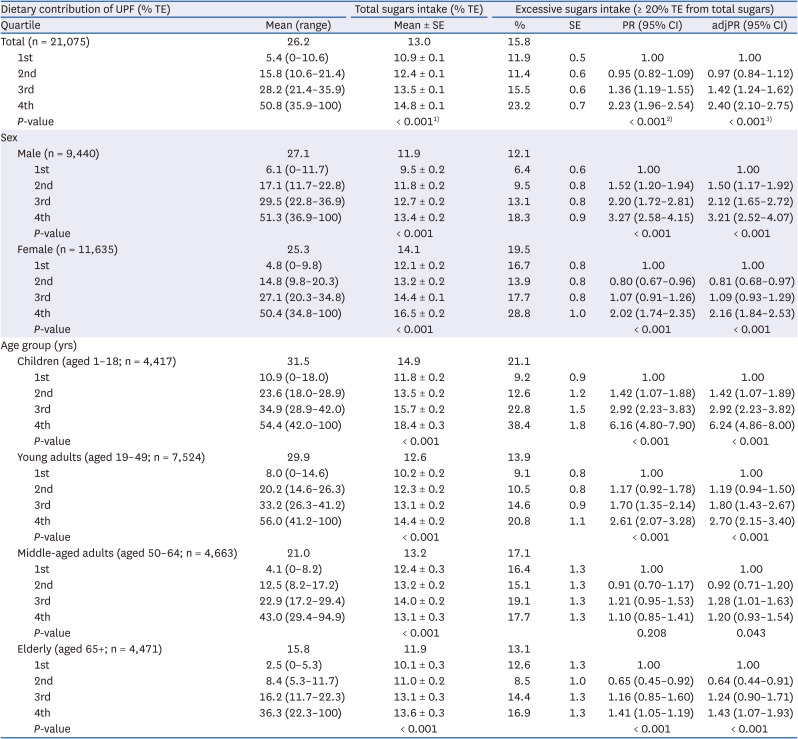
Among the entire population, 15.8% exceeded the upper limit for total sugars (20% TE) recommended by the KNS (Table 4). Excessive total sugars intake was more prevalent among females (19.5%) and children (21.1%). The prevalence of excessive total sugars intake showed a significant increasing tendency across the quartiles of ultra-processed food energy contribution, ranging from 11.9% in the lowest quartile to 23.2% in the highest quartile. After adjusting for sociodemographic variables, ultra-processed food consumption was positively associated with the prevalence of excessive total sugars intake (P for trend < 0.001). The adjusted PR of excessive total sugars intake was 2.40 (95% CI, 2.10–2.75) in the highest quartile of ultra-processed food energy contribution compared with the lowest. Similar associations were observed in all subgroup analyses stratified by sex and age.
Table 4
Associations between dietary contribution of UPF and total sugars intake
This analysis was performed using 1-day 24-h dietary recall data from the KNHANES 2016–2018 (n = 21,075). The complex KNHANES sampling design and the sample weights were accounted for in this analysis.
UPF, ultra-processed foods; TE, total energy intake; PR, prevalence ratio; CI, confidence interval; adjPR, adjusted prevalence ratio; KNHANES, Korea National Health and Nutrition Examination Survey.
1)P-values of differences in total sugars intake (% TE) across quartiles of UPF consumption were derived from linear regression analyses after adjustment for sex, age group, residence area, and income.
2)P for trend of crude PR of excessive total sugars intake across quartiles of UPF consumption.
3)P for trend of adjPR of excessive total sugars intake across quartiles of UPF consumption. Sex, age group, residence area, and income were mutually adjusted in the analyses of the entire population and each subgroup.
Association between ultra-processed food consumption and total sugars intake from both processed and ultra-processed foods
Table 5 shows the association between ultra-processed food consumption and excessive total sugars intake based on the recommendation of the KMFDA. Among the entire population, 22.1% consumed more than 10% TE from total sugars from both processed and ultra-processed foods. Excessive total sugars intake from both processed and ultra-processed foods was more prevalent in females (21.3%) and children (37.3%).
Table 5
Associations between dietary contribution of UPF and total sugars intake from PF and UPF
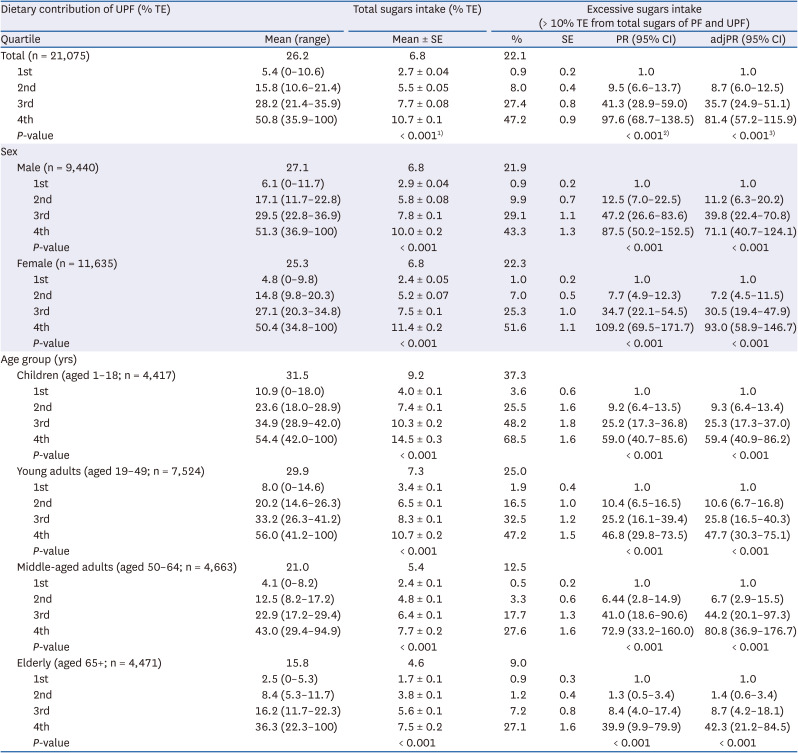
This analysis was performed using 1-day 24-h dietary recall data from the KNHANES 2016–2018 (n = 21,075). The complex KNHANES sampling design and the sample weights were accounted for in this analysis.
TE, total energy intake; PF, processed foods; UPF, ultra-processed foods; PR, prevalence ratio; CI, confidence interval; adjPR, adjusted prevalence ratio; KNHANES, Korea National Health and Nutrition Examination Survey.
1)P-values of differences in total sugars intake (% TE) across quartiles of UPF consumption were derived from linear regression analyses after adjustment for sex, age group, residence area, and income.
2)P for trend of crude PR of excessive total sugars intake across quartiles of UPF consumption.
3)P for trend of adjPR of excessive total sugars intake across quartiles of UPF consumption. Sex, age group, residence area, and income were mutually adjusted in the analyses of the entire population and each subgroup.
The prevalence of excessive total sugar intake from both processed and ultra-processed foods showed a significantly increasing tendency across the quartiles of ultra-processed food energy contribution, ranging from 0.9% in the lowest quartile to 47.2% in the highest quartile. After adjusting for sociodemographic variables, ultra-processed food consumption still had a strong positive association with excessive total sugars intake from both processed and ultra-processed foods (P for trend < 0.001).
DISCUSSION
This study estimated the contribution of ultra-processed food consumption to total sugars intake and assessed whether ultra-processed food consumption is associated with total sugars intake using data from a recent national nutrition survey. In the Korean diet, the mean consumption of total sugars was 13.0% TE, and nearly half (44.9%) of total sugars intake came from ultra-processed foods. Among the entire population, 15.8% consumed more than the recommended limit of 10% TE from total sugars. Ultra-processed food consumption had a significantly positive linear association with total sugars intake as well as excessive intake of total sugars. Such associations were similarly found regardless of sex and age groups.
Excessive dietary sugars intake is a worldwide problem, although sugars intake seems to be slightly decreasing or stable in some countries and regions [9]. A previous study using data from the National Health and Nutrition Examination Survey 2011–2018 reported the average added sugars intake of the US population to be 67.8 g/day, corresponding to 12.7% TE [24]. The UK National Diet and Nutrition Survey 2008–2014 found that 12.4% of total energy was obtained by consuming free sugars [11]. In recent epidemiologic studies of eight Latin American countries, the mean total sugars intake was 99.4 g/day, which accounted for 20.1% TE, and 65.9% (65.5 g/day) came from added sugars, which accounted for 13.2% TE [25]. Although the total dietary sugar intake of Koreans estimated in our study was not as high as that of other countries, it was not lower than that of the KNHANES 2008–2011 (12.8% TE) [10]. In addition, both higher intake of dietary sugars and foods high in sugars among children and adolescents were observed [1022]; thus highlighting the need for tightly monitoring sugars intake in these risk populations.
To date, the relationship between dietary sugars intake and human health has mainly been investigated at the level of SSBs, which are the main source of dietary sugars [2627282930]. SSBs have poor nutritional profiles, less satiation, and excessive caloric value; thus, they have been targeted for public health intervention [31]. However, recently, various types of highly processed foods have infiltrated into the human diet and are widely consumed [32], which has aroused attention to the overall consumption of ultra-processed foods other than SSBs. Several studies have evaluated the levels of food processing and the excessive consumption of dietary sugars. In the US diet, ultra-processed foods contributed 57.9% of the total energy and comprised 89.7% of added sugars. Additionally, consumption of added sugars increased linearly across quintiles of ultra-processed food consumption from 7.5% TE in the lowest quintile to 19.5% TE in the highest [12]. Similar associations have been observed in other countries. In the UK, ultra-processed foods accounted for 56.8% of total energy and 64.7% of total free sugars, and Australians consumed 42.0% of total energy and 73.8% of total free sugars from ultra-processed foods [1114]. Statistically significant positive associations were found between quintiles of ultra-processed food consumption and both the mean free sugars intake and the prevalence of excessive free sugars intake among almost all age groups [1114]. These tendency was similar in countries with relatively low levels of ultra-processed food consumptions. In Spain and Chile, ultra-processed foods accounted for one-third of TE, but individuals in the highest quintile of ultra-processed food consumption were three to four times more likely to exceed the 10% TE upper limit for added sugars [1315]. Our results are consistent with these results found in previous studies.
To our knowledge, this is the first study to assess the consumption of ultra-processed foods and examine its relationship with total sugars intake in Korea. Although both the levels of ultra-processed food consumption and dietary sugars intake were not as high as those in other countries [91112131524], it seems reasonable that the consumption of these foods drives excessive sugars intake, suggesting that limiting the consumption of ultra-processed foods could be an effective way of reducing dietary sugars intake.
Our study had several strengths. We used data from nationwide representative samples of Koreans aged 1 year or older, which increases the generalizability of our findings. We analyzed dietary intake data obtained by the 24-h recall method, which assesses individuals’ actual food consumption over the previous day. Thus, the actual dietary intake of food and nutrients could be assessed, unlike other studies using household expenditure surveys [1533]. In our study, all food items reported in the 24-h recall were classified according to the NOVA system. This food classification system has been widely used to categorize foods according to the nature, extent, and purpose of food processing [1623]. Moreover, three researchers independently categorized foods according to the concept and guidelines of the NOVA classification system, and discrepancies in classification were resolved through discussion, as described in our previous studies [17].
However, our study also presents several limitations. First, the dietary data we used were data on single-day intake assessed by self-report. Thus, the ultra-processed food consumption and total sugars intake estimated in our study may not reflect individuals’ usual intake [34]. In addition, ultra-processed food consumption and total sugars intake may be underestimated because of the tendency of under-reporting of unhealthy foods [35], although it is unlikely that this may affect the association between ultra-processed food consumption and total sugars intake. Finally, we estimated the dietary intake of total sugars, including both natural and added sugars, rather than added or free sugars, which is commonly considered more important to human health. Information on the content of added sugars in food is not yet available in Korea, thereby hindering the calculation of their contribution to total intake. Thus, we additionally estimated the intake of total sugars from specific food groups, such as processed and ultra-processed foods, and investigated the association between ultra-processed foods and dietary sugars intake from specific food groups and found strong relationships between them.
In conclusion, our findings indicate that the mean total sugars intake of Koreans accounted for 13.0% of TE, and ultra-processed foods contributed to one-fourth of the total energy and nearly half of the total sugars intake. The mean total sugars intake was below the limited level among all sex and age groups, but higher consumption of ultra-processed food was significantly associated with increased intake of total sugars and increased prevalence of excessive total sugars intake in all groups. This study demonstrates that restricting ultra-processed food consumption may be an efficient way to reduce sugars intake in the Korean diet.
 XML Download