

 PDF
PDF Citation
 Print
Print


INTRODUCTION
Dietary sugar intake has been reported to link with several cardio-metabolic risk factors. Meta-analysis of prospective cohort studies and randomized clinical trials of the sugar intake reported a significant association with obesity and the morbidity of major non-communicable diseases (NCDs). Free sugar intake was positively correlated with the body weight gain in both adults and children, but there was no association with isoenergetic replacement with other carbohydrate sources [1]. The results of meta-analysis of blood pressure and lipids also suggested a clear correlation with the sugar intake [2]. Many studies have been conducted on sugar-sweetened beverages (SSB), a major source of added sugar, and meta-analyses have also reported associations with obesity and major NCDs. The SSB intake was significantly associated with weight gain in both children and adults [3], and the group high in SSB intake increased the risk of type 2 diabetes and metabolic syndrome [4].
Dietary sugar intake in Korean adults is relatively low. According to the Korea National Health and Nutrition Examination Survey (KNHANES), the average daily intake of total sugar was 67.9 g in 2016, which decreased slightly to 61.7 g in 2019 [5]. However, SSB consumption increased, and the average energy contribution from SSB was 32 kcal/day in 1998 KNHANES, but it more than doubled to 82 kcal/day in the 2007–2009 KNHANES [6].
In studies of SSB in Korean adults, higher consumption of soft drinks (≥ 4 times per week) was associated with increased risk of metabolic syndrome only in women [78]. Other studies for Korean adults also reported that higher SSB consumption (≥ once per day) was associated with an increased risk of obesity in both men and women [9], and higher SSB consumption (median 3.5 servings per week) was associated with an increased incidence of hypertension [10].
On the other hand, a study of 2,599 Korean children and adolescents reported that the total dietary sugar intake was relatively low (12.5% in girls and 10.8% in boys), and even sugar intake from milk and fruits was inversely associated with pediatric overweight and obesity among girls [11]. Another study of Korean adults reported that high sugar intake (> 20% of energy) was associated with an increased risk of obesity and metabolic syndrome in men [12].
Although most studies reported a strong association of sugar intake or SSB consumption with an increased risk of cardio-metabolic risk factors, the long-term health impacts of dietary sugars are unclear. Several large cohort studies have reported a relationship between dietary sugar and mortality. A study of US adults using NHANES data (1988–1994) reported that those who consumed an added sugar intake of 25% of their energy intake or more showed 2.75 times higher cardiovascular disease (CVD) mortality than those who consumed less than 10% of energy [13]. On the other hand, a study of 4,000 Chinese elderly reported that the added sugar intake in the highest quintile was only 6.9% of energy. Those in the highest quintile had 25% lower CVD mortality than those in the lowest quintile.
In addition, a large prospective study of 353,751 US adults reported that the total fructose intake was weakly positively associated with the all-cause mortality in both men and women. In contrast, added sugar differed by the food source in that added sugar from solid foods was inversely associated with the all-cause mortality in both men and women, but added sugar from beverages was positively associated with the all-cause mortality in women [14]. This suggests that the health effects of dietary sugar should be determined from the levels of intake and its source.
Sugar intake is a modifiable dietary risk factor for NCDs. The World Health Organization (WHO) [1516] set population intake goals to prevent NCDs, the leading causes of death worldwide. Recently, WHO developed evidence-based guidelines to provide recommendations on the intake of free sugars, focusing on the prevention and control of unhealthy weight gain and dental caries [11718]. The first Dietary Reference Intakes for Koreans (KDRIs) for sugar was set in 2005, which was the acceptable macronutrient distribution range for the total sugar as 10–20%. The committee on the 2015 KDRIs examined the previous references for total sugar and recommended added sugar intake according to the free sugar guideline from WHO. The 2015 committee reviewed the scientific evidence on the association of sugar intake with the diet quality and NCDs morbidity more than obesity and dental caries. The 2020 KDRIs committee for sugar updated the scientific evidence on the association of added sugar with NCDs morbidity and expanded the evidence into the association with mortality. This study provided a systematic review on the association of added sugar intake and SSB consumption with all-cause and CVD mortality to establish the 2020 KDRIs for sugar.
SUBJECTS AND METHODS
Search strategy
Studies examining the associations of added sugar intake and its sources with mortality were identified by searching the PubMed and ScienceDirect published databases through July 2021. The following keywords were used for the search: (total sugar or added sugar or free sugar or dietary sugar or SSB or fruit juice or carbonated beverage or soft drink or sweet drink or soda appeared in the title or abstract) and (mortality or death appeared in title or abstract). In addition, the references were screened from the retrieved articles.
Selection criteria
The human studies published in English or Korean languages articles were included. Two authors (S.S. and J.E.S) assessed the eligibility criteria of the study selection independently as follows: (1) cohort design, published as full-text manuscripts of the original article; (2) exposure of interest was added sugar (free sugar) intake or its sources consumption; and (3) the endpoint of interest was all-cause or CVD mortality.
Data extraction
The following information was extracted from each article: (1) the first author’s last name, publication year, and country in which the study was performed; (2) cohort name and number of study participants; (3) study period; (4) study participants’ age and gender; (5) dietary assessment methods; (6) exposure and its comparison groups; (7) outcome and incidence; (8) follow-up period; (9) relative risk (RR) and 95% confidence interval (CI), and P-trend; and (10) covariates for adjustment in the analysis. The estimates adjusted for the most covariates were used when several estimates were reported.
RESULTS
Literature search and study characteristics
A preliminary literature search yielded 276 articles through a database search. The titles and abstracts of 252 articles were screened after excluding 24 duplicated or non-English studies. Of these, 228 articles were excluded based on the selection criteria, and 24 articles were identified for the full-text review. After the full-text review, 15 articles were excluded because 10 articles were not full-text manuscripts of the original article and 5 articles were not relevant to the exposure or outcome of interest. Furthermore, 8 additional articles were identified from the reference lists of retrieved articles. Finally, 17 cohort studies were included in this systematic review (Fig. 1) [1314192021222324252627282930313233].
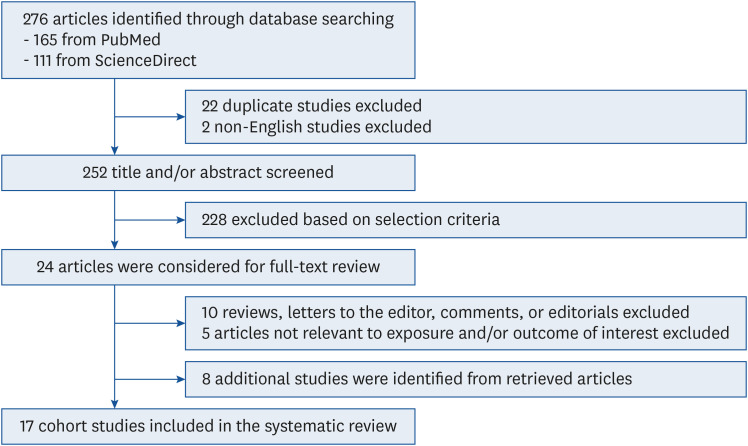
Table 1 lists the characteristics of 17 articles included in the current systematic review. All studies were based on the cohort design and adults older than 20 years. Two studies included older adults aged ≥ 65 years only [2324]. Nine studies were conducted in US adults [131420212526293233], 5 studies in European adults [1922273031], and 3 studies in Asian adults [232428]. Most studies assessed the added sugar intake or its sources using a food-frequency questionnaire (FFQ) or dietary questionnaire. The follow-up periods of the studies ranged from 6 to 34 years. The estimates obtained after adjusting for potential confounders, including nutrients, demographic, anthropometric, medical, and lifestyle variables, were considered to identify associations of added sugar intake and its sources with mortality in this review. In terms of exposure of interest, 5 articles reported the findings on the associations between added sugar intake and mortality [1314232430], and 15 articles reported the associations between food sources of added sugar and mortality [1419202122252627282930313233].
Table 1
Characteristics of cohort studies included in the systematic review

| Author, country | Year | Cohort | No. of participants | Study period | Age at baseline (Mean ± SD or range) | Men (%) | Dietary assessment | Exposure | Outcome (case/total) | Follow-up | Confounders adjusted | ||||
|---|---|---|---|---|---|---|---|---|---|---|---|---|---|---|---|
| Nutrients | Demographic | Anthrop | Medical | Lifestyles | |||||||||||
| Paganini-Hill et al., US [29] | 2007 | The Leisure World Cohort Study | 13,624 | 1980–2004 | 74 yrs (44–101 yrs) | 36.6 | Survey questionnaire | • Non-alcoholic beverages (cola and other soft drinks s with sugar- or artificially sweetened) | • All-cause mortality: 11,386/13,624 | 23 yrs | X | O | O | O | O |
| Sluik et al., 10 European countries [31] | 2014 | EPIC | 265,295 (diabetic: 6,384, non-diabetic: 258,911) | 1992– | 35–70 yrs | 40.3 | Dietary questionnaires, semi-quantitative FFQ, and combined dietary methods of food records and questionnaires | • Sugar and confectionery | • All-cause mortality in diabetic: 830/6,384 | 9.9 yrs | O | O | X | O | O |
| • Cakes and cookies | • All-cause mortality in non-diabetic: 12,135/258,911 | ||||||||||||||
| • Soft drinks | |||||||||||||||
| • Juices | |||||||||||||||
| Tasevska et al., US [14] | 2014 | The NIH-AARP Diet and Health Study | 353,751 | 1995–2008 | 50–71 yrs | 58.3 | DHQ | • Added sugar | • All-cause mortality: M, 28,617/206,371; W, 15,062/147,381 | 12–13 yrs | O | O | O | O | O |
| • Added sugar intake from beverages | |||||||||||||||
| • Added sugar intake from solids | |||||||||||||||
| Vyas et al., US [32] | 2015 | WHI-OS cohort | 59,614 | 1993–2005 | 62.8 ± 7.2 yrs (50–79 yrs) | 0.0 | Questionnaire | • Diet drinks (such as diet coke or diet fruit drinks, with a 12 fl oz can as a reference size) | • All-cause mortality: 4,437/59,614 | 8.7 yrs | O | O | O | O | O |
| • Frequency | • CVD mortality: 942/59,614 | ||||||||||||||
| Yang et al., US [13] | 2014 | NHANES | 11,733 | 1988–2010 | ≥ 20 yrs | 48.1 | 24-h recall | • Added sugar | • CVD mortality: 831/11,733 | 14.6 yrs | O | O | O | O | O |
| Lai et al., UK [22] | 2015 | UKWCS | 30,458 | 1995–2013 | 35–69 yrs | 0.0 | FFQ | • Pure fruit juice | • CVD mortality: 286/30,458 | 16.7 yrs | O | O | O | X | O |
| • Orange juice (pure fruit) | |||||||||||||||
| Odegaard et al., Singapore [28] | 2015 | SCHS | 52,584 | 1993–2011 | 45–74 yrs | 44.0 | Semi-quantitative FFQ | • Soft drink | • All-cause mortality: 10,029/52,584 | 16.3 person-yrs | O | O | O | O | O |
| • Juice (fruit or vegetable) | • CVD mortality: 3,097/52,584 | ||||||||||||||
| Barrington and White, US [20] | 2016 | VITAL study | 69,582 | 2000–2008 | 50–76 yrs | 48.8 | Semi-quantitative FFQ | • Sugar-sweetened drinks (including sugar-sweetened soda (not diet), fruit drinks (not juice), and cranberry juice) | • All-cause mortality: 4,187/69,582 | 6.9 yrs | O | O | O | O | O |
| • CVD mortality: 1,066/69,582 | |||||||||||||||
| Liu et al., China [23] | 2018 | Mr. and Ms. OS Hong Kong | 3,416 | 2001–2014 | M: 72.4 ± 5.0 yrs, W: 72.5 ± 5.3 yrs (≥ 65 yrs) | 50.0 | FFQ | • Added sugar | • CVD mortality: 174/3,416 | 11.1 yrs | O | O | O | O | O |
| • Added sugar intake from sweets | |||||||||||||||
| • Added sugar intake from cereals | |||||||||||||||
| Liu et al., China [24] | 2018 | Mr. and Ms. OS Hong Kong | 3,416 | 2001–2014 | 72.5 ± 5.2 yrs (≥ 65 yrs) | 50.0 | FFQ | • Added sugar | • All-cause mortality: 780/3,416 | 11.1 yrs | O | O | O | O | O |
| • Free sugar | |||||||||||||||
| Collin et al., US [21] | 2019 | REGARDS | 13,440 | 2003–2018 | 63.6 ± 9.1 yrs (≥ 45 yrs) | 59.3 | FFQ | • SSB | • All-cause mortality: 1,000/13,440 | 6.0 yrs | O | O | O | X | O |
| • Naturally sweet 100% fruit juice | • CHD mortality: 168/13,440 | ||||||||||||||
| Malik et al., US [25] | 2019 | HPFS | 37,716 | 1986–2014 | 40–75 yrs | 100.0 | FFQ | • SSB | • All-cause mortality: 13,004/37,716 | 28 yrs | O | O | O | O | O |
| • ASB | • CVD mortality: 3,757/37,716 | ||||||||||||||
| 2019 | NHS | 80,647 | 1976–2014 | 30–55 yrs | 0.0 | FFQ | • SSB | • All-cause mortality: 23,432/80,647 | 34 yrs | O | O | O | O | O | |
| • ASB | • CVD mortality: 4,139/80,647 | ||||||||||||||
| Mossavar-Rahmani et al., US [26] | 2019 | WHI-OS cohort | 61,204 | 1993– | 50–79 yrs | 0.0 | Questionnaire | • ASB (Diet drinks such as diet coke or diet fruit drinks, with a 12 fl oz can as a reference size) | • All-cause mortality: 9,769/61,204 | 11.9 yrs | O | O | O | O | O |
| • Frequency | |||||||||||||||
| Mullee et al., 10 European countries [27] | 2019 | EPIC | 451,743 | 1992–2013 | 50.8 ± 9.8 yrs | 28.9 | Dietary questionnaire | • Total soft drink | • All-cause mortality: 41,693/451,743 | 16.4 yrs | O | O | O | O | O |
| • Sugar-sweetened soft drink | • CVD mortality: 9,106/451,743 | ||||||||||||||
| • Artificially-sweetened soft drink | |||||||||||||||
| Ramne et al., Sweden [30] | 2019 | MDCS | 24,272 | 1991–2014 | 57.6 yrs (44–73 yrs) | 38.6 | Modified diet history (7-d food diary + FFQ) | • Added sugar | • All-cause mortality: 6,309/24,272 | 19–24 yrs | O | O | O | X | O |
| • Free sugar | • CVD mortality: 1,952/24,272 | ||||||||||||||
| • Treats | |||||||||||||||
| • Toppings | |||||||||||||||
| • SSB | |||||||||||||||
| 2019 | NSHDS | 24,475 | 1991–2014 | 48.6 yrs (36–64 yrs) | 46.3 | FFQ | • Added sugar | • All-cause mortality: 2,881/24,475 | 19–24 yrs | O | O | O | X | O | |
| • Free sugar | |||||||||||||||
| • Treats | |||||||||||||||
| • Toppings | |||||||||||||||
| • SSB | |||||||||||||||
| Anderson et al., UK [19] | 2020 | UK general population cohort | 161,415 | 2006–2016 | 40–69 yrs | - | 24-h recall | • SSB | • All-cause mortality: 2,311/161,415 | 7 yrs | O | O | O | X | O |
| • ASB | |||||||||||||||
| • Fruit or vegetable juice | |||||||||||||||
| Zhang et al., US [33] | 2021 | NHANES | 247,215 | 1999–2014 | ≥ 20 yrs | 50.4 | 24-h recall | • Added sugar intake from SSB | • All-cause mortality: 3,878/247,215 | 7.9 yrs | O | O | O | O | O |
| • SSB | • Heart disease mortality: 676/247,215 | ||||||||||||||
| • ASB | |||||||||||||||
ASB, artificially-sweetened beverages; CHD, coronary heart disease; CVD, cardiovascular disease; EPIC, European Prospective Investigation into Cancer and Nutrition; MDCS, Malmo Diet and Cancer Study; NHANES, National Health and Nutrition Examination Survey; NSHDS, Northern Swedish Health and Disease Study; FFQ, food-frequency questionnaire; NHS, Nurses' Health Study; HPFS, Health Professionals Follow-Up Study; REGARDS, Reasons for Geographic and Racial Differences in Stroke; SCHS, Singapore Chinese Health Study; SSB, sugar-sweetened beverages; UKWCS, UK Women's Cohort Study; VITAL, The Vitamins and Lifestyle; WHI-OS, Women's Health Initiative Observational Study.
Added sugar intake, SSB consumption, and all-cause mortality
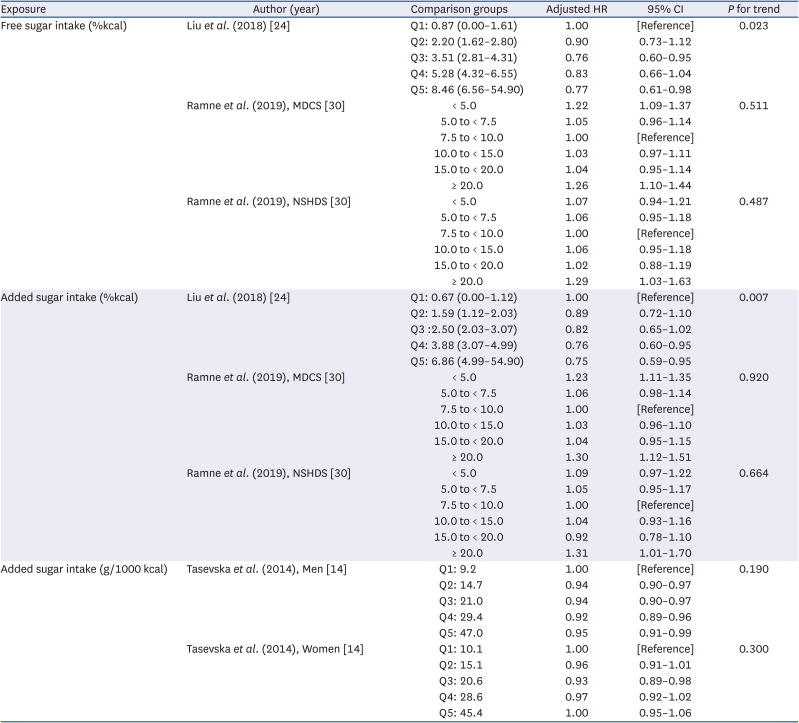
Among 17 articles, 3 studies examined the association of added or free sugar intake with the all-cause mortality risk (Table 2) [142430]. The sugar intake was assessed in the percentages of energy from sugar intake or grams per 1,000 kcal of energy intake. After adjusting for potential covariates, only one study of older Chinese adults showed significant inverse associations of added sugar and free sugar intakes with the risk of all-cause mortality (Q5 vs. Q1: RR = 0.75 for added sugar and 0.77 for free sugar) [24]. The other two studies conducted in Western adults did not have significant associations.
Table 2
Association of added sugar intake with all-cause mortality risk
| Exposure | Author (year) | Comparison groups | Adjusted HR | 95% CI | P for trend |
|---|---|---|---|---|---|
| Free sugar intake (%kcal) | Liu et al. (2018) [24] | Q1: 0.87 (0.00–1.61) | 1.00 | [Reference] | 0.023 |
| Q2: 2.20 (1.62–2.80) | 0.90 | 0.73–1.12 | |||
| Q3: 3.51 (2.81–4.31) | 0.76 | 0.60–0.95 | |||
| Q4: 5.28 (4.32–6.55) | 0.83 | 0.66–1.04 | |||
| Q5: 8.46 (6.56–54.90) | 0.77 | 0.61–0.98 | |||
| Ramne et al. (2019), MDCS [30] | < 5.0 | 1.22 | 1.09–1.37 | 0.511 | |
| 5.0 to < 7.5 | 1.05 | 0.96–1.14 | |||
| 7.5 to < 10.0 | 1.00 | [Reference] | |||
| 10.0 to < 15.0 | 1.03 | 0.97–1.11 | |||
| 15.0 to < 20.0 | 1.04 | 0.95–1.14 | |||
| ≥ 20.0 | 1.26 | 1.10–1.44 | |||
| Ramne et al. (2019), NSHDS [30] | < 5.0 | 1.07 | 0.94–1.21 | 0.487 | |
| 5.0 to < 7.5 | 1.06 | 0.95–1.18 | |||
| 7.5 to < 10.0 | 1.00 | [Reference] | |||
| 10.0 to < 15.0 | 1.06 | 0.95–1.18 | |||
| 15.0 to < 20.0 | 1.02 | 0.88–1.19 | |||
| ≥ 20.0 | 1.29 | 1.03–1.63 | |||
| Added sugar intake (%kcal) | Liu et al. (2018) [24] | Q1: 0.67 (0.00–1.12) | 1.00 | [Reference] | 0.007 |
| Q2: 1.59 (1.12–2.03) | 0.89 | 0.72–1.10 | |||
| Q3 :2.50 (2.03–3.07) | 0.82 | 0.65–1.02 | |||
| Q4: 3.88 (3.07–4.99) | 0.76 | 0.60–0.95 | |||
| Q5: 6.86 (4.99–54.90) | 0.75 | 0.59–0.95 | |||
| Ramne et al. (2019), MDCS [30] | < 5.0 | 1.23 | 1.11–1.35 | 0.920 | |
| 5.0 to < 7.5 | 1.06 | 0.98–1.14 | |||
| 7.5 to < 10.0 | 1.00 | [Reference] | |||
| 10.0 to < 15.0 | 1.03 | 0.96–1.10 | |||
| 15.0 to < 20.0 | 1.04 | 0.95–1.15 | |||
| ≥ 20.0 | 1.30 | 1.12–1.51 | |||
| Ramne et al. (2019), NSHDS [30] | < 5.0 | 1.09 | 0.97–1.22 | 0.664 | |
| 5.0 to < 7.5 | 1.05 | 0.95–1.17 | |||
| 7.5 to < 10.0 | 1.00 | [Reference] | |||
| 10.0 to < 15.0 | 1.04 | 0.93–1.16 | |||
| 15.0 to < 20.0 | 0.92 | 0.78–1.10 | |||
| ≥ 20.0 | 1.31 | 1.01–1.70 | |||
| Added sugar intake (g/1000 kcal) | Tasevska et al. (2014), Men [14] | Q1: 9.2 | 1.00 | [Reference] | 0.190 |
| Q2: 14.7 | 0.94 | 0.90–0.97 | |||
| Q3: 21.0 | 0.94 | 0.90–0.97 | |||
| Q4: 29.4 | 0.92 | 0.89–0.96 | |||
| Q5: 47.0 | 0.95 | 0.91–0.99 | |||
| Tasevska et al. (2014), Women [14] | Q1: 10.1 | 1.00 | [Reference] | 0.300 | |
| Q2: 15.1 | 0.96 | 0.91–1.01 | |||
| Q3: 20.6 | 0.93 | 0.89–0.98 | |||
| Q4: 28.6 | 0.97 | 0.92–1.02 | |||
| Q5: 45.4 | 1.00 | 0.95–1.06 |
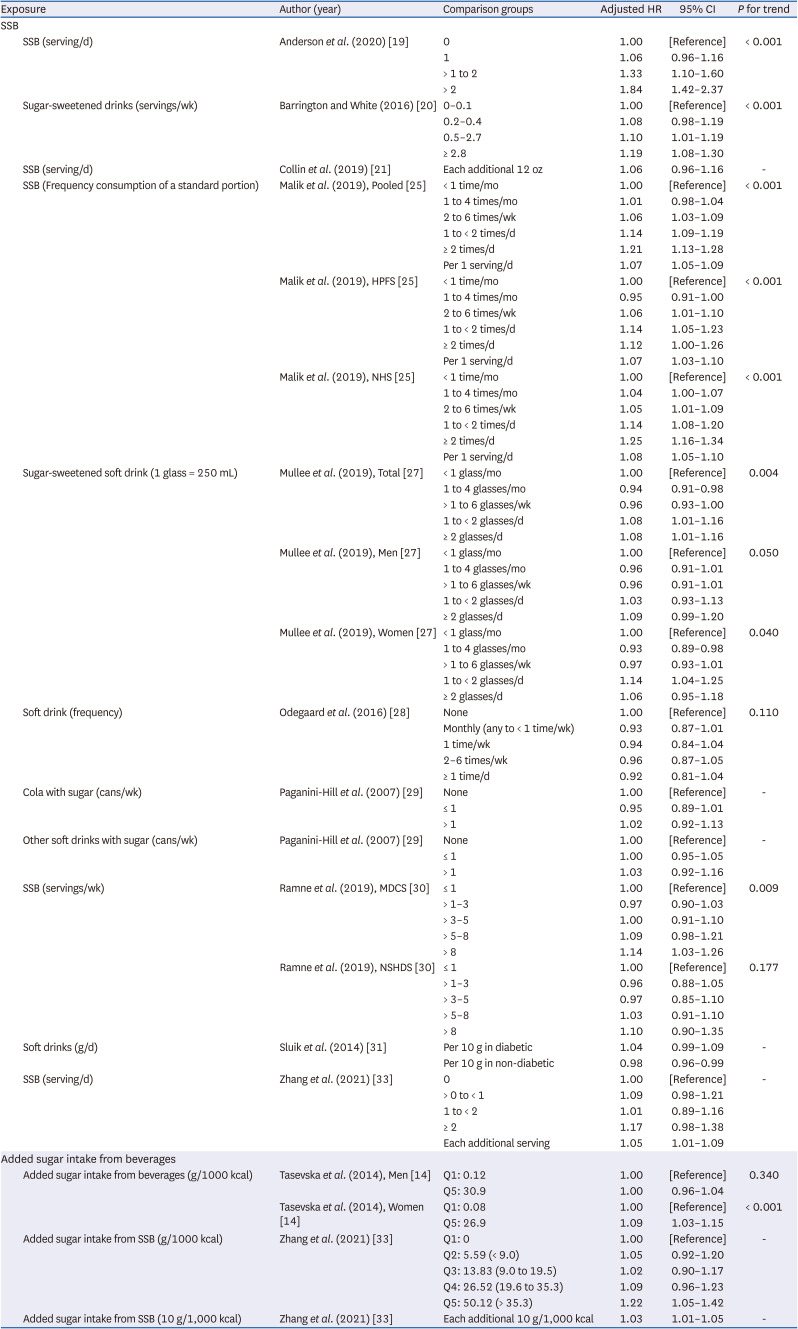
The association between SSB and all-cause mortality was examined by reviewing 11 studies (Table 3) [1419202125272829303133]. Although SSB consumption was evaluated using different units and comparison groups, most studies showed positive associations between SSB consumption and the risk of all-cause mortality. A study performed on 10 European studies showed an inverse association between soft drink and all-cause mortality in non-diabetic individuals but not in diabetic individuals [31]. Tasevska et al. [14] reported that the added sugar intake from beverages was positively associated with the all-cause mortality in women but not in men.
Table 3
Association of SSB consumption with all-cause mortality risk
| Exposure | Author (year) | Comparison groups | Adjusted HR | 95% CI | P for trend | |
|---|---|---|---|---|---|---|
| SSB | ||||||
| SSB (serving/d) | Anderson et al. (2020) [19] | 0 | 1.00 | [Reference] | < 0.001 | |
| 1 | 1.06 | 0.96–1.16 | ||||
| > 1 to 2 | 1.33 | 1.10–1.60 | ||||
| > 2 | 1.84 | 1.42–2.37 | ||||
| Sugar-sweetened drinks (servings/wk) | Barrington and White (2016) [20] | 0–0.1 | 1.00 | [Reference] | < 0.001 | |
| 0.2–0.4 | 1.08 | 0.98–1.19 | ||||
| 0.5–2.7 | 1.10 | 1.01–1.19 | ||||
| ≥ 2.8 | 1.19 | 1.08–1.30 | ||||
| SSB (serving/d) | Collin et al. (2019) [21] | Each additional 12 oz | 1.06 | 0.96–1.16 | - | |
| SSB (Frequency consumption of a standard portion) | Malik et al. (2019), Pooled [25] | < 1 time/mo | 1.00 | [Reference] | < 0.001 | |
| 1 to 4 times/mo | 1.01 | 0.98–1.04 | ||||
| 2 to 6 times/wk | 1.06 | 1.03–1.09 | ||||
| 1 to < 2 times/d | 1.14 | 1.09–1.19 | ||||
| ≥ 2 times/d | 1.21 | 1.13–1.28 | ||||
| Per 1 serving/d | 1.07 | 1.05–1.09 | ||||
| Malik et al. (2019), HPFS [25] | < 1 time/mo | 1.00 | [Reference] | < 0.001 | ||
| 1 to 4 times/mo | 0.95 | 0.91–1.00 | ||||
| 2 to 6 times/wk | 1.06 | 1.01–1.10 | ||||
| 1 to < 2 times/d | 1.14 | 1.05–1.23 | ||||
| ≥ 2 times/d | 1.12 | 1.00–1.26 | ||||
| Per 1 serving/d | 1.07 | 1.03–1.10 | ||||
| Malik et al. (2019), NHS [25] | < 1 time/mo | 1.00 | [Reference] | < 0.001 | ||
| 1 to 4 times/mo | 1.04 | 1.00–1.07 | ||||
| 2 to 6 times/wk | 1.05 | 1.01–1.09 | ||||
| 1 to < 2 times/d | 1.14 | 1.08–1.20 | ||||
| ≥ 2 times/d | 1.25 | 1.16–1.34 | ||||
| Per 1 serving/d | 1.08 | 1.05–1.10 | ||||
| Sugar-sweetened soft drink (1 glass = 250 mL) | Mullee et al. (2019), Total [27] | < 1 glass/mo | 1.00 | [Reference] | 0.004 | |
| 1 to 4 glasses/mo | 0.94 | 0.91–0.98 | ||||
| > 1 to 6 glasses/wk | 0.96 | 0.93–1.00 | ||||
| 1 to < 2 glasses/d | 1.08 | 1.01–1.16 | ||||
| ≥ 2 glasses/d | 1.08 | 1.01–1.16 | ||||
| Mullee et al. (2019), Men [27] | < 1 glass/mo | 1.00 | [Reference] | 0.050 | ||
| 1 to 4 glasses/mo | 0.96 | 0.91–1.01 | ||||
| > 1 to 6 glasses/wk | 0.96 | 0.91–1.01 | ||||
| 1 to < 2 glasses/d | 1.03 | 0.93–1.13 | ||||
| ≥ 2 glasses/d | 1.09 | 0.99–1.20 | ||||
| Mullee et al. (2019), Women [27] | < 1 glass/mo | 1.00 | [Reference] | 0.040 | ||
| 1 to 4 glasses/mo | 0.93 | 0.89–0.98 | ||||
| > 1 to 6 glasses/wk | 0.97 | 0.93–1.01 | ||||
| 1 to < 2 glasses/d | 1.14 | 1.04–1.25 | ||||
| ≥ 2 glasses/d | 1.06 | 0.95–1.18 | ||||
| Soft drink (frequency) | Odegaard et al. (2016) [28] | None | 1.00 | [Reference] | 0.110 | |
| Monthly (any to < 1 time/wk) | 0.93 | 0.87–1.01 | ||||
| 1 time/wk | 0.94 | 0.84–1.04 | ||||
| 2–6 times/wk | 0.96 | 0.87–1.05 | ||||
| ≥ 1 time/d | 0.92 | 0.81–1.04 | ||||
| Cola with sugar (cans/wk) | Paganini-Hill et al. (2007) [29] | None | 1.00 | [Reference] | - | |
| ≤ 1 | 0.95 | 0.89–1.01 | ||||
| > 1 | 1.02 | 0.92–1.13 | ||||
| Other soft drinks with sugar (cans/wk) | Paganini-Hill et al. (2007) [29] | None | 1.00 | [Reference] | - | |
| ≤ 1 | 1.00 | 0.95–1.05 | ||||
| > 1 | 1.03 | 0.92–1.16 | ||||
| SSB (servings/wk) | Ramne et al. (2019), MDCS [30] | ≤ 1 | 1.00 | [Reference] | 0.009 | |
| > 1–3 | 0.97 | 0.90–1.03 | ||||
| > 3–5 | 1.00 | 0.91–1.10 | ||||
| > 5–8 | 1.09 | 0.98–1.21 | ||||
| > 8 | 1.14 | 1.03–1.26 | ||||
| Ramne et al. (2019), NSHDS [30] | ≤ 1 | 1.00 | [Reference] | 0.177 | ||
| > 1–3 | 0.96 | 0.88–1.05 | ||||
| > 3–5 | 0.97 | 0.85–1.10 | ||||
| > 5–8 | 1.03 | 0.91–1.10 | ||||
| > 8 | 1.10 | 0.90–1.35 | ||||
| Soft drinks (g/d) | Sluik et al. (2014) [31] | Per 10 g in diabetic | 1.04 | 0.99–1.09 | - | |
| Per 10 g in non-diabetic | 0.98 | 0.96–0.99 | ||||
| SSB (serving/d) | Zhang et al. (2021) [33] | 0 | 1.00 | [Reference] | - | |
| > 0 to < 1 | 1.09 | 0.98–1.21 | ||||
| 1 to < 2 | 1.01 | 0.89–1.16 | ||||
| ≥ 2 | 1.17 | 0.98–1.38 | ||||
| Each additional serving | 1.05 | 1.01–1.09 | ||||
| Added sugar intake from beverages | ||||||
| Added sugar intake from beverages (g/1000 kcal) | Tasevska et al. (2014), Men [14] | Q1: 0.12 | 1.00 | [Reference] | 0.340 | |
| Q5: 30.9 | 1.00 | 0.96–1.04 | ||||
| Tasevska et al. (2014), Women [14] | Q1: 0.08 | 1.00 | [Reference] | < 0.001 | ||
| Q5: 26.9 | 1.09 | 1.03–1.15 | ||||
| Added sugar intake from SSB (g/1000 kcal) | Zhang et al. (2021) [33] | Q1: 0 | 1.00 | [Reference] | - | |
| Q2: 5.59 (< 9.0) | 1.05 | 0.92–1.20 | ||||
| Q3: 13.83 (9.0 to 19.5) | 1.02 | 0.90–1.17 | ||||
| Q4: 26.52 (19.6 to 35.3) | 1.09 | 0.96–1.23 | ||||
| Q5: 50.12 (> 35.3) | 1.22 | 1.05–1.42 | ||||
| Added sugar intake from SSB (10 g/1,000 kcal) | Zhang et al. (2021) [33] | Each additional 10 g/1,000 kcal | 1.03 | 1.01–1.05 | - | |
Added sugar intake, SSB consumption, and CVD mortality
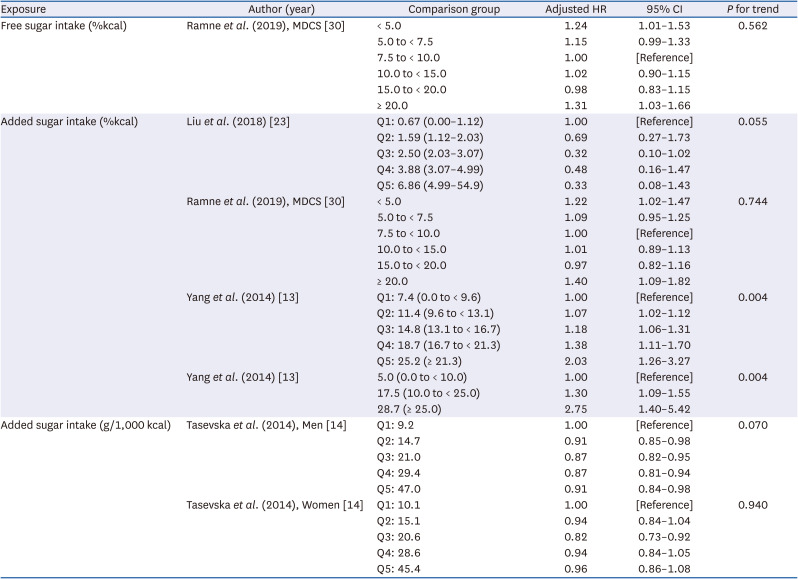
Tables 4 and 5 lists the associations of added sugar intake and SSB consumption with the risk of CVD mortality, respectively. Among the 4 studies examining the association between added sugar intake and CVD mortality [13142330], 3 studies did not find any significant associations [142330], but one study based on the NHANES data reported that a higher intake of added sugar was associated with an increased risk of CVD mortality in US adults (Q5 vs. Q1: RR = 2.03, 95% CI = 1.26–3.27, P for trend = 0.004) [13].
Table 4
Association of added sugar intake with cardiovascular disease mortality risk
| Exposure | Author (year) | Comparison group | Adjusted HR | 95% CI | P for trend |
|---|---|---|---|---|---|
| Free sugar intake (%kcal) | Ramne et al. (2019), MDCS [30] | < 5.0 | 1.24 | 1.01–1.53 | 0.562 |
| 5.0 to < 7.5 | 1.15 | 0.99–1.33 | |||
| 7.5 to < 10.0 | 1.00 | [Reference] | |||
| 10.0 to < 15.0 | 1.02 | 0.90–1.15 | |||
| 15.0 to < 20.0 | 0.98 | 0.83–1.15 | |||
| ≥ 20.0 | 1.31 | 1.03–1.66 | |||
| Added sugar intake (%kcal) | Liu et al. (2018) [23] | Q1: 0.67 (0.00–1.12) | 1.00 | [Reference] | 0.055 |
| Q2: 1.59 (1.12–2.03) | 0.69 | 0.27–1.73 | |||
| Q3: 2.50 (2.03–3.07) | 0.32 | 0.10–1.02 | |||
| Q4: 3.88 (3.07–4.99) | 0.48 | 0.16–1.47 | |||
| Q5: 6.86 (4.99–54.9) | 0.33 | 0.08–1.43 | |||
| Ramne et al. (2019), MDCS [30] | < 5.0 | 1.22 | 1.02–1.47 | 0.744 | |
| 5.0 to < 7.5 | 1.09 | 0.95–1.25 | |||
| 7.5 to < 10.0 | 1.00 | [Reference] | |||
| 10.0 to < 15.0 | 1.01 | 0.89–1.13 | |||
| 15.0 to < 20.0 | 0.97 | 0.82–1.16 | |||
| ≥ 20.0 | 1.40 | 1.09–1.82 | |||
| Yang et al. (2014) [13] | Q1: 7.4 (0.0 to < 9.6) | 1.00 | [Reference] | 0.004 | |
| Q2: 11.4 (9.6 to < 13.1) | 1.07 | 1.02–1.12 | |||
| Q3: 14.8 (13.1 to < 16.7) | 1.18 | 1.06–1.31 | |||
| Q4: 18.7 (16.7 to < 21.3) | 1.38 | 1.11–1.70 | |||
| Q5: 25.2 (≥ 21.3) | 2.03 | 1.26–3.27 | |||
| Yang et al. (2014) [13] | 5.0 (0.0 to < 10.0) | 1.00 | [Reference] | 0.004 | |
| 17.5 (10.0 to < 25.0) | 1.30 | 1.09–1.55 | |||
| 28.7 (≥ 25.0) | 2.75 | 1.40–5.42 | |||
| Added sugar intake (g/1,000 kcal) | Tasevska et al. (2014), Men [14] | Q1: 9.2 | 1.00 | [Reference] | 0.070 |
| Q2: 14.7 | 0.91 | 0.85–0.98 | |||
| Q3: 21.0 | 0.87 | 0.82–0.95 | |||
| Q4: 29.4 | 0.87 | 0.81–0.94 | |||
| Q5: 47.0 | 0.91 | 0.84–0.98 | |||
| Tasevska et al. (2014), Women [14] | Q1: 10.1 | 1.00 | [Reference] | 0.940 | |
| Q2: 15.1 | 0.94 | 0.84–1.04 | |||
| Q3: 20.6 | 0.82 | 0.73–0.92 | |||
| Q4: 28.6 | 0.94 | 0.84–1.05 | |||
| Q5: 45.4 | 0.96 | 0.86–1.08 |
Table 5
Association of SSB consumption with cardiovascular disease mortality risk
| Exposure | Author (year) | Comparison groups | Adjusted HR | 95% CI | P for trend | |
|---|---|---|---|---|---|---|
| SSB | ||||||
| Sugar-sweetened drinks (servings/wk) | Barrington and White (2016) [20] | 0.0–0.1 | 1.00 | [Reference] | 0.450 | |
| 0.2–0.4 | 0.92 | 0.75–1.12 | ||||
| 0.5–2.7 | 1.06 | 0.89–1.25 | ||||
| ≥ 2.8 | 1.05 | 0.87–1.27 | ||||
| SSB (serving/d) | Collin et al. (2019) [21] | Each additional 12 oz | 1.11 | 0.90–1.39 | - | |
| SSB (Frequency consumption of a standard portion) | Malik et al. (2019), Pooled [25] | < 1 times/mo | 1.00 | [Reference] | < 0.001 | |
| 1 to 4 times/mo | 1.06 | 1.00–1.12 | ||||
| 2 to 6 times/wk | 1.10 | 1.04–1.17 | ||||
| 1 to < 2 times/d | 1.19 | 1.08–1.31 | ||||
| ≥ 2 times/d | 1.31 | 1.15–1.50 | ||||
| Per 1 serving/d | 1.10 | 1.06–1.14 | ||||
| Malik et al. (2019), HPFS [25] | < 1/mo | 1.00 | [Reference] | 0.020 | ||
| 1 to 4/mo | 1.04 | 0.95–1.14 | ||||
| 2 to 6/wk | 1.08 | 1.00–1.18 | ||||
| 1 to < 2/d | 1.17 | 1.01–1.35 | ||||
| ≥ 2/d | 1.19 | 0.95–1.49 | ||||
| Per 1 serving/d | 1.07 | 1.01–1.14 | ||||
| Malik et al. (2019), NHS [25] | < 1/mo | 1.00 | [Reference] | < 0.001 | ||
| 1 to 4/mo | 1.07 | 0.99–1.16 | ||||
| 2 to 6/wk | 1.10 | 1.01–1.20 | ||||
| 1 to < 2/d | 1.21 | 1.06–1.37 | ||||
| ≥ 2/d | 1.37 | 1.16–1.62 | ||||
| Per 1 serving/d | 1.11 | 1.06–1.16 | ||||
| Sugar-sweetened soft drink (1 glass = 250 mL) | Mullee et al. (2019), Total [27] | < 1 glass/mo | 1.00 | [Reference] | 0.160 | |
| 1 to 4 glasses/mo | 0.97 | 0.90–1.05 | ||||
| > 1 to 6 glasses/wk | 0.96 | 0.90–1.04 | ||||
| 1 to < 2 glasses/d | 1.06 | 0.92–1.22 | ||||
| ≥ 2 glasses/d | 1.11 | 0.95–1.30 | ||||
| Mullee et al. (2019), Men [27] | < 1 glass/mo | 1.00 | [Reference] | 0.430 | ||
| 1 to 4 glasses/mo | 0.99 | 0.89–1.10 | ||||
| > 1 to 6 glasses/wk | 0.94 | 0.85–1.04 | ||||
| 1 to < 2 glasses/d | 0.98 | 0.80–1.20 | ||||
| ≥ 2 glasses/d | 1.11 | 0.91–1.35 | ||||
| Mullee et al. (2019), Women [27] | < 1 glass/mo | 1.00 | [Reference] | 0.200 | ||
| 1 to 4 glasses/mo | 0.97 | 0.87–1.07 | ||||
| > 1 to 6 glasses/wk | 0.99 | 0.89–1.09 | ||||
| 1 to < 2 glasses/d | 1.15 | 0.94–1.40 | ||||
| ≥ 2 glasses/d | 1.11 | 0.86–1.43 | ||||
| Soft drink (frequency) | Odegaard et al. (2016) [28] | None | 1.00 | [Reference] | 0.540 | |
| Monthly | 0.96 | 0.84–1.09 | ||||
| 1/wk | 1.08 | 0.91–1.30 | ||||
| 2–6/wk | 1.08 | 0.92–1.27 | ||||
| ≥ 1/d | 1.03 | 0.83–1.30 | ||||
| SSB (serving/d) | Zhang et al. (2021) [33] | 0 | 1.00 | [Reference] | - | |
| > 0 to < 1 | 1.02 | 0.81–1.28 | ||||
| 1 to < 2 | 1.38 | 1.05–1.81 | ||||
| ≥ 2 | 1.52 | 1.03–2.25 | ||||
| Each additional serving | 1.11 | 1.03–1.21 | ||||
| Added sugar intake from beverage | ||||||
| Added sugar intake from beverage (%kcal) | Liu et al. (2018) [23] | Q1: 0.00 (0.00–0.05) | 1.00 | [Reference] | 0.074 | |
| Q2: 0.17 (0.05–0.31) | 1.10 | 0.43–2.83 | ||||
| Q3: 0.52 (0.31–0.83) | 0.44 | 0.14–1.40 | ||||
| Q4: 1.34 (0.83–2.24) | 0.41 | 0.14–1.25 | ||||
| Q5: 4.15 (2.24–53.1) | 0.55 | 0.15–2.07 | ||||
| Added sugar intake from beverages (g/1,000 kcal) | Tasevska et al. (2014), Men [14] | Q1: 0.12 | 1.00 | [Reference] | 0.300 | |
| Q5: 30.9 | 1.01 | 0.94–1.09 | ||||
| Tasevska et al. (2014), Women [14] | Q1: 0.08 | 1.00 | [Reference] | 0.020 | ||
| Q5: 26.9 | 1.13 | 1.01–1.26 | ||||
| Added sugar intake from SSB (g/1,000 kcal) | Zhang et al. (2021) [33] | Q1: 0.0 | 1.00 | [Reference] | - | |
| Q2: 5.59 (< 9.0) | 0.91 | 0.65–1.25 | ||||
| Q3: 13.83 (9.0 to 19.5) | 1.15 | 0.89–1.47 | ||||
| Q4: 26.52 (19.6 to 35.3) | 1.32 | 0.98–1.76 | ||||
| Q5: 50.12 (> 35.3) | 1.45 | 1.06–1.97 | ||||
| Added sugar intake from SSB (10 g/1,000 kcal) | Zhang et al. (2021) [33] | Each additional 10 g/1,000 kcal | 1.08 | 1.03–1.13 | - | |
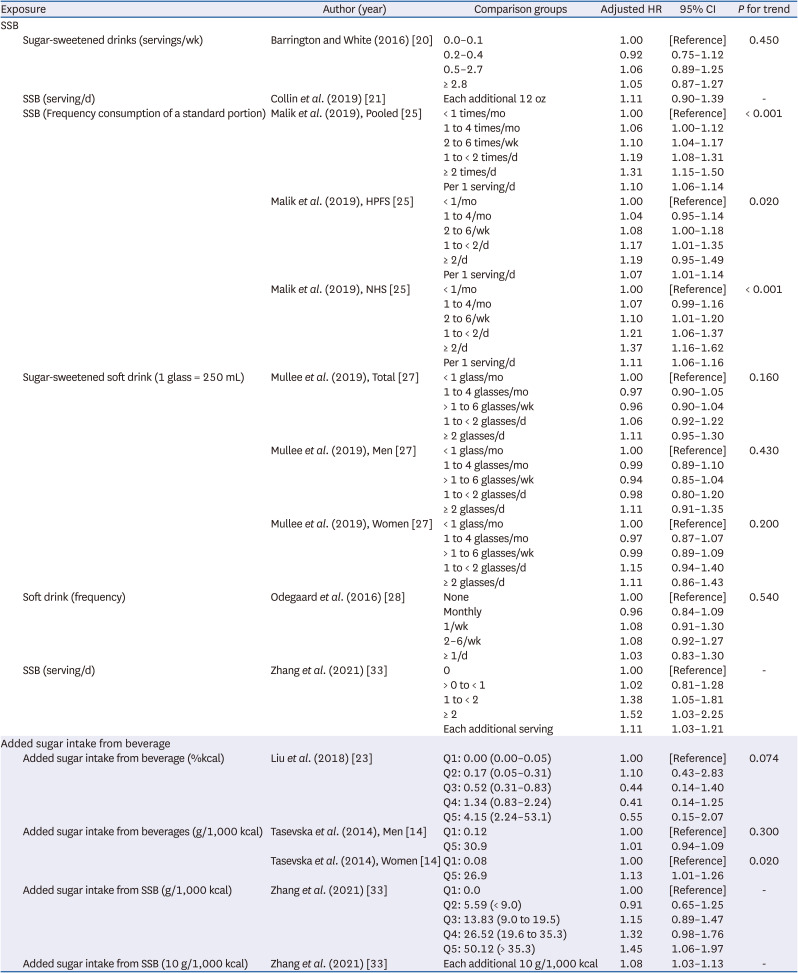
Based on a review of 8 studies on SSB consumption and CVD mortality [1420212325272833], 5 studies did not report significant associations of SSB consumption or added sugar intake from SSB with CVD mortality [2021232728]. Three US studies consistently observed that SSB intake was positively associated with CVD mortality [142533]. Tasevska et al. [14] observed this positive association only in women, not in men.
Artificially-sweetened beverages (ASB) and juice consumption and mortality
The association of ASB consumption with the all-cause or CVD mortality was examined in seven studies (data not shown). The 6 studies reported positive associations between ASB intake and all-cause mortality [192526272932], but 1 study did not observe a significant association [33]. Regarding the CVD mortality, 3 studies showed that a higher intake of ASB increased the risk of mortality [252732], but Zhang et al. [33] did not observe an increase.
Four studies investigating relationships between juice consumption and all-cause mortality reported inconsistent findings: 1 study found a positive association of fruit juice [21]. Another study found no association of fruit and vegetable juices [28], and 2 studies found an inverse association (1 study addressed fruit and vegetable juice, and the other study had no information on the type of juice) [1931]. Three studies on juice intake and CVD mortality consistently showed no significant associations, but each study defined juice consumption differently in terms of the type of juice, or the unit of the amount consumed [212228].
DISCUSSION
This paper systematically reviewed studies reporting the effects of added sugar according to the source on mortality as a long-term and summary health outcome, focusing on the added sugar intake and SSB. This study observed a similar positive association of sugar intake with mortality to the studies analyzing SSB and morbidity and the intake range with low mortality risk. In addition, the difference in risk according to the sugar source: sugary food and beverage did not increase the mortality risk when it contained sufficient nutrients other than sugar.
The intake level of added sugar was associated with mortality in all three studies [142430] that analyzed the association of the energy contribution of added sugar intake with all-cause mortality. The above three studies showed different patterns of risk according to the intake level because an increase in mortality was observed at intake levels less than 5% of the total energy, even when the intake of added sugar in the target group was low. A similar trend was observed in studies on CVD mortality. The CVD risk decreased with increasing intake level in the study that the reference intake interval was less than 5% of the total energy. Tasevska et al. [14] suggested an association of fructose, but not added sugars, with the mortality risk, while it may represent the influence of SSB as the main added fructose source.
Among the studies that conducted all-cause mortality as an outcome, 11 studies analyzed SSB exposure with different units. Nine studies were measured by the serving unit, among which five studies showed that all-cause mortality increased with increasing intake of SSB. Two studies analyzed the dose-response relationship and reported that the mortality risk increased 5% [33] and 7% [25] each for one serving per day. In one study that analyzed according to gender, a statistically significant increase in mortality risk was observed only in women [27]. In addition, 1 study that analyzed the results from 2 cohorts of different age groups [30] reported a significant association only in younger adults. Further studies on the difference in the effects according to age and gender are needed.
In 2 studies that analyzed the risk by the quintile according to the exposure level of SSB added sugar (g/1,000 kcal), the mortality was significantly higher in the top quintile. Among them, 1 study [14] reported statistical significance only in women. When the median of the top quintile was converted to %kcal, they were 10.76% [4] and 20% [33]. For every 4% increase in SSB intake, the mortality risk increased by 3% [19]. On the other hand, the consumption of ASB increased the mortality risk. One study [33] reported a decreased risk when the intake level was less than a serving per day. Therefore, it is necessary to pay attention to the dietary behavior of subjects who consume a considerable amount of beverages, including SSB when determining the correlation with health outcomes.
Liquid sources, such as SSB and ASB, increased the mortality risk, whereas solid sources decreased the risk. In addition, one study [31] analyzed the mortality risk by dividing solid sources into “sugar and confectionery” and “cakes and cookies”. They reported a 5% increased risk from “sugar and confectionery” for every 10 g increase in intake and a 3% decrease for “cakes and cookies”. These results may indicate that sugary food containing sufficient nutrients other than sugar does not increase the mortality risk.
Some studies [2430] also suggested the mortality risk according to the intake level of free sugar. These results were similar to those of added sugar. The recommendations for reducing sugar intake address the free sugar or added sugar as the target of restrictions, but the food sources are somewhat different between free sugar and added sugar. Juice with a high sugar content is included as a free sugar food defined by the WHO [34] because it is not a whole food but a processed product with a high sugar content from fruit. On the other hand, the source of added sugar suggested by the US Department of Agriculture (USDA) [35] and US Food and Drug Administration [36] did not include 100% fruit juice. Although the USDA [37] recommended eating whole fruit rather than fruit juice in the dietary guidelines for Americans, fruit juice is also included in the fruit group.
The 4 studies analyzed according to the exposure level of juice reported inconsistent results (2 decreased, 1 increased, and 1 not significant). The large difference in the level of exposure made it difficult to conclude by summarizing the trends. According to a study on the association of whole fruit and fruit juice with the prevalence of obesity using the KNHANES data, the obesity and metabolic syndrome abnormalities were negatively associated with the whole fruit intake, but the relationship with fruit juice intake was difficult to determine.
In the Korean food guide, fruit juice is classified as a fruit group and is recommended as a healthy choice. The 2015 KDRIs referred to the WHO’s recommended free sugar level when setting the added sugar recommendation. On the other hand, the term free sugar was not used to consider whether the term and its definition could be adequately communicated to the general public. Moreover, there is a lack of evidence to validate the recommendation because of the absence of a database for either added sugar or free sugar content in foods to calculate intake.
The total sugar was recently included in the standard food composition table. The total sugar intake for three years since 2016 was first reported at the national level using the 7th KNHANES data [38]. The total sugar intake for three years during the 7th survey period has been gradually decreasing, and the average daily sugar intake of Koreans was 60 g, which is approximately 12% of the average energy intake (1,988 kcal) in 2018. The intake level of added sugar might be much lower. When the WHO [34] set the recent sugar intake guidelines, the intake of free sugar was limited to less than 10% of the energy intake level, while a comment was added to ensure that the current consumption levels do not increase further rather than applying the guideline in countries where the consumption levels of sugar are currently low.
Tasevska et al. [14] reported the same trend as added sugar when the total sugar was analyzed as exposure. The mortality increased with increasing sugar intake, while men with a relatively lower intake than women had higher mortality, even in the lowest intake quintile (median 13.4% of energy) than in medium intake level. Although it is necessary to examine whether there is a gender-specific difference or just depending on the intake level, all-cause mortality increased with increasing added sugar intake from SSB in women, and the all-cause mortality from the solids source decreased in men. In addition, a Japanese study [39] reported that the intake level (median of 1st quintile is 4.4% of energy) was lower than that of Tasevska et al. [14]. On the other hand, the all-cause and CVD mortality increased with increasing total sugar intake showing the lowest risk in the lowest quintile.
After a systematic review of the association with mortality and additional evidence on morbidity since 2015 considering revision, the 2020 KDRIs decided to maintain the existing recommendations because of insufficient evidence and the absence of a necessity for the revision [40]. The differences in intake levels that increase the mortality in each study may originate from differences in the method of estimating sugar intake, but may also be from the differences between countries. In addition, an accurate evaluation of decreasing trends in the total sugar intake in Koreans is required because fruit intake has been declining recently [38]. Therefore, to set sugar intake guidelines, more evidence will be needed on the comprehensive consumption data of Koreans and the consequent morbidity and mortality.
In conclusion, this systematic review revealed an appropriate range of added sugar intake to lower mortality. Although there were differences according to the study, low mortality was observed over the intake range of added sugar from 5% to 20% of energy. Accordingly, a ‘U-’ or ‘J’-shaped relationship was estimated, but more evidence will be needed to establish a dose-response relationship. In addition, the mortality risk from sugary food and beverages was not increased when they contained sufficient nutrients other than sugar. Thus, appropriate recommendations on the total sugar intake and restricting sugary foods that are not nutritious may be a good strategy. Although the 2020 KDRIs maintained the existing recommendations, more studies (i.e., comprehensive consumption and dietary behavior data of various sugary foods) will be needed to complement the current sugar guidelines and set adequate recommendations for Koreans. Academia should establish a statement toward fruit juice as a free sugar source and provide proper communication to the public for added sugar or free sugar to assist in healthy food choices.
 XML Download