Journal List > J Korean Med Sci > v.37(13) > 1160631

Kim, Lee, Kang, Kim, Han, Kang, Park, Park, Park, Cho, Hong, Lee, Jang, Lee, Lee, and Bae: Fasting and Non-Fasting Triglycerides in Patients With Acute Ischemic Stroke

Abstract

Background

Clinical implications of elevated fasting triglycerides (FTGs) and non-fasting triglycerides (NFTGs) in acute ischemic stroke (AIS) remain unknown. We aimed to elucidate the correlation and clinical significance of FTG and NFTG levels in AIS patients.

Methods

Using a multicenter prospective stroke registry, we identified AIS patients hospitalized within 24 hours of onset with available NFTG results. The primary outcome was a composite of stroke recurrence, myocardial infarction, and all-cause mortality up to one year.

Results

This study analyzed 2,176 patients. The prevalence of fasting and non-fasting hypertriglyceridemia was 11.5% and 24.6%, respectively. Multivariate analysis revealed that younger age, diabetes, higher body mass index and initial systolic blood pressure were independently associated with both fasting and non-fasting hypertriglyceridemia (all P < 0.05). Patients with higher quartiles of NFTG were more likely to be male, younger, ever-smokers, diabetic, and have family histories of premature coronary heart disease and stroke (all P < 0.05). Similar tendencies were observed for FTG. The composite outcome was not associated with FTG or NFTG quartiles.

Conclusion

The fasting and non-fasting hypertriglyceridemia were prevalent in AIS patients and showed similar clinical characteristics and outcomes. High FTG and NFTG levels were not associated with occurrence of subsequent clinical events up to one year.

Graphical Abstract

jkms-37-e100-abf001.jpg

INTRODUCTION

In the general population, the lipid profile is conventionally measured in the blood collected after fasting for at least 8 hours.1 This is because an increase in the triglyceride (TG) level is seen during a fat tolerance test, in which patients typically consume 1 g fat/kg of body weight.23 However, non-fasting TG (NFTG) has been reported to be associated with the risk of future occurrence of cardiovascular events,4 and it could be a better predictor of such events as compared to fasting TG (FTG).45 Furthermore, because most people eat regularly throughout the day and are strictly fasting only for a few hours in the morning, the NFTG level might be a better physiological indicator of the average TG concentrations in the blood rather than the FTG level.16 Therefore, in some countries, such as Denmark, NFTG has been the standard since 2009.1
Most of the current knowledge about the clinical significance of FTG and NFTG is from previous studies conducted on the general population.1456 Measuring TG levels is clinically important in stroke patients regarding that TG is known as an important predictor of early neurological deterioration7 and stroke recurrence,8 and is also known to be associated with stroke subtype as large-artery atherosclerosis.9 When discussing the role of FTG and NFTG in patients with acute ischemic stroke (AIS), the important question is whether FTG measurements are essential in the management of AIS. This study aimed to answer this question by 1) describing and comparing the FTG and NFTG concentrations in patients with AIS; 2) comparing their demographics, vascular risk factors, and stroke profiles according to the FTG and NFTG quartiles; 3) exploring the clinical determinants of the elevated FTG and NFTG levels; and 4) analyzing the impact of elevated FTG and NFTG levels on clinical outcomes.

METHODS

Study design and population

This study was based on the Clinical Research Collaboration for Stroke in Korea (CRCS-K) registry, a web-based, nationwide, prospective, multicenter stroke registry established in 2008.1011 From the registry database, we identified consecutive patients with AIS, who were admitted to the five participating hospitals within 24 hours of symptom onset between October 2009 and November 2014, showing relevant ischemic lesions on diffusion-weighted imaging. The exclusion criteria were unavailability of information regarding the FTG or NFTG levels, unknown last mealtime or blood sampling time of lipid levels, or interval of > 8 hours between the last mealtime and first sampling time for the random TG level (i.e., whose lipid profiles were regarded as fasting). Finally, 2,176 patients with AIS were included in this study (Supplementary Fig. 1).
The diagnostic evaluation and management of AIS in the participating centers were performed according to contemporary clinical practice guidelines, institutional protocols, and at the discretion of the treating physicians in charge of patient care.12 The collection of clinical information for monitoring and improving the quality of stroke care in the CRCS-K registry was approved by the Institutional Review Boards of the participating centers without patient consent to ensure anonymity of data and minimal risk to participants. We obtained additional approval for the use of the registry database for this study.

Data collection

Data regarding age, sex, body mass index (BMI), laboratory findings (systolic blood pressure [SBP], diastolic blood pressure, and fasting and non-fasting lipid and glucose levels), vascular risk factors (history of stroke and coronary heart disease [CHD], hypertension, diabetes mellitus, dyslipidemia, atrial fibrillation, and smoking status), family history of stroke and CHD, and stroke characteristics (stroke severity and subtypes) were obtained directly from the CRCS-K registry database.
In all the participating centers, it was recommended to measure lipid concentrations, including total cholesterol, TG, low-density lipoprotein (LDL) cholesterol, and high-density lipoprotein (HDL) cholesterol at the time of hospitalization without intentional fasting. These were referred to as the non-fasting lipid concentrations, if the blood sampling was performed within 8 hours from patients’ last mealtime. Most blood samples for the assay of non-fasting lipid concentrations were drawn in the emergency room. Fasting lipid concentrations were measured on the first morning of hospitalization after overnight fasting.
The primary clinical outcome measure of this study was a composite of stroke recurrence, myocardial infarction, and all-cause mortality, captured prospectively up to one year after the index stroke by reviewing medical records and/or conducting structured telephonic interviews by the stroke coordinators of the participating centers. The detailed definitions and protocols for collecting clinical outcomes in the CRCS-K registry have been described elsewhere.1011 The secondary outcome measure was stroke recurrence.

Statistical analyses

Scatter plots and Pearson correlation coefficients were used to depict and compare the distribution of fasting and non-fasting lipid levels. Baseline characteristics of the participants were compared according to FTG and NFTG quartiles using the Pearson’s χ2 test for categorical variables and analysis of variance or Kruskal-Wallis tests for continuous variables.
To explore the clinical determinants of the two correlated dependent variables, fasting and non-fasting hypertriglyceridemia,13 we performed multivariate logistic regression analysis with the generalized estimating equation method with respect to the correlational structure between them.14 For each potential determinant, the equality of odds ratios (ORs) between fasting and non-fasting hypertriglyceridemia was examined using the Wald test.
Influences of the FTG and NFTG quartiles on clinical outcomes were evaluated using Cox proportional hazard models. Unadjusted and adjusted hazard ratios with 95% confidence intervals were estimated. Variables for adjustment were predetermined based on previous literature and clinical relevance that included age, sex, history of stroke or transient ischemic attack (TIA), history of CHD, hypertension, diabetes mellitus, hypercholesterolemia, atrial fibrillation, ever-smoking, statin use at discharge, antithrombotics at discharge, and Trial of Org 10172 in Acute Stroke Treatment (TOAST) classification with some modifications.15 A two-sided P value < 0.05 was considered statistically significant. Statistical analysis was performed using SAS software version 9.4 (SAS Institute, Inc., Cary, NC, USA) and Statistical Package for the Social Sciences (IBM SPSS version 19.0.1; IBM Corporation, Armonk, NY, USA).

Ethics statement

Ethical approval for this study was obtained from the Institutional Review Board of the Seoul National University Bundang Hospital (No. B-1202/146-106). The board waived the need of patients/care givers' informed consent because of anonymity of data and minimal risk.

RESULTS

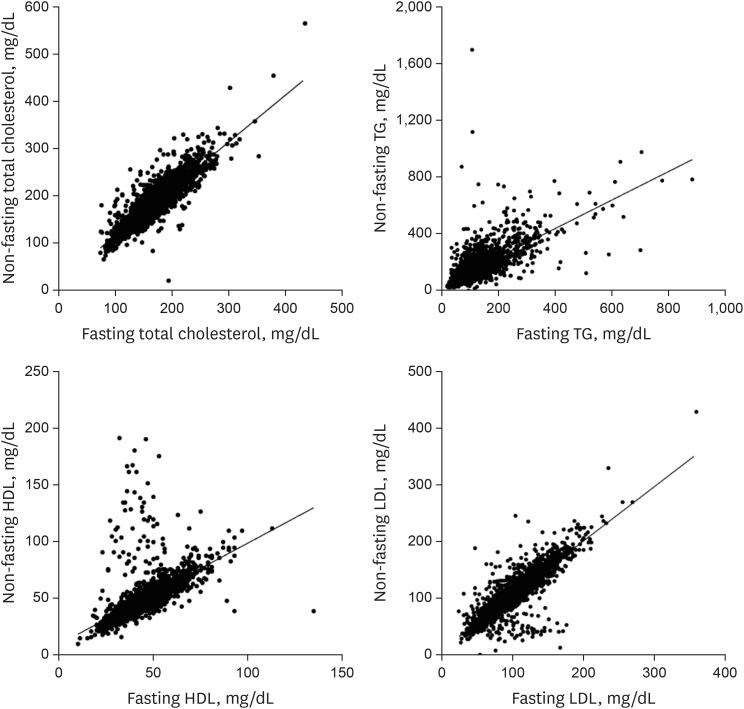
Among 2,176 eligible patients, the distribution of fasting and non-fasting lipid concentrations was mostly bell-shaped and correlated well with each other (Fig. 1 and Supplementary Fig. 2). Younger age groups showed higher concentrations of FTG and NFTG (Supplementary Fig. 3). The mean ± standard deviation values of fasting and non-fasting lipid concentrations were 171.3 ± 40.8 and 186.3 ± 45.5 mg/dL for total cholesterol, 120.8 ± 80.5 and 160.1 ± 115.3 mg/dL for TG, 43.7 ± 12.2 and 48.7 ± 18.1 mg/dL for HDL cholesterol, and 103.6 ± 34.9 and 108.3 ± 39.0 mg/dL for LDL cholesterol, respectively. Pearson correlation coefficients between fasting and non-fasting lipid concentrations were 0.88 for total cholesterol, 0.70 for TG, 0.60 for HDL cholesterol, and 0.85 for LDL cholesterol (all P < 0.001). NFTG concentrations tended to be higher than fasting concentrations up to 4 hours after meals (Supplementary Fig. 4). Comparisons of non-fasting lipid concentrations among the quartiles of intervals between the last mealtime and sampling time showed a significant difference only for TG (Supplementary Table 1).
Fig. 1

Correlation analyses between fasting and non-fasting lipid profiles. Fasting and non-fasting lipid profiles were well correlated for total cholesterol, TG, HDL, and LDL. Pearson’s correlation coefficients were 0.88 for total cholesterol, 0.70 for TG, 0.60 for HDL, and 0.85 for LDL (all P < 0.001).

TG = triglycerides, HDL = high-density lipoprotein, LDL = low-density lipoprotein.
jkms-37-e100-g001
When comparing the baseline characteristics according to the NFTG quartiles, patients with higher quartiles were more likely to be male, younger, and have large artery atherosclerosis with an ischemic stroke subtype and traditional vascular risk factors, including family history of premature CHD and stroke (Table 1). Similar tendencies were found in the analysis of the FTG quartiles (Supplementary Table 2). When patients were grouped by 2018 American College of Cardiology and American Heart Association guidelines on the management of blood cholesterol,16 patients’ characteristics showed similar results to those of the quartile group (Supplementary Tables 3 and 4).
Table 1

Baseline characteristics according to NFTG levels

jkms-37-e100-i001
Characteristics < 87 mg/dL (n = 530) 87–129 mg/dL (n = 555) 130–196 mg/dL (n = 544) ≥ 197 mg/dL (n = 547) P value
Males 304 (57.4) 325 (58.6) 339 (62.3) 381 (69.7) < 0.001
Age, yr 68.8 ± 13.9 69.0 ± 13.3 66.8 ± 12.2 63.4 ± 12.4 < 0.001
BMI, kg/m2 22.8 ± 3.3 23.6 ± 3.7 23.8 ± 3.2 24.8 ± 3.1 0.080
Abdominal circumference, cm 82.4 ± 9.7 84.7 ± 9.0 85.2 ± 9.8 87.8 ± 9.2 < 0.001
Initial SBP, mmHg 146.5 ± 26.7 152.6 ± 27.1 152.9 ± 27.8 157.6 ± 29.2 < 0.001
Medical history
Stroke or TIA 134 (25.3) 133 (24.0) 124 (22.8) 93 (17.0) 0.010
CHD 38 (7.2) 37 (6.7) 50 (9.2) 29 (5.3) 0.090
Family history of premature CHD 7 (1.3) 13 (2.3) 15 (2.8) 25 (4.6) 0.010
Family history of stroke 0.010
≥ 60 yr 46 (8.7) 69 (12.4) 69 (12.7) 78 (14.3)
< 60 yr 14 (2.6) 23 (4.1) 18 (3.3) 32 (5.9)
Hypertension 339 (64.0) 398 (71.7) 389 (71.5) 374 (68.4) 0.020
Diabetes 123 (23.2) 167 (30.1) 199 (36.6) 217 (39.7) < 0.001
Hypercholesterolemia 147 (27.7) 172 (31.0) 186 (34.2) 190 (34.7) 0.051
Atrial fibrillation 191 (36.0) 138 (24.9) 108 (19.9) 83 (15.2) < 0.001
Ever-smoking 197 (37.2) 226 (40.7) 247 (45.4) 287 (52.5) < 0.001
History of statin use 122 (23.0) 147 (26.5) 114 (21.0) 111 (20.3) 0.060
Stroke profile
NIHSS at admission, median (IQR) 4 (2–12) 4 (2–9) 3 (1–8) 3 (1–6) < 0.001
TOAST classification < 0.001
LAA 151 (28.5) 191 (34.4) 203 (37.3) 204 (37.3)
SVO 60 (11.3) 89 (16.0) 99 (18.2) 123 (22.5)
Cardioembolism 192 (36.2) 156 (28.1) 105 (19.3) 90 (16.5)
Other determined 20 (3.8) 10 (1.8) 18 (3.3) 9 (1.6)
Undetermined 107 (20.2) 109 (19.6) 119 (21.9) 121 (22.1)
Laboratory findings
HbA1c, % 5.9 ± 1.1 6.2 ± 1.2 6.5 ± 1.4 6.7 ± 1.5 < 0.001
Fasting state
Glucose, mg/dL 103.2 ± 33.5 107.1 ± 40.0 113.4 ± 58.7 122.3 ± 50.7 < 0.001
Total cholesterol, mg/dL 156.1 ± 35.9 166.1 ± 37.6 175.7 ± 41.0 186.8 ± 42.0 < 0.001
FTG, mg/dL 64.9 ± 24.9 92.9 ± 37.8 123.2 ± 45.5 201.0 ± 106.8 < 0.001
HDL, mg/dL 47.8 ± 12.9 44.7 ± 12.2 42.7 ± 12.1 39.9 ± 10.2 < 0.001
LDL, mg/dL 90.6 ± 30.6 101.2 ± 32.1 109.6 ± 36.2 112.9 ± 36.2 < 0.001
Non-fasting state
Glucose, mg/dL 126.0 ± 48.2 131.1 ± 48.8 139.5 ± 66.7 149.2 ± 70.5 < 0.001
Total cholesterol, mg/dL 167.3 ± 39.1 180.5 ± 41.2 191.8 ± 46.6 205.1 ± 44.4 < 0.001
NFTG, mg/dL 63.9 ± 15.5 107.1 ± 12.6 159.0 ± 18.7 308.1 ± 135.8 < 0.001
HDL, mg/dL 52.9 ± 16.5 50.0 ± 18.2 47.4 ± 18.2 44.2 ± 17.7 < 0.001
LDL, mg/dL 96.1 ± 32.7 106.3 ± 36.3 115.0 ± 42.2 115.5 ± 39.6 < 0.001
Sampling interval time, mina 252.1 ± 118.0 247.5 ± 114.5 248.3 ± 111.1 259.4 ± 107.1 0.280
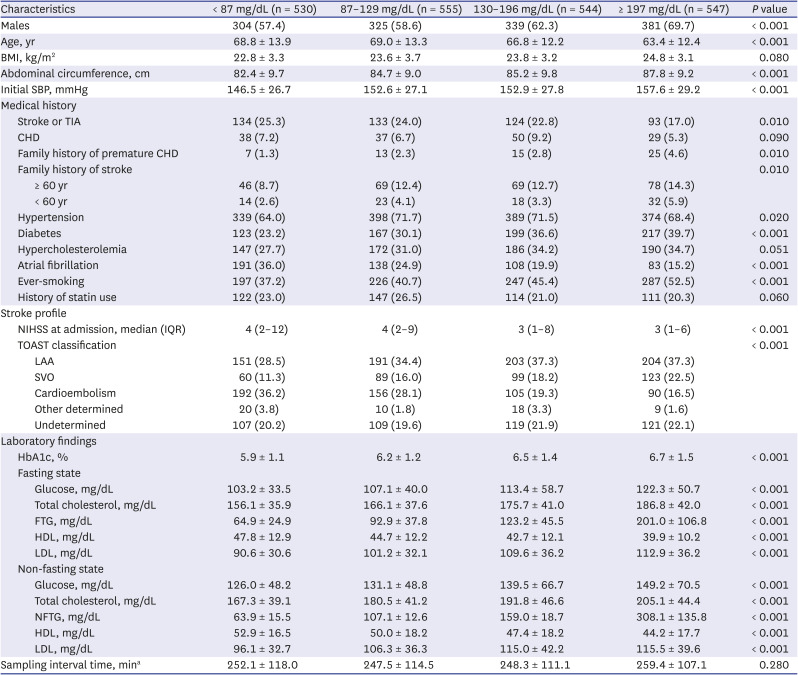
Values are expressed as number (%) or mean ± standard deviation, unless noted otherwise.
NFTG = non-fasting triglyceride, BMI = body mass index, SBP = systolic blood pressure, TIA = transient ischemic attack, CHD = coronary heart disease, NIHSS = National Institutes of Health Stroke Scale, IQR = interquartile range, TOAST = Trial of ORG 10172 in Acute Stroke Treatment, LAA = large artery atherosclerosis, SVO = small-vessel occlusion, HbA1c = glycated hemoglobin, FTG = fasting triglyceride, HDL = high-density lipoprotein, LDL = low-density lipoprotein.
aSampling interval time was calculated as the time interval between the last meal and sampling for lipid profiles.
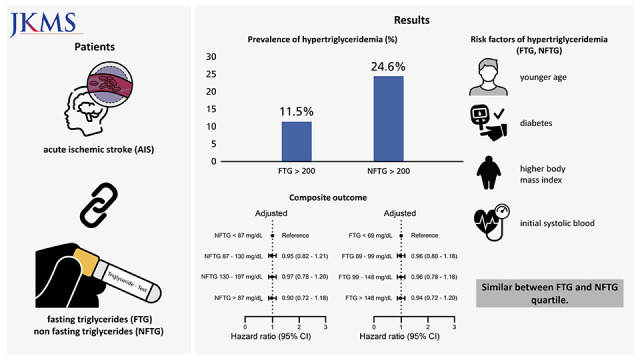
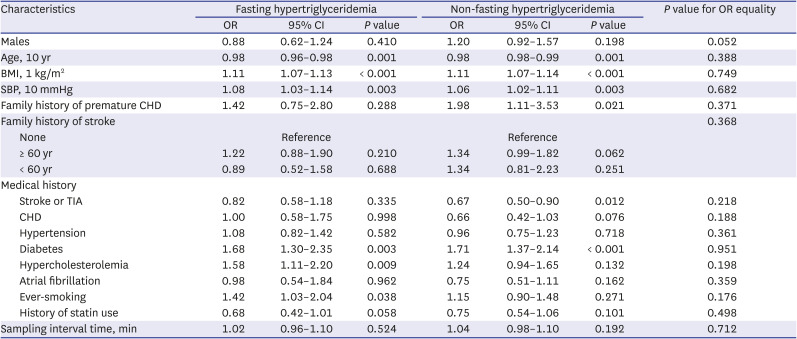
The prevalence of fasting and non-fasting hypertriglyceridemia (≥ 200 mg/dL) was 11.5% (n = 251) and 24.6% (n = 536), respectively. Multivariate analysis revealed that age, BMI, initial SBP, and diabetes were independently associated with both fasting and non-fasting hypertriglyceridemia; hypercholesterolemia and ever-smoking were associated with fasting hypertriglyceridemia; and family history of premature CHD and history of stroke or TIA were associated with non-fasting hypertriglyceridemia (P < 0.05) (Table 2). However, tests for examining the equality of ORs for each variable showed no inequality in the analyzed variables.
Table 2

Multivariate analyses and tests for equality of ORs for fasting and non-fasting hypertriglyceridemiaa

jkms-37-e100-i002
Characteristics Fasting hypertriglyceridemia Non-fasting hypertriglyceridemia P value for OR equality
OR 95% CI P value OR 95% CI P value
Males 0.88 0.62–1.24 0.410 1.20 0.92–1.57 0.198 0.052
Age, 10 yr 0.98 0.96–0.98 0.001 0.98 0.98–0.99 0.001 0.388
BMI, 1 kg/m2 1.11 1.07–1.13 < 0.001 1.11 1.07–1.14 < 0.001 0.749
SBP, 10 mmHg 1.08 1.03–1.14 0.003 1.06 1.02–1.11 0.003 0.682
Family history of premature CHD 1.42 0.75–2.80 0.288 1.98 1.11–3.53 0.021 0.371
Family history of stroke 0.368
None Reference Reference
≥ 60 yr 1.22 0.88–1.90 0.210 1.34 0.99–1.82 0.062
< 60 yr 0.89 0.52–1.58 0.688 1.34 0.81–2.23 0.251
Medical history
Stroke or TIA 0.82 0.58–1.18 0.335 0.67 0.50–0.90 0.012 0.218
CHD 1.00 0.58–1.75 0.998 0.66 0.42–1.03 0.076 0.188
Hypertension 1.08 0.82–1.42 0.582 0.96 0.75–1.23 0.718 0.361
Diabetes 1.68 1.30–2.35 0.003 1.71 1.37–2.14 < 0.001 0.951
Hypercholesterolemia 1.58 1.11–2.20 0.009 1.24 0.94–1.65 0.132 0.198
Atrial fibrillation 0.98 0.54–1.84 0.962 0.75 0.51–1.11 0.162 0.359
Ever-smoking 1.42 1.03–2.04 0.038 1.15 0.90–1.48 0.271 0.176
History of statin use 0.68 0.42–1.01 0.058 0.75 0.54–1.06 0.101 0.498
Sampling interval time, min 1.02 0.96–1.10 0.524 1.04 0.98–1.10 0.192 0.712
OR = odds ratio, CI = confidence interval, BMI = body mass index, SBP = systolic blood pressure, CHD = coronary heart disease, TIA = transient ischemic attack.
aHypertriglyceridemia was defined as above 150 mg/dL for fasting triglycerides and above 200 mg/dL for non-fasting triglycerides.
Compared to the lowest quartile of NFTG, the highest quartile was negatively associated with the composite outcome in the unadjusted analysis, but this association was not statistically significant after adjustments for age and sex (Fig. 2 and Supplementary Table 5). The FTG and NFTG quartiles were not associated with any outcome variables after adjustments for predetermined potential confounders (Fig. 2, Supplementary Tables 5 and 6). Similar results were showed in the analysis dividing TG levels according to the 2018 American College of Cardiology/American Heart Association guideline (Supplementary Tables 7 and 8). Moreover, fasting and non-fasting hypertriglyceridemia were not associated with an increased risk of any clinical outcomes (Table 3).
Fig. 2

Cox’s proportional hazard model according to the quartiles of FTG and NFTG for the composite outcome. HRs were adjusted for age, sex, history of stroke or transient ischemic attack, history of coronary heart disease, hypertension, diabetes mellitus, atrial fibrillation, ever-smoking, history of statin use, and Trial of Org 10172 in Acute Stroke Treatment classification. The composite outcome consisted of stroke recurrence, myocardial infarction, and all-cause mortality up to one year after the index stroke.

HR = hazard ratio, CI = confidence interval, NFTG = non-fasting triglyceride, FTG = fasting triglyceride.
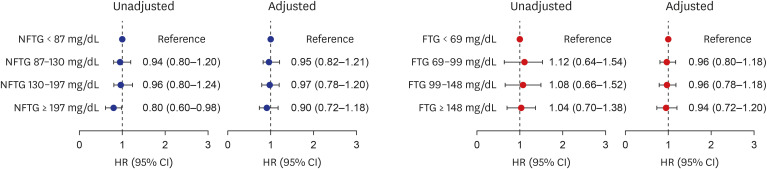
jkms-37-e100-g002
Table 3

HRs according to fasting and non-fasting hypertriglyceridemiaa

jkms-37-e100-i003
Characteristics Stroke recurrence Composite outcomeb
Crude HR (95% CI) Adjusted HRc (95% CI) Crude HR (95% CI) Adjusted HRc (95% CI)
Fasting hypertriglyceridemia 0.98 (0.62–1.54) 1.22 (0.76–2.08) 0.64 (0.58–0.98) 0.94 (0.62–1.42)
Non-fasting hypertriglyceridemia 0.80 (0.53–1.20) 0.98 (0.65–1.49) 0.64 (0.47–0.87) 0.94 (0.68–1.30)
HR = hazard ratio, CI = confidence interval.
aHypertriglyceridemia was defined as above 150 mg/dL for fasting triglycerides and above 200 mg/dL for non-fasting triglycerides; bComposite outcome consisted of stroke recurrence, myocardial infarction and all kinds of death up to one year after onset; cAdjusted for age group, males, history of stroke or transient ischemic attack, coronary heart disease, hypertension, diabetes mellitus, hypercholesterolemia, atrial fibrillation, ever-smoking, statin use, initial National Institutes of Health Stroke Scale.

DISCUSSION

This study found that 1) fasting and non-fasting lipid concentrations were well correlated; 2) fasting and non-fasting hypertriglyceridemia were prevalent in AIS patients; 3) fasting and non-fasting hypertriglyceridemia were associated with younger age, diabetes, and higher BMI and initial SBP; and 4) FTG and NFTG levels were not associated with the clinical outcomes.
Following food ingestion, TG is transported from the small intestines by chylomicrons through the bloodstream. Lipolysis of TG within chylomicrons, catalyzed by lipoprotein lipase, transforms these particles into atherogenic TG-remnant lipoproteins. Elevated postprandial TG levels, reflecting either higher peak levels or delay in clearance of TG-rich particles, can lead to accumulation of these atherogenic particles.17 The data presented in Supplementary Table 1, corresponds to the expected time course of postprandial TG metabolism. In response to food intake, TG concentrations typically reach their peaks approximately 4 hours after meals and decline thereafter.18 Thus, postprandial TG levels are more physiologic and better associated with thrombogenic conditions, such as ischemic stroke. Furthermore, our study suggests that patients with elevated FTG and NFTG levels show similar characteristics. Therefore, NFTG can replace FTG in the diagnostic evaluation of patients with AIS.
Several biological mechanisms provide plausible explanations about the associations between high FTG and NFTG concentrations and young age, higher BMI, higher SBP, and diabetes, which are components of the metabolic syndrome.19 Hypertriglyceridemia is a feature of dyslipidemia seen in type 2 diabetes and metabolic syndrome, which may also include insulin resistance,20 abdominal obesity, and hypertension.13 Hyperinsulinemia leads to an increase in the production of very-LDL.21 Hyperglycemia also impairs removal of TG-rich lipoproteins from circulation. Patients with poorly controlled diabetes have higher TG levels than those with well-controlled diabetes. Postprandial hyperlipidemia in diabetic patients appears to be prolonged, indicating that the arteries are exposed to atherogenic particles for extended periods.2122
In this study, both FTG and NFTG levels were not associated with the composite outcome comprising of stroke recurrence, myocardial infarction, or all-cause mortality up to one year after the index stroke. Contradicting our results, in patients with established cardiovascular disease or risk factors, higher TG levels were reportedly associated with an increased risk of recurrent vascular events,23 and reducing TG levels lowered the risk of ischemic events.24 There are some explanations for these discrepancies. First, it has been reported that high TG levels might be associated with milder stroke severity and better outcomes in patients with AIS.252627 In our study, NFTG negatively correlated with the initial National Institutes of Health Stroke Scale scores (Pearson correlation coefficient = −1.33, P < 0.001). Second, TG could paradoxically prevent lipotoxicity, and subsequently poor outcome.2829 Third, treatment with statin at discharge might attenuate the effect of high TG on outcome. The proportion of patients treated with statin at discharge was 88.5% in our study. In a previous study that reported a significant correlation between TG and recurrent stroke, the statin prescription rate was 36%.30
Our study had several limitations. First, it only included Korean patients, and these results may not be generalizable to other populations. Second, the proportion of patients excluded from the analysis was 63%, accounting for a fairly large proportion. Particularly, when compared to patients excluded from this study, the proportion of young males, BMI, and prevalence of hyperlipidemia was relatively higher among the included patients, but the prevalence of diabetes did not differ between them (Supplementary Table 9). The possibility of selection bias cannot be excluded, but the differences seemed considerably small to affect the clinical outcomes. Third, we did not have information on other possible factors affecting the lipid levels, such as foods, drugs, and nutritional state.
In conclusion, our study shows that AIS patients with fasting and non-fasting hypertriglyceridemia may not differ in their clinical characteristics and outcomes. Furthermore, FTG and NFTG levels were not associated with subsequent clinical events, including stroke recurrence, myocardial infarction, and all-cause mortality up to one year.

Notes

Funding: This research was partially supported by the research fund of the Korea Centers for Disease Control and Prevention (2020ER620200#) and Daewoong Pharmaceutical Co. Ltd. The fund supporters played no roles in the study design, data collection, analysis and interpretation, as well as preparation, review, and approval of the manuscript.

Disclosure: Bae HJ is the principal investigator. He is also a member of the steering committee, and/or a site investigator of multicenter clinical trials or clinical studies that are sponsored by BMS Korea, Shinpoong Pharm. Co. Ltd., Bayer, Boehringer Ingelheim, Daiichi-Sankyo, Esai, AstraZeneca Korea, Servier Korea, Yuhan Corporation, Jeil Pharmaceutical Co., Shire Korea, JLK inspection, Chong Gun Dang Pharmaceutical Corp., and Dong-A Pharmaceutical. He has received lecture honoraria from Esai, Shire Korea, Amgen, and Otsuka Korea outside of this work. The other authors have no conflicts of interest.

Author Contributions:

  • Conceptualization: Kim JY, Lee KJ, Kang J, Kim BJ, Han MK, Kang K, Park JM, Park TH, Park HK, Cho YJ, Hong KS, Lee KB, Bae HJ.

  • Data curation: Kim JY, Lee KJ, Kang J, Kim BJ, Han MK, Kang K, Park JM, Park TH, Park HK, Cho YJ, Hong KS, Lee KB, Jang MS, Bae HJ.

  • Formal analysis: Kim JY, Jang MS, Lee JS, Lee J.

  • Investigation: Kim JY.

  • Methodology: Kim JY, Jang MS, Lee JS, Lee J, Bae HJ.

  • Project administration: Kim JY.

  • Resources: Lee KJ, Kang J, Kim BJ, Han MK, Kang K, Park JM, Park TH, Park HK, Cho YJ, Hong KS, Lee KB.

  • Supervision: Lee J, Bae HJ.

  • Validation: Kim JY, Jang MS, Lee JS.

  • Visualization: Kim JY, Lee JS, Lee J.

  • Writing - original draft: Kim JY.

  • Writing - review & editing: Kim JY, Lee KJ, Kang J, Kim BJ, Han MK, Kang K, Park JM, Park TH, Park HK, Cho YJ, Hong KS, Lee KB, Bae HJ.

References

1. Nordestgaard BG, Varbo A. Triglycerides and cardiovascular disease. Lancet. 2014; 384(9943):626–635. PMID: 25131982.
crossref
2. Cohn JS, McNamara JR, Cohn SD, Ordovas JM, Schaefer EJ. Postprandial plasma lipoprotein changes in human subjects of different ages. J Lipid Res. 1988; 29(4):469–479. PMID: 3392464.
crossref
3. Schaefer EJ, Audelin MC, McNamara JR, Shah PK, Tayler T, Daly JA, et al. Comparison of fasting and postprandial plasma lipoproteins in subjects with and without coronary heart disease. Am J Cardiol. 2001; 88(10):1129–1133. PMID: 11703957.
crossref
4. Bansal S, Buring JE, Rifai N, Mora S, Sacks FM, Ridker PM. Fasting compared with nonfasting triglycerides and risk of cardiovascular events in women. JAMA. 2007; 298(3):309–316. PMID: 17635891.
crossref
5. Nordestgaard BG, Benn M, Schnohr P, Tybjaerg-Hansen A. Nonfasting triglycerides and risk of myocardial infarction, ischemic heart disease, and death in men and women. JAMA. 2007; 298(3):299–308. PMID: 17635890.
crossref
6. Langsted A, Freiberg JJ, Nordestgaard BG. Fasting and nonfasting lipid levels: influence of normal food intake on lipids, lipoproteins, apolipoproteins, and cardiovascular risk prediction. Circulation. 2008; 118(20):2047–2056. PMID: 18955664.
7. Kwon HM, Lim JS, Park HK, Lee YS. Hypertriglyceridemia as a possible predictor of early neurological deterioration in acute lacunar stroke. J Neurol Sci. 2011; 309(1-2):128–130. PMID: 21784458.
crossref
8. Park JH, Lee J, Ovbiagele B. Nontraditional serum lipid variables and recurrent stroke risk. Stroke. 2014; 45(11):3269–3274. PMID: 25236873.
crossref
9. Bang OY, Saver JL, Liebeskind DS, Pineda S, Ovbiagele B. Association of serum lipid indices with large artery atherosclerotic stroke. Neurology. 2008; 70(11):841–847. PMID: 18160673.
crossref
10. Kim BJ, Han MK, Park TH, Park SS, Lee KB, Lee BC, et al. Current status of acute stroke management in Korea: a report on a multicenter, comprehensive acute stroke registry. Int J Stroke. 2014; 9(4):514–518. PMID: 24256115.
crossref
11. Kim BJ, Park JM, Kang K, Lee SJ, Ko Y, Kim JG, et al. Case characteristics, hyperacute treatment, and outcome information from the clinical research center for stroke-fifth division registry in South Korea. J Stroke. 2015; 17(1):38–53. PMID: 25692106.
crossref
12. Adams HP Jr, del Zoppo G, Alberts MJ, Bhatt DL, Brass L, Furlan A, et al. Guidelines for the early management of adults with ischemic stroke: a guideline from the American Heart Association/American Stroke Association Stroke Council, Clinical Cardiology Council, Cardiovascular Radiology and Intervention Council, and the Atherosclerotic Peripheral Vascular Disease and Quality of Care Outcomes in Research Interdisciplinary Working Groups: The American Academy of Neurology affirms the value of this guideline as an educational tool for neurologists. Circulation. 2007; 115(20):e478–e534. PMID: 17515473.
13. Expert Panel on Detection, Evaluation, and Treatment of High Blood Cholesterol in Adults. Executive summary of the third report of the National Cholesterol Education Program (NCEP) Expert Panel on Detection, Evaluation, And Treatment of High Blood Cholesterol in Adults (Adult Treatment Panel III). JAMA. 2001; 285(19):2486–2497. PMID: 11368702.
14. Gauvreau K, Pagano M. The analysis of correlated binary outcomes using multivariate logistic regression. Biom J. 1997; 39(3):309–325.
crossref
15. Ko Y, Lee S, Chung JW, Han MK, Park JM, Kang K, et al. MRI-based algorithm for acute ischemic stroke subtype classification. J Stroke. 2014; 16(3):161–172. PMID: 25328874.
crossref
16. Grundy SM, Stone NJ, Bailey AL, Beam C, Birtcher KK, Blumenthal RS, et al. 2018 AHA/ACC/AACVPR/AAPA/ABC/ACPM/ADA/AGS/APhA/ASPC/NLA/PCNA guideline on the management of blood cholesterol: a report of the American College of Cardiology/American Heart Association task force on clinical practice guidelines. Circulation. 2019; 139(25):e1082–e1143. PMID: 30586774.
17. Ginsberg HN. New perspectives on atherogenesis: role of abnormal triglyceride-rich lipoprotein metabolism. Circulation. 2002; 106(16):2137–2142. PMID: 12379586.
18. Boquist S, Ruotolo G, Tang R, Björkegren J, Bond MG, de Faire U, et al. Alimentary lipemia, postprandial triglyceride-rich lipoproteins, and common carotid intima-media thickness in healthy, middle-aged men. Circulation. 1999; 100(7):723–728. PMID: 10449694.
crossref
19. Hwang JH, Kam S, Shin JY, Kim JY, Lee KE, Kwon GH, et al. Incidence of metabolic syndrome and relative importance of five components as a predictor of metabolic syndrome: 5-year follow-up study in Korea. J Korean Med Sci. 2013; 28(12):1768–1773. PMID: 24339707.
crossref
20. Moon S, Park JS, Ahn Y. The cut-off values of triglycerides and glucose index for metabolic syndrome in American and Korean adolescents. J Korean Med Sci. 2017; 32(3):427–433. PMID: 28145645.
crossref
21. Coughlan BJ, Sorrentino MJ. Does hypertriglyceridemia increase risk for CAD? Growing evidence suggests it plays a role. Postgrad Med. 2000; 108(7):77–84. PMID: 11126144.
crossref
22. Kreisberg RA. Diabetic dyslipidemia. Am J Cardiol. 1998; 82(12A):67U–73U.
crossref
23. van de Woestijne AP, Wassink AM, Monajemi H, Liem AH, Nathoe HM, van der Graaf Y, et al. Plasma triglyceride levels increase the risk for recurrent vascular events independent of LDL-cholesterol or nonHDL-cholesterol. Int J Cardiol. 2013; 167(2):403–408. PMID: 22265582.
crossref
24. Bhatt DL, Steg PG, Miller M, Brinton EA, Jacobson TA, Ketchum SB, et al. Cardiovascular risk reduction with icosapent ethyl for hypertriglyceridemia. N Engl J Med. 2019; 380(1):11–22. PMID: 30415628.
crossref
25. Pikija S, Milevcić D, Trkulja V, Kidemet-Piskac S, Pavlicek I, Sokol N. Higher serum triglyceride level in patients with acute ischemic stroke is associated with lower infarct volume on CT brain scans. Eur Neurol. 2006; 55(2):89–92. PMID: 16636555.
crossref
26. Weir CJ, Sattar N, Walters MR, Lees KR. Low triglyceride, not low cholesterol concentration, independently predicts poor outcome following acute stroke. Cerebrovasc Dis. 2003; 16(1):76–82. PMID: 12766366.
crossref
27. Dziedzic T, Slowik A, Gryz EA, Szczudlik A. Lower serum triglyceride level is associated with increased stroke severity. Stroke. 2004; 35(6):e151–e152. PMID: 15131316.
crossref
28. Eun MY, Seo WK, Lee J, Kim M, Kim J, Kim JH, et al. Age-dependent predictors for recurrent stroke: the paradoxical role of triglycerides. Eur Neurol. 2013; 69(3):171–178. PMID: 23296152.
crossref
29. Listenberger LL, Han X, Lewis SE, Cases S, Farese RV Jr, Ory DS, et al. Triglyceride accumulation protects against fatty acid-induced lipotoxicity. Proc Natl Acad Sci U S A. 2003; 100(6):3077–3082. PMID: 12629214.
crossref
30. Zhao L, Wang R, Song B, Tan S, Gao Y, Fang H, et al. Association between atherogenic dyslipidemia and recurrent stroke risk in patients with different subtypes of ischemic stroke. Int J Stroke. 2015; 10(5):752–758. PMID: 25924059.
crossref

SUPPLEMENTARY MATERIALS

Supplementary Table 1

Non-fasting serum glucose and lipid levels according to quartiles of sampling interval timea
jkms-37-e100-s001.doc

Supplementary Table 2

Baseline characteristics according to FTG levels
jkms-37-e100-s002.doc

Supplementary Table 3

Baseline characteristics according to NFTG levels, classified by 2018 ACC/AHA guideline
jkms-37-e100-s003.doc

Supplementary Table 4

Baseline characteristics according to FTG levels, classified by 2018 ACC/AHA guideline
jkms-37-e100-s004.doc

Supplementary Table 5

Hazard ratios for the composite outcomea and stroke recurrence according to non-fasting triglycerides quartiles
jkms-37-e100-s005.doc

Supplementary Table 6

Hazard ratios for the composite outcomea and stroke recurrence according to fasting triglycerides quartiles
jkms-37-e100-s006.doc

Supplementary Table 7

Hazard ratios for the composite outcomea and stroke recurrence according to non-fasting triglycerides levels, classified by 2018 ACC/AHA guideline
jkms-37-e100-s007.doc

Supplementary Table 8

Hazard ratios for the composite outcomea and stroke recurrence according to fasting triglycerides levels, classified by 2018 ACC/AHA guideline
jkms-37-e100-s008.doc

Supplementary Table 9

Comparison table of included and excluded patients
jkms-37-e100-s009.doc

Supplementary Fig. 1

Flowchart of the study population enrollment.
jkms-37-e100-s010.doc

Supplementary Fig. 2

Distributions of fasting and non-fasting lipid concentrations.
jkms-37-e100-s011.doc

Supplementary Fig. 3

Mean value and standard deviation of fasting and non-fasting TG in different age groups. Bold horizontal line stands standard deviation of TG levels.
jkms-37-e100-s012.doc

Supplementary Fig. 4

Histogram representing fasting and non-fasting triglyceride levels according to sampling interval time of non-fasting triglycerides. Histograms are plotted based on the “sampling interval time,” which is the time interval between the last meal and blood sampling to measure the non-fasting TG.
jkms-37-e100-s013.doc
TOOLS
Similar articles