Journal List > J Korean Med Sci > v.37(12) > 1160157

Kim, Kim, Jo, Seol, Cho, Lim, and Moon: Hearing and Speech Perception for People With Hearing Loss Using Personal Sound Amplification Products

Abstract

Background

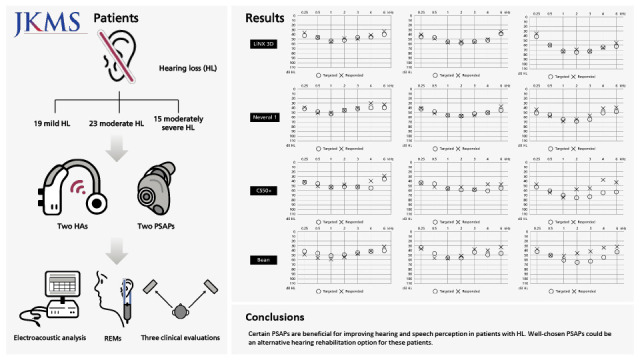
Hearing loss (HL) is the most common chronic disease and has been linked to negative health outcomes. Hearing aids (HAs) are regarded as the gold standard for HL management, however, the adoption rate of HAs is relatively low for various reasons. With this background, hearing devices, such as personal sound amplification products (PSAPs) received significant attention as an alternative to conventional HAs. This study aimed to evaluate the clinical efficacy of PSAPs in patients with mild to moderately severe HL.

Methods

Nineteen patients with mild hearing loss (MHL), 23 with moderate hearing loss (MDHL), and 15 with moderately severe hearing loss (MSHL) participated in the study. Electroacoustic analysis, simulated real-ear measurements (REMs), and three clinical evaluations were implemented.

Results

All devices satisfied the electroacoustic tolerances. All devices provided sufficient gain for MHL and MDHL audiograms. However, in MSHL audiogram, the gains of PSAPs were insufficient, especially for high frequencies. In terms of clinical evaluations, sound-field audiometry showed significant improvements between aided and unaided thresholds in all groups for all devices (P < 0.001). Significant improvements of word recognition scores were only shown for HAs between aided and unaided conditions. The Korean version of the Hearing In Noise Test did not show any consistent findings for all devices and groups.

Conclusion

Certain PSAPs are beneficial for improving hearing and speech perception in patients with HL. Well-chosen PSAPs could be an alternative hearing rehabilitation option for these patients.

Graphical Abstract

jkms-37-e94-abf001.jpg

INTRODUCTION

The World Health Organization reported in 2020 that approximately 5% of the world’s population has hearing loss (HL), and it is expected that one in 10 individuals will develop HL due to the rapidly aging population.1 HL is the third most prevalent chronic condition faced by older adults2 and has been linked to negative health outcomes including depressive symptoms,3 decreased quality of life,4 and cognitive deficits.5 Recent evidence suggests that HL is a significant modifiable risk factor against dementia,6 therefore, proactive hearing rehabilitation is essential.
Previous studies have demonstrated that untreated HL increases the burden of health care costs and health care system utilization.7 However, when the access to hearing care services with hearing aids (HAs), value to the healthcare system are added and Medicare spending is reduced.8 Nonetheless, the adoption rate of HAs is relatively low, at 34.1% for all individuals reporting hearing difficulty.9 The main reasons for the low uptake rate of HAs are high costs and stigma.9 Therefore, hearing devices, such as over-the-counter (OTC) devices including personal sound amplification products (PSAPs) received significant attention as an alternative to conventional HAs.
The reports from the President’s Council of Advisors on Science and Technology (PCAST) and the National Academies of Sciences, Engineering, and Medicine (NASEM) emphasized HL as being a public health concern and underlined the need for policy changes to increase accessibility and affordability of hearing care.1011 One of the ways is to advocate use of OTC devices in addition to HAs for those with mild to moderate HL. Up to now, however, OTC devices are unregulated by the US FDA12 and there is insufficient evidence for clinical benefit.
The purpose of this study was to explore the effectiveness of PSAPs based on the following three aims: 1) verification of device specification through electroacoustic testing, 2) evaluation of amplification through simulated real-ear measurements (REMs), and 3) comparison of unaided and aided performance based on two HAs and two PSAPs.

METHODS

Participants

A total of 57 patients with HL participated in the study. All patients visited the outpatient clinic of the Department of Otorhinolaryngology between March 2019 and May 2020. All patients got briefed information about the research, and those who agreed to participate signed informed consent before the study started. Inclusion criteria were as follows: 1) age 19 years or older, 2) mentally and physically able to participate in this study, 3) HL of 26 dB or more based on four frequency averages (0.5, 1, 2, and 4 kHz) in both ears, 4) no history of neurological, cognitive, learning, or language disorder at the time of informed consent, and 5) speaks Korean as a first language. Patients were divided into three groups based on the averages of four frequencies (0.5, 1, 2, and 4 kHz) of both ears, patients were divided into three groups: mild hearing loss (MHL) (26–40 dB HL), moderate hearing loss (MDHL) (41–55 dB HL), and moderately severe hearing loss (MSHL) (56–70 dB HL). In this study, 19, 23, and 15 patients were included in the MHL, MDHL, and MSHL, respectively. The participants’ characteristics are shown in Table 1.
Table 1

Participant characteristics

jkms-37-e94-i001
Characteristics MHL (n = 19) MDHL (n = 23) MSHL (n = 15) P value
Age, median (IQR), yr 58 (39–62) 60 (53–64) 55 (28–61) 0.183
Male, No. (%) 7 (36.8) 13 (56.5) 7 (46.7) 0.445
PTA, median (IQR), dB HL
AC, right 37.5 (30–40) 42.5 (41.25–48.75) 60 (56.25–62.5) < 0.001***
AC, left 36.25 (33.75–38.75) 47.5 (41.25–55) 63.75 (57.5–66.25) < 0.001***
Previous HA experience, No. (%)a 3 (15.8) 7 (30.4) 8 (53.3) 0.064
MHL = mild hearing loss, MDHL = moderate hearing loss, MSHL = moderately severe hearing loss, IQR = inter-quartile range, PTA = pure-tone average, AC = air conduction, HA = hearing aid.
aOnly HA experience longer than 3 months is reported.
***P < 0.001.

Hearing devices

Two HAs and two PSAPs were chosen based on popularity, availability, and type. The LiNX 3D (GN Hearing A/S, Ballerup, Denmark) was chosen as the premium HA, and the Nevara1 (Bernafon AG, Bern, Switzerland) was used as the basic HA. The premium HA has 12 channels with additional functions, and the basic HA has only 6 channels. In the case of the PSAPs, the CS50+ (Sound World Solutions, IL, USA) was chosen as the premium PSAP, and the Etymotic Bean (Etymotic Research Inc., IL, USA) was used as the basic PSAP. The premium PSAP has 16 channels and allows user to customize sounds to their amplification preferences and environments. The basic PSAP offers only two levels of enhancement. The HA fittings were performed by experienced audiologists using the National Acoustics Laboratories-Non-Linear prescription, the 2nd generation (NAL-NL2) formula. For the premium PSAP, self-fitting is possible through a dedicated smartphone application. As with the basic PSAP, the participants selected their preferred amplification mode from among the two presets (normal and high). The features of each device are described in Table 2.
Table 2

Features of each hearing device

jkms-37-e94-i002
Devices Model No. Manufacturer Retail cost Type Channel
LiNX 3D (premium HA) LT561-DRW GN Hearing A/S $1,699/each RIC 12
Nevara1 (basic HA) E072007 Bernafon $995/each ITC 6
CS50+ (premium PSAP) CS50+ Sound world Solution $349.99/each BTE 16
Bean (basic PSAP) Bean Etymotic Research, Inc. $299.99/each ITE -
HA = hearing aid, RIC = receiver-in-the-ear, ITC = in-the-canal, PSAP = personal sound amplification product, BTE = behind-the-ear, ITE = in-the-ear.

Outcome measures

This study was composed of three phases: 1) electroacoustic analysis, 2) simulated REMs, and 3) clinical evaluations.

Electroacoustic analysis

Electroacoustic analysis was carried out using the Aurical Hearing Instrument Test (HIT) box and OTOsuite software (GN Otometrics A/S, Ballerup, Denmark) based on ANSI S3.22 standards to determine the quality of the devices. Tests were established according to previous research13141516 including maximum output sound pressure level at 90 dB SPL (OSPL 90), frequency range, equivalent input noise (EIN), and total harmonic distortion (THD). The procedures and tolerances for each test are described below.
  • · OSPL 90: OSPL 90 was measured with a 90-dB SPL pure-tone sweep (0.25–5 kHz) with devices on the full-on-gain setting. OSPL 90 should not exceed 120 dB SPL.141516

  • · Frequency range: Frequency range was measured in the reference test gain setting and refers to the range between the lowest frequency and the highest frequency at which the response curve is 20 dB below its high-frequency average output sound pressure level. We assessed whether the frequency of speech (0.25–6 kHz) was included in each device’s frequency range.1314151617

  • · EIN: The level of internal noise that can be caused by the transmitter and amplifier was measured for EIN. EIN tolerance should be less than 28 dB SPL.1314151618

  • · THD: The input sound pressure of 500, 800, and 1,600 Hz pure tones was used to measure THD. Harmonic distortion can occur due to peak clipping or the electrical circuit of the amplifier. THD should be within 3%.131415161718

Simulated REMs

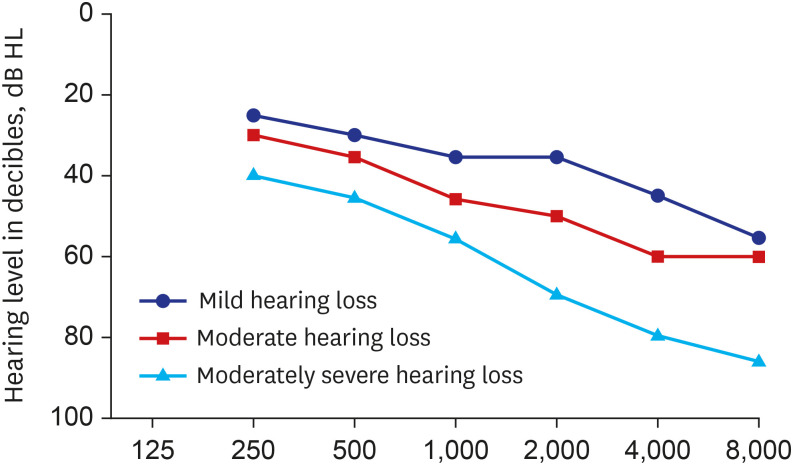
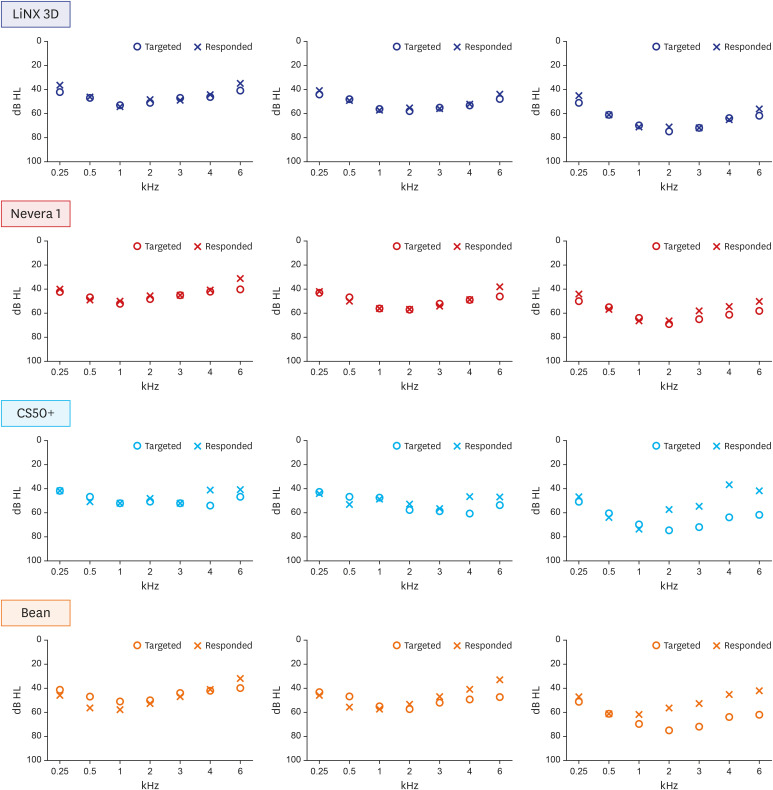
The second phase of the study examined simulated REMs with a 2-cc coupler to evaluate whether the devices provided an appropriate amount of amplification. Target gain, calculated by a fitting formula for three virtual audiograms, and real-ear insertion gain (REIG), calculated through REMs, was compared. The three virtual audiograms were set to the average hearing thresholds of each HL group (Fig. 1). Once the device was placed in the Aurical HIT text box, the International Speech Test Signal (ISTS) at 65 dB SPL was presented, and the gain calculated by fitting formula and REIG was compared. The NAL-NL2 was used. The amount of amplification was considered appropriate if the difference between the target gain and REIG was within 10 dB at five or more of seven frequencies (0.25, 0.5, 1, 2, 3, 4, and 6 kHz).13141516
Fig. 1

Three virtual audiograms for real-ear measurements.

jkms-37-e94-g001

Clinical evaluations

Three main test batteries were administered: 1) sound-field audiometry, 2) word recognition scores (WRS), and 3) the Korean version of the Hearing In Noise Test (K-HINT).
First, unaided and aided sound-field thresholds were obtained. A warble tone of 0.25–6 kHz was presented through a loudspeaker located 1 m from the patient. The 4-frequency averages (0.5, 1, 2, and 4 kHz) for each device were calculated for comparison.
Second, the patient’s speech perception with and without the device was evaluated through the WRS. Twenty-five monosyllabic words from the Korean standard-monosyllabic word list (KS-MWL-A)19 were presented at 65 dB HL through a loudspeaker located 1 m from the patient. The patient was asked to repeat the word back to the tester. Percent-correct scores were calculated for scoring.
Third, K-HINT was performed to assess the patient’s speech recognition in noise.20 Speech spectrum noise was presented through the loudspeaker at a fixed level of 65 dBA. The presentation level of the target speech was adjusted to measure a signal-to-noise ratio (SNR) at which the patient recognized the sentences 50% of the time. The higher was the SNR, the more difficult the patient had hearing in noise.

Statistical analysis

Using descriptive statistical analysis, median and interquartile range (IQR) were used for continuous variables, while numbers and percentages were used for categorical variables. The Friedman test was used to compare clinical outcomes between the five conditions. The Wilcoxon signed-rank test was conducted as a post-hoc analysis. The Bonferroni correction was applied to account for multiple testing. All statistical analyses were completed using SPSS ver. 25.0 (IBM Corp., Armonk, NY, USA).

Ethics statement

This study was approved by the Institutional Review Board (IRB) of Samsung Medical Center and the requirement for informed consent was waived (IRB No. 2018-11-117).

RESULTS

Electroacoustic analysis

All devices showed satisfactory performances in four measurements (OSPL 90, frequency range, EIN, and THD). Regarding the OSPL 90, all four devices were within the tolerance limits (< 120 dB SPL). As for the frequency range, all four devices met the tolerance (250–6,000 Hz). For EIN, all four devices were within the acceptance tolerance (< 28 dB SPL). All four devices also showed appropriate tolerance value for the THD (< 3%) (Table 3)
Table 3

Electroacoustic analysis of the hearing devices included in the study

jkms-37-e94-i003
Devices Electroacoustic analysis resultsa
OSPL 90 (dB SPL) Frequency range (Hz) EIN (dB SPL) THD (%)
500 Hz 800 Hz 1,600 Hz
LiNX 3D (premium HA) 113.8 100–7,157.2 26.3 0.9 0.8 0.5
Nevara1 (basic HA) 110.7 100–6,615.6 26.7 0.4 0.5 2.2
CS50 (premium PSAP) 118.3 103–6,903 27 2 1.5 0.4
Bean (basic PSAP) 97.9 118–6,691 22.4 0.7 0.7 0.7
OSPL 90 = output sound pressure level for 90 dB input sound pressure level, SPL = sound pressure level, EIN = equivalent input noise, THD = total harmonic distortion, HA = hearing aid, PSAP = personal sound amplification product.
aTolerances described in Methods were applied: OSPL90, < 120 dB SPL; frequency range, 250–6,000 Hz; EIN, < 28 dB SPL; TDH, < 3%.

Simulated REMs

For three virtual audiograms, all devices showed an appropriate amount of amplification; the difference between the fitting formula and REIG was within 10 dB at five or more frequencies. However, as for the moderately severe HL, all PSAPs demonstrated a lack of amplification at high frequencies (Fig. 2).
Fig. 2

Simulated real-ear measurement results.

jkms-37-e94-g002

Clinical evaluations

Sound field audiometry

All devices showed significant improvements between aided and unaided thresholds in all groups (Table 4).
Table 4

Clinical evaluation results

jkms-37-e94-i004
Measures Group Test results, Median (IQR) P value Post-hoc analysisa
Unaided LiNX 3D (premium HA) Nevara1 (basic HA) CS50+ (premium PSAP) Bean (basic PSAP) Unaided vs. LiNX 3D Unaided vs. Nevara1 Unaided vs. CS50+ Unaided vs. Bean
Sound-filed audiometry (dB HL) MHL 40.625 (38.75, 43.75) 31.25 (28.75, 35) 36.625 (32.5, 40) 31.875 (30, 36.25) 30.625 (28.75, 32.5) < 0.001*** < 0.001*** < 0.001*** 0.002** < 0.001***
MDHL 48.75 (45, 55) 35 (32.4, 40) 45 (41.25, 50) 40.625 (35, 45) 37.5 (33.75, 42.5) < 0.001*** < 0.001*** < 0.001*** < 0.001*** < 0.001***
MSHL 65 (58.75, 71.25) 45 (41.25, 51.25) 57.5 (53.75, 63.75) 48.75 (42.5, 53.75) 47.5 (45. 55) < 0.001*** < 0.001*** < 0.001*** < 0.001*** < 0.001***
WRS (%) MHL 92 (92, 96) 96 (92, 96) 92 (92, 96) 92 (84, 96) 96 (96, 100) 0.005** 0.024* < 0.001*** 1.000 0.177
MDHL 88 (80, 92) 92 (84, 96) 88 (84, 92) 84 (80, 96) 92 (84, 96) 0.001** < 0.001*** < 0.001*** 1.000 0.027*
MSHL 60 (24, 68) 88 (52, 92) 76 (40, 84) 68 (52, 88) 80 (52, 92) < 0.001*** < 0.001*** < 0.001*** 0.004** < 0.001***
K-HINT (SNR) MHL −0.7 (−1.8, 0.3) −0.6 (−1.6, 1) 1.4 (−0.3, 2.4) −0.2 (−1.6, 0.5) −0.5 (−1.1, 0.3) 0.053 0.002** < 0.001*** < 0.001*** < 0.001***
MDHL 1 (−0.1, 2.8) 0.9 (−0.7, 3.8) 1.4 (−0.1, 2.8) −0.1 (−1.8, 1.9) −0.4 (−1.3, 1.3) 0.007** > 0.99 > 0.99 0.021* 0.011*
MSHL 4.7 (2.6, 12.1) 5.1 (1.8, 10) 3.3 (2.2, 7.4) 3 (0.7, 10.8) 3.3 (0.8, 6) 0.002** 0.202 0.002** 0.179 0.001**
IQR = inter-quartile range, HA = hearing aid, PSAP = personal sound amplification product, MHL = mild hearing loss, MDHL = moderate hearing loss, MSHL = moderately severe hearing loss, WRS = word recognition score, K-HINT = Korean version of the Hearing In Noise Test.
aThe comparison result of each device was corrected by the Bonferroni correction method for type I error increase by multiple comparisons.
*P < 0.05, **P < 0.01, ***P < 0.001.

WRS

For the MHL group, the premium HA (P = 0.024) and the basic HA (P < 0.001) showed significant improvements between aided and unaided conditions. In the MDHL group, the premium HA (P < 0.001), the basic HA (P < 0.001), and the basic PSAP (P = 0.027) revealed significant improvements between aided and unaided conditions. In the MSHL group, all devices demonstrated significant improvements between aided and unaided conditions (Table 4).

K-HINT

For the MHL group, all devices showed significant changes between aided and unaided conditions. In the MDHL group, the premium PSAP (P = 0.021) and the basic PSAP (P = 0.011) revealed significant improvements between aided and unaided conditions. In the MSHL group, the basic HA (P = 0.001) and the basic PSAP demonstrated significant improvements between aided and unaided conditions (Table 4).

DISCUSSION

Our study investigated the effectiveness of four hearing devices using electroacoustic testing, simulated REMs, and clinical evaluations, including sound-field audiometry, WRS, and K-HINT. All devices satisfied the four tolerances for the electroacoustic properties of OSPL 90, frequency range, EIN and THD. All devices provided an adequate amount of amplification for the MHL and MDHL virtual audiograms. However, in MSHL audiogram, the gain was insufficient, especially for high frequencies when using PSAPs. Therefore, it is considered that conventional HAs are more appropriate to the patients with MSHL than the PSAPs. Regarding the sound-field audiometry, all devices showed significant improvement between aided and unaided thresholds in all groups. Significant improvements of WRS were only shown for HAs between aided and unaided conditions. K-HINT did not show any consistent findings for all devices and groups.
The devices that met the tolerances for electroacoustic properties suggest that PSAPs in the study showed comparable electroacoustic performance to HAs. Quality control is performed systematically for HAs based on technical specification sheets of IEC and ANSI standards available from their manufacturers. Product quality, however, varies for PSAPs,18 and it is difficult to perform quality control as they do not have specification sheets. Therefore, it is necessary to closely examine the quality of these devices.
Manchaiah et al.18 claimed OSPL 90, EIN, and THD as the most important factors for assessing the quality of OTC products. Considering that OTC devices would mostly be used by individuals with mild and moderate HL, OSPL 90, in particular, needs to be verified (> 120 dB SPL) to prevent further HL. Additionally, issues, such as feedback and noise must be addressed.18 Some studies reported higher EIN values for low-end OTC devices,1317 but PSAPs used in the study had EIN values within the tolerances set by ANSI (< 28 dB SPL). Higher internal noise can interfere with one’s ability to recognize target speech. THD for most OTC devices as well as all devices investigated in the present study were below the ANSI standard of 3%.1318
Simulated REMs illustrated that all devices provided sufficient gain for the MHL and MDHL audiograms based on the NAL-NL2 formula. However, in moderately severe HL, the gain was insufficient for high frequencies. These results are consistent with prior research showing that the functionality of PSAPs is not sufficient for moderately severe HL.212223 The low gain of high frequencies leads to problems with speech perception. Therefore, HAs that can sufficiently amplify high frequencies are more suitable for those with moderately severe HL.
Comparing aided and unaided sound-field thresholds, all devices showed a significant decrease in hearing thresholds at all frequencies in all groups.21 The WRS significantly improved in all groups with HAs. The reason for no significant differences between aided and unaided conditions with PSAPs could be due to a ceiling effect. For instance, the median WRS for the unaided and premium PSAP conditions was 92% in the MHL group.
For K-HINT, no consistent results were obtained for all groups and devices.16 One probable explanation is that PSAPs equally amplify all frequencies, meaning that both speech and noise were louder. Therefore, hearing devices amplified both noise and speech at the same level, offering no assistance to patients in distinguishing the two.
Though interest in PSAPs has increased around the world, many people remain unfamiliar with the devices.9 In addition, 65% of patients with HL will purchase an HA through hearing healthcare professionals, even though they can purchase OTC devices.9 This result suggests that patients have stronger confidence in HA than in OTC devices. In the study, certain PSAPs were effective for assisting communication in all three HL groups. Therefore, well-chosen PSAPs can be helpful for communication in daily life. An educational and awareness campaign for PSAPs will be necessary in an attempt to increase the accessibility and affordability of hearing rehabilitation. However, the PSAPs selected in the study do not represent all PSAPs available in the market. Thus, the government needs to prepare guidelines for OTC devices, including PSAPs, to control device quality.
There are some limitations to the study. For example, the REMs were not performed on individual patients. In the future, clinical evaluation after REMs would lend to accurate results.
Findings of the study demonstrated PSAPs were beneficial in improving hearing and speech perception in patients with HL. The results suggest that well-chosen PSAPs that were verified through electroacoustic analysis, REMs, and clinical evaluations can be used as an alternative hearing rehabilitation option for people affected by HL.

Notes

Funding: This research was supported by a grant of Patient-Centered Clinical Research Coordinating Center funded by the Ministry of Health & Welfare, Republic of Korea (grant number: HI19C0481, HC19C0128).

Disclosure: The authors have no potential conflicts of interest to disclose.

Author Contributions:

  • Conceptualization: Kim GY, Jo M, Seol HY, Cho YS.

  • Data curation: Kim GY, Kim S, Lim J.

  • Formal analysis: Kim GY, Kim S, Lim J.

  • Funding acquisition: Moon IJ.

  • Investigation: Kim GY, Jo M.

  • Methodology: Kim GY, Jo M, Cho YS.

  • Project administration: Kim GY.

  • Supervision: Moon IJ.

  • Visualization: Kim GY.

  • Writing - original draft: Kim GY, Kim S, Jo M, Seol HY, Cho YS, Moon IJ.

  • Writing - review & editing: Kim GY, Kim S, Seol HY, Cho YS, Lim J, Moon IJ.

References

1. World Health Organization. Deafness and hearing loss. Updated 2021. Accessed May 20, 2021. https://www.who.int/news-room/fact-sheets/detail/deafness-and-hearing-loss .
2. Collins JG. Prevalence of selected chronic conditions: United States, 1990–1992. Vital Health Stat 10. 1997; (194):1–89.
3. Cosh S, Helmer C, Delcourt C, Robins TG, Tully PJ. Depression in elderly patients with hearing loss: current perspectives. Clin Interv Aging. 2019; 14:1471–1480. PMID: 31616138.
4. Dalton DS, Cruickshanks KJ, Klein BE, Klein R, Wiley TL, Nondahl DM. The impact of hearing loss on quality of life in older adults. Gerontologist. 2003; 43(5):661–668. PMID: 14570962.
5. Lin FR, Yaffe K, Xia J, Xue QL, Harris TB, Purchase-Helzner E, et al. Health ABC Study Group. Hearing loss and cognitive decline in older adults. JAMA Intern Med. 2013; 173(4):293–299. PMID: 23337978.
6. Livingston G, Huntley J, Sommerlad A, Ames D, Ballard C, Banerjee S, et al. Dementia prevention, intervention, and care: 2020 report of the Lancet Commission. Lancet. 2020; 396(10248):413–446. PMID: 32738937.
7. Reed NS, Altan A, Deal JA, Yeh C, Kravetz AD, Wallhagen M, et al. Trends in health care costs and utilization associated with untreated hearing loss over 10 years. JAMA Otolaryngol Head Neck Surg. 2019; 145(1):27–34. PMID: 30419131.
8. Willink A, Reed NS, Lin FR. Cost-benefit analysis of hearing care services: what is it worth to medicare? J Am Geriatr Soc. 2019; 67(4):784–789. PMID: 30641615.
9. Powers TA, Rogin CM. MarkeTrak 10: hearing aids in an era of disruption and DTC/OTC devices. Hear Rev. 2019; 26(8):12–20.
10. President’s Council of Advisors on Sciences and Technology (PCAST). Aging America & hearing loss: imperative of improved hearing technologies. Updated 2015. Accessed August 1, 2021. https://obamawhitehouse.archives.gov/sites/default/files/microsites/ostp/PCAST/PCAST%20hearing%20letter%20report.pdf .
11. National Academies of Sciences, Engineering, and Medicine (NASEM). Hearing Health Care for Adults: Priorities for Improving Access and Affordability. Washington, D.C., USA: The National Academies Press;2016.
12. US Food and Drug Administration (FDA). Regulatory Requirements for Hearing Aid Devices and Personal Sound Amplification Products -Draft Guidance for Industry and Food and Drug Administration Staff. Updated 2013. Accessed August 1, 2021. https://www.fda.gov/regulatory-information/search-fda-guidance-documents/regulatory-requirements-hearing-aid-devices-and-personal-sound-amplification-products-draft-guidance .
13. Callaway SL, Punch JL. An electroacoustic analysis of over-the-counter hearing aids. Am J Audiol. 2008; 17(1):14–24. PMID: 18519576.
14. Kim GY, Kim JS, Jo M, Seol HY, Cho YS, Moon IJ. Feasibility of personal sound amplification products in patients with moderate hearing loss: a pilot study. Clin Exp Otorhinolaryngol. 2022; 15(1):60–68. PMID: 33541032.
15. Reed NS, Betz J, Lin FR, Mamo SK. Pilot electroacoustic analyses of a sample of direct-to-consumer amplification products. Otol Neurotol. 2017; 38(6):804–808. PMID: 28595255.
16. Seol HY, Kim GY, Kang S, Jo M, Han UG, Cho YS, et al. Clinical comparison of a hearing aid, a personal sound amplification product, and a wearable augmented reality device. Clin Exp Otorhinolaryngol. 2021; 14(3):359–361. PMID: 33735561.
17. Smith C, Wilber LA, Cavitt K. PSAPs vs hearing aids: an electroacoustic analysis of performance and fitting capabilities. Hear Rev. 2016; 23(7):18.
18. Manchaiah V, Taylor B, Dockens AL, Tran NR, Lane K, Castle M, et al. Applications of direct-to-consumer hearing devices for adults with hearing loss: a review. Clin Interv Aging. 2017; 12:859–871. PMID: 28553093.
19. Kim JS, Lim D, Hong HN, Shin HW, Lee KD, Hong BN, et al. Development of Korean-Standard Monosyllabic Word Lists for Adults (KS-MWL-A). Audiology. 2008; 4(2):126–140.
20. Moon SK, Kim SH, Mun HA, Jung HK, Lee JH, Choung YH, et al. The Korean hearing in noise test. Int J Audiol. 2008; 47(6):375–376. PMID: 18569115.
21. Cho YS, Park SY, Seol HY, Lim JH, Cho YS, Hong SH, et al. Clinical performance evaluation of a personal sound amplification product vs a basic hearing aid and a premium hearing aid. JAMA Otolaryngol Head Neck Surg. 2019; 145(6):516–522. PMID: 31095263.
22. Brody L, Wu YH, Stangl E. A comparison of personal sound amplification products and hearing aids in ecologically relevant test environments. Am J Audiol. 2018; 27(4):581–593. PMID: 30458521.
23. Choi JE, Kim J, Yoon SH, Hong SH, Moon IJ. A personal sound amplification product compared to a basic hearing aid for speech intelligibility in adults with mild-to-moderate sensorineural hearing loss. J Audiol Otol. 2020; 24(2):91–98. PMID: 31842534.
TOOLS
Similar articles