

 PDF
PDF Citation
 Print
Print


INTRODUCTION
The swallowing process includes the coordinated contraction and relaxation of the muscles of the tongue, pharynx, larynx, and esophagus, which is controlled by the central nervous system (CNS) from the brain cortex to the brainstem.123 Any lesion in the path from the CNS to the swallowing muscles can cause difficulty in swallowing, which is referred as dysphagia.45 Dysphagia is a common clinical symptom in patients with cerebrovascular, neuromuscular, and neurodegenerative diseases and with head and neck cancers.678 The videofluoroscopic swallowing study (VFSS) is currently considered the gold standard to accurately diagnose and quantitatively analyze dysphagia.9 Clinicians repeatedly perform a frame-by-frame analysis of spatiotemporal and quantitative parameters in a recorded VFSS video to determine the cause of dysphagia and the appropriate diet.10111213 Therefore, despite being able to objectively observe the entire process of swallowing through VFSS, its interpretation is complex and needs consideration of several factors.9
Recently, deep learning, a technique in artificial intelligence wherein the system learns rules and patterns from the given information, has been increasingly studied in the medical field.14 Deep learning has several advantages in terms of detecting the possible interactions between attributes or variables; hence, it may be useful in diagnosis and prediction.15
The application of the recent developments in deep learning research could reduce the burden over clinicians caused by the complexity of VFSS interpretation. Moreover, to date, no research pertaining to deep learning has been directed to detect the presence of penetration or aspiration in VFSS of patients with dysphagia. Therefore, considering the expected impact on dysphagia management, this study aimed to apply deep learning to detect penetration or aspiration in VFSS of patients with dysphagia automatically.
METHODS
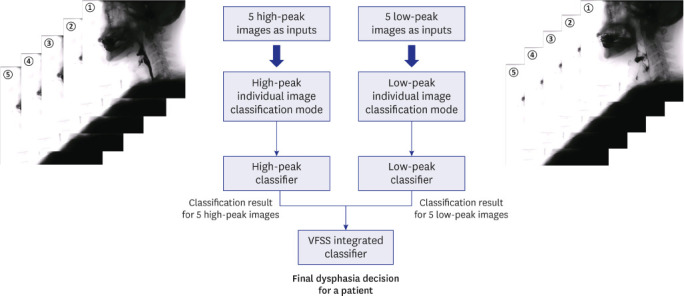
All procedures were carried out in accordance with the relevant guidelines and regulations. We included patients who visited the outpatient clinic of the rehabilitation department, who were admitted to the rehabilitation department of one of the two university hospitals (Ulsan University Hospital and Yeungnam University Hospital) because of dysphagia, or who were diagnosed using VFSS between January 2009 and April 2020. The steps of the modeling process applied in this study are shown in Fig. 1.
Fig. 1
The steps of the modeling process applied in this study.
VFSS = videofluoroscopic swallowing study.
Data collection
The VFSS data of 190 participants with dysphagia were collected. The exclusion criteria were as follows: 1) patients of age less than 20 years; 2) patients who had undergone tracheostomy; 3) patients with facial or cranial anomalies; and 4) patients having metal plate in the cervical spine or facial bone that could develop an artifact.
Analysis of VFSS
When the VFSS was performed, the patients were instructed to seat upright under a videofluoroscopy machine with the head in a neutral position. Boundaries for the frame of videofluoroscopy included the incisors anteriorly, cervical vertebrae posteriorly, nasal border of the soft palate superiorly, and cervical esophagus inferiorly.1617 The fluoroscopic images of swallows were digitally recorded and stored at 30 frames/s.1617
Each VFSS was performed using a bolus of ‘‘thin’’ fluid (1–50 cP). Each patient received a 5-mL bolus delivered using a 10-mL syringe.1617
In the analysis of VFSS, the presence of penetration was determined when the contrast material passed above the true vocal cord, and not below.18 The presence of aspiration was determined when the contrast material passed below the true vocal cord.18 Based on the above criteria, the presence or absence of penetration or aspiration in the dynamic fluoroscopic images was reviewed by two rehabilitation medicine specialists with more than 10 years of clinical experience in dysphagia. Based on the VFSS, patients were classified into normal (without penetration and aspiration), penetration, and aspiration groups.
VFSS image selection
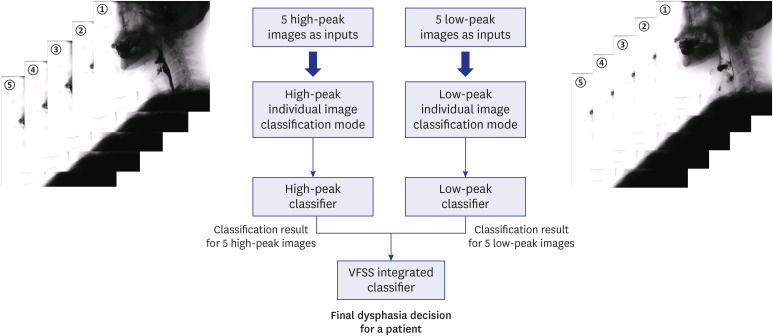
To analyze VFSS by deep learning, we selected five consecutive frame images (at 0.33-s intervals) from the VFSS, back and forth, when the hyoid bone reached the peak (the highest position of the hyoid bone; high-peak image), and another five consecutive frame images from the VFSS when the hyoid bone completely descended from the peak (the lowest position of the hyoid bone; low-peak image) (Fig. 2). Therefore, 10 frame images were selected from one swallowing process (five high-peak images and five low-peak images) for the application of deep learning in the VFSS video of a patient with dysphagia (Fig. 2).
Fig. 2
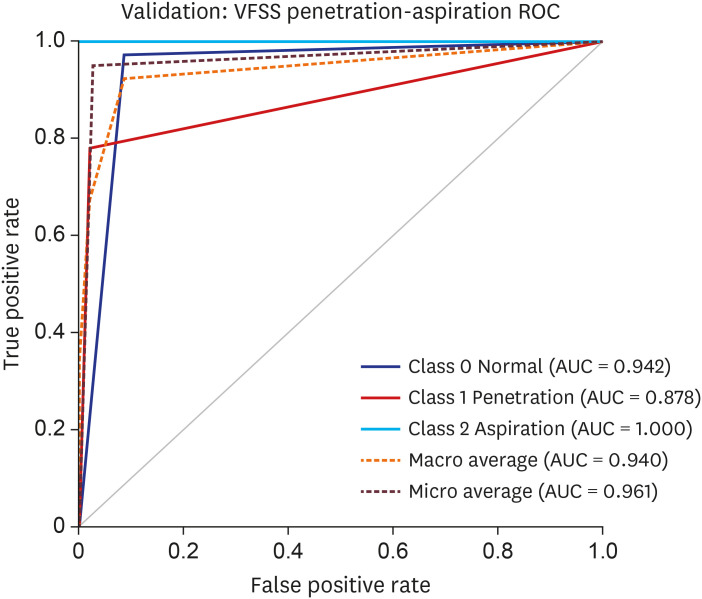
ROC curve for the data validation models. The AUC of the validation dataset of the VFSS images for the convolutional neural network model was 0.942 for normal findings, 0.878 for penetration, and 1.000 for aspiration. For calculating the average AUC, both macro and micro average AUC was employed. Macro average AUC was 0.940 and micro average AUC was 0.961.
AUC = area under the curve, ROC = receiver operating characteristic, VFSS = videofluoroscopic swallowing study.
Deep learning analysis
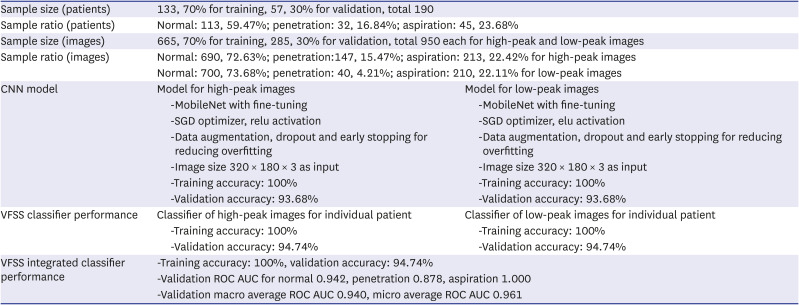
We applied a convolutional neural network (CNN) for deep learning using the Python programming language. TensorFlow 2.6.0 with Keras, and scikit-learn toolkit 0.24.1 were used to train CNN models. The details and performance of the best model are described in Table 1. A CNN consists of one or more convolutional layers, often with a subsampling layer; the convolutional layers are followed by one or more fully connected layers, similar to that in a standard neural network.19 To achieve better learning outcomes, we employed several pre-trained CNN models including efficientnet [B0, B1, and B3],20 mobilenet,21 inceptionV3,22 and Resnet50.23 Both fine-tuning and training from scratch were employed for each CNN model. VFSS images were used as inputs to classify patients with dysphagia into normal (no penetration and aspiration), penetration, or aspiration groups. Training and validation data were randomly assigned using scikit-learn, keeping the ratios of normal, penetration and aspiration the same in both datasets. Of the study population (total 190 patients), 70% (n = 133), 30% (n = 57) were included in the training and validation sets, respectively. Additionally, of the 950 images each for high-peak and low-peak images, 70% (665 images) and 30% (285 images) were used for training and validation, respectively.
Table 1
Performances of the deep-learning model
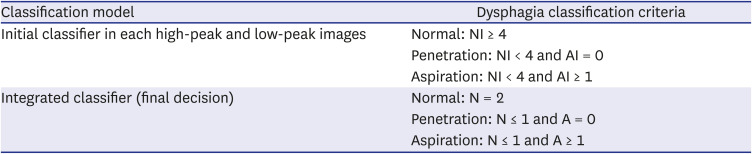
For obtaining the classification model according to VFSS findings (normal, penetration, and aspiration), the classification was initially conducted in both high-peak and low-peak images. We applied the following classification criteria: 1) normal: ≥ 4 normal images (of five images [separately for high-peak and low-peak images]); 2) penetration: < 4 normal images and no aspiration image; and 3) aspiration: < 4 normal images and ≥ 1 aspiration images. The two classifications from the high-peak and low-peak images were integrated into a final classification according to the following criteria: 1) normal: normal in both high-peak and low-leak images; 2) penetration: ≤ 1 normal (in the two classification results) and no aspiration; and 3) aspiration: ≤ 1 normal and ≥ 1 aspiration (Table 2).
Table 2
The criteria for the integration of the classification results of high-peak and low-peak images
Statistical analysis
Statistical analyses were performed using Python 3.8.10 and scikit-learn version 0.24.1. Receiver operating characteristic curve analysis was performed, and the area under the curve (AUC) was calculated. The confidence interval for the average AUC was calculated as bias-corrected and accelerated using the R 4.0.5 and multiROC 1.1.1 package.24
RESULTS
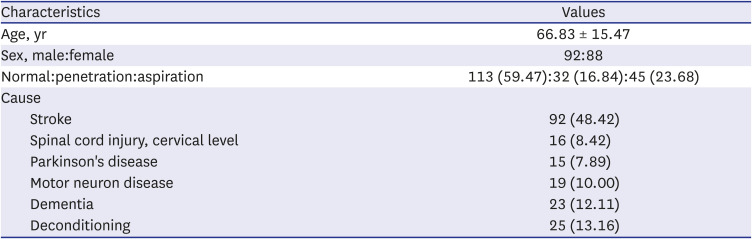
A total of 190 patients (mean age, 66.83 ± 15.47 years; 92 men, 88 women) were included in this study (Table 3). Of the 190 patients, 113 (59.47%) patients were classified in the normal group (no penetration and aspiration), 32 (16.84%) patients in the penetration group, and 45 (23.68%) patients in the aspiration group (Table 1). Additionally, of the 950 high-peak images of 190 patients, 590 images (62.11%) were normal, and 147 (15.47%) and 213 images (22.42%) showed penetration and aspiration, respectively. Of the 950 low-peak images of 190 patients, 700 (73.68%), 40 (4.21%), and 210 (22.11%) showed normal, penetration, and aspiration findings, respectively.
Table 3
Characteristics of patients with dysphagia who were included in this study
The AUC of the validation dataset of the VFSS images for the CNN model was 0.942 for normal findings, 0.878 for penetration, and 1.000 for aspiration. For calculating the average AUC, both macro and micro average AUC was employed. Macro average AUC was 0.940 and micro average AUC was 0.961 (Fig. 2).
DISCUSSION
To the best of our knowledge, this study is the first to use deep learning to detect the presence of penetration or aspiration in VFSS of patients with dysphagia. The results of this study are promising, and the study has high accuracy. Considering that AUCs of 0.7–0.8, 0.8–0.9, and > 0.9 are generally considered acceptable, excellent, and outstanding, respectively, the ability of deep learning models used in this study to detect normal swallowing, penetration, or aspiration is outstanding.25
While neural networks and other pattern detection methods have been utilized for the past 50 years, recently, there has been a significant development in the field of CNN.14 The multiple convolutional layers of the CNN model may be more appropriate for classifying the clinical outcome based on radiologic or other image-based data because of the characteristics of the model such as ruggedness to shifts and distortion in images, limited memory requirement, and easier and better training.19 Detection of a particular finding using CNN has been reported to be rugged to distortions such as changes in shape caused by different poses, lighting conditions, and camera angles, presence of partial occlusions, and horizontal and vertical shifts, if a considerable amount of data set is sufficiently trained.19 Moreover, in the convolutional layer of the CNN, the same coefficients are used across different locations in space; hence, the memory requirement is drastically reduced.19
Several methods of deep learning-based VFSS analysis have been reported in previous studies.91022 Using the single-shot multi-box detector, one of the state-of-the-art deep learning methods for object detection, Zhang et al.26 developed a tracking system for the detection of the hyoid bone. However, the analysis of motion or action in VFSS videos is difficult using this method, because the technique focuses on the detection of a spatial region on a single image rather than on the analysis of a sequence of images from videographic data. Lee et al.910 reported a state-of-the-art video analysis method using an integrated three-dimensional convolutional network for the detection of the pharyngeal phase and for analyzing the swallowing reflex in a VFSS video without manual spatial annotations. While the detection of the pharyngeal phase and analysis of the swallowing reflex are useful for shortening the time required for VFSS by the clinician, they have limitations in that both require further analysis to determine the status of the patients.
To date, most VFSS-based deep learning studies have focused on tracking anatomical structures such as hyoid bones, analyzing the pharyngeal phase, or recording the swallowing reflex time. However, in clinical settings, the most important implication of VFSS is detection of the presence of penetration or aspiration. Therefore, unlike previous studies, the deep learning program developed in this research would be useful to physicians in clinical settings.
There are a few limitations to this study. We could not input the entire video of VFSS for deep learning analysis; we trained the CNN model only by selecting two sets of five consecutive frame images from VFSS of patients with dysphagia. However, in VFSS, we believe that penetration or aspiration usually develops in two phases. If the primary cause of penetration or aspiration is delayed swallowing reflex or reduced laryngeal elevation, the penetration or aspiration usually develops when the hyoid bone is at the high-peak. In the low-peak, over-flow penetration or aspiration can also develop when the amount of pyriformis or vallecular sinus residue increases while the hyoid bone descends (at the end of the swallowing process). Therefore, five consecutive VFSS images in both positions of the hyoid bone (high-peak and low-peak) include considerable moments of penetration and aspiration in VFSS video. This hypothesis was proven correct according to the results of this study, using VFSS with deep learning by means of a CNN, which showed high accuracy. However, for more accurate analysis, deep learning analysis of complete VFSS video images will be necessary in the future.
In conclusion, this study demonstrated that deep learning algorithms, particularly the CNN, could be applied for detecting the presence of penetration and aspiration in VFSS of patients with dysphagia.
 XML Download