

 PDF
PDF Citation
 Print
Print


INTRODUCTION
Injury is a major health issue, accounting for 10.6% of the global burden of disease.1 It is caused by several risk factors beyond the scope of accidental or random injury, and various efforts are made to prevent injury, as prevention and intervention are possible.2 In the past, injury was considered, as the “neglected disease,” however, it is now considered an important cause of mortality and disability worldwide.3
South Korea is one of the top-ranked countries in the Organization for Economic Co-operation and Development (OECD) in terms of injury-related mortality.4 While its safety-related parameters have improved since joining the OECD, they are still high compared to other countries of the OECD.5 In 2015, the socioeconomic disease burden in South Korea was estimated to be 133.73 billion USD (direct: 65.0 billion USD; indirect: 68.6 billion USD), and the total cost of injury was estimated to be 25.4 billion USD (19.0%).6 Injury-related mortality occurs in relatively young individuals between the age group of 15 and 44 years, and this leads to serious loss of productive manpower and socioeconomic loss.7 Considering the sequelae of injuries, repeated hospital admissions and outpatient visits, and changes in aging societies, the economic burden of injury is projected to rise further in the coming years.
A recent study on disease burden in the South Korean population reported that injuries from falls and transport accidents are among the top 10 major causes of disability-adjusted life years, showing that these two causes are associated with a high burden of mortality and disability.8 As per the Korea National Hospital Discharge In-depth Injury Survey (KNHDIS), the number of injuries in the adolescent age group (13–18 years) and young adults/middle-aged group (19–64 years) increased by 1.4-fold and 1.2-fold from 2004 to 2016, respectively.9 In particular, injuries affecting children1011 and older adults1213 may serve as a barrier to promote health in a low fertility, and aging society, and injury is an important target of public health management that requires appropriate preventive and management measures.
In light of the traditional injury pyramid,1415 the order of layers from bottom to top is onset of injury, outpatient visit, emergency visit, hospitalization, and death. Depending on the injury’s mechanism, intentionality, and severity, the injury pyramid has various sizes and shapes, such as inverted pyramid, square pyramid, and normal pyramid.1617 In a study estimating the scale of adolescent injuries, a general pyramid form for death, hospitalization, and emergency department visits was reported, however, intentional self-harm (suicide), showed a steep pyramid form of 1:7:15, showing a significant fatality rate. In the case of motor vehicle collisions, the ratio of 1:195:341 in the form of a gradual pyramid, indicated a low fatality rate and high injury scale.17
Therefore, injury prevention and management studies should be applied differently according to the mechanism and severity of injury. However, in existing studies in Korea, there are many studies on mortality and hospitalization of injuries, respectively, or according to specific age and specific mechanism only.18192021 In the trend study, it is necessary to comprehensively analyze the change in the scale of mortality and hospitalization due to injury by reflecting the change in the demographic structure. This study aimed to investigate the annual changes in crude and age-standardized rates of injury using the cause of death statistics and KNHDIS. Based on these datasets, we aimed to examine the overall trend and current status of injury-related mortality and hospitalization in South Korea and to identify the major mechanisms of injuries and vulnerable age groups to examine the epidemiological features of each mechanism. Furthermore, the findings of this study are intended to be used as basic data to find a targeted approach for injury prevention.
METHODS
Data source
We analyzed the mortality trends in a period of 15 years from 2005 to 2019 using the Cause of Death Statistics microdata published by Statistics Korea. The Cause of Death Statistics is a basic statistical report shedding light on the number of deaths and causes of death in the Korean population to establish population and health care policies. The report has been published annually since 1982, and the causes of death are determined according to the Korean Standard Classification of Diseases (KCD-7th) based on the reports of death; data on infant deaths, which are often unreported, are complemented using reports of cremation and reports in accordance with the Mother and Child Health Act.
The trends and features of injury-related hospitalization in Korea were analyzed using the KNHDIS microdata from 2006–2016. The KNHDIS has been conducted annually by the Korea Disease Control and Prevention Agency (KDCA) since 2005 to utilize the data in devising policies for chronic diseases and injury prevention. To ensure that the data is representative of the target population (all patients discharged from a hospital nationwide), the survey population is determined via two-stage stratified cluster sampling. In the first round, 170 sample hospitals with 100 beds or more that represent the target population are sampled, and in the second round, sample patients that represent all discharge patients in the sample hospitals are identified. Thus, the KNHDIS data is a cross-sectional dataset with a new sample obtained from the target population every year. The survey items include information about the health care facility, sociodemographic and geological information (e.g., sex, age), hospital admission information (e.g., date of admission, date of discharge), disease and treatment information (e.g., principal diagnosis, additional diagnosis, external cause of injury code, principal procedure, additional procedure, treatment and special test code). In addition, for injury patients, information about external causes (e.g., intentionality, site of injury, activity during injury, mechanism of injury, and date of injury) and types of injury (type of transport accident, risk factors and motivation for suicide/self-mutilation attempt, toxic substance involved) are additionally surveyed. In the present study, we used the data to determine the overall number of injuries and the characteristics of each injury mechanism in discharged patients.
Injury classification
Both the Cause of Death Statistics and KNHDIS were classified accordingly. Injuries are classified as S00–T99 in the KCD-7th, and we defined it as codes V01–Y98 according to the mechanism. In this study, complications or complications of other medical or surgical treatments were excluded. For death and hospitalization by mechanism of injury, we classified the codes according to the KCD-7th: V00–V97 as transport accidents, W00–W19 as falls, W65–W74 as drowning, X00–X09 as fire, X30-X39 as natural disasters, X40–X49 as poisoning, X60–X84 as intentional self-harm (suicide), X85–Y09 as assault, and other unclassified codes or codes with unclear intentionality as other. With the exception of intentional self-harm (suicide), assault, and other, the remaining codes were considered unintentional injuries in the analysis.
For hospitalization, hospitalization by transport accident and falls were further analyzed in detail. Transport accidents were analyzed by age and type of transportation, and falls were analyzed by age groups. Ages were divided into < 15 years, 15–64 years, and ≥ 65 years, and type of transportation was divided into pedestrian, bicycle, and motorcycle. Other types of transportations, such as maritime, air, and other, were excluded, as only a small number of cases occurred with minimal changes over the years.
Statistical method
To analyze the yearly trends of injury-related mortality, we computed the number of deaths from 2005–2019 with frequency analysis using the Cause of Death Statistics data. Injury-related hospitalization was analyzed using the KNHDIS data from 2005–2016. More specifically, we calculated the weighted number of hospital admissions with complex sample frequency analysis using the data for discharged injury patients. Based on the numbers of injury-related deaths and hospitalizations, the crude and age-standardized rates were calculated per 100,000 population. The crude rates per 100,000 population were calculated by dividing the number of deaths and hospitalizations by the mid-year population of the corresponding year. Standardized rates per 100,000 population were calculated via the direct standardization technique with the 2005 mid-year population as the reference population. Trends by mechanism of injury were analyzed using the Joinpoint regression program developed by the National Cancer Institute. The changes of injury-related mortality and hospitalization were presented as the average annual percentage change (APC).
Statistical analyses were performed using the SAS 9.4 (SAS Institutes, Cary, NC, USA) software. Additionally, yearly changes were analyzed using the Joinpoint Regression Program (version 4.8.0.1; Statistical Research and Applications Branch, National Cancer Institute, Bethesda, MD, USA).
RESULTS
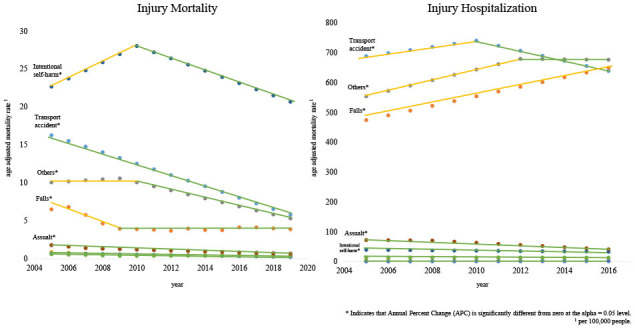
Of 295,110 all-cause deaths in 2019, 27,282 (9.2%) died from an injury. This number and percentage of injury-related deaths is lower than that in 2005 (31,116 out of 245,874 deaths; 12.7%). In 2010, the percentage of injury-related deaths (32,644 out of 255,405 deaths; 12.8%) was slightly higher than that in 2005, but the percentage of injury-related deaths is on a downward trend since. The injury-related death rate was also higher in 2010 (65.41 per 100,000 population) than that in 2005 (63.92 per 100,000 population), but it gradually decreased since, reaching 53.14 per 100,000 population in 2019. Injury-related deaths by age groups is also on a downward trend. The trend does not differ when analyzed by age, but the injury-related death rate slightly rose among the teens (10–19 years) in 2019 (Table 1).
Table 1
Trend injury mortality and hospitalization rate
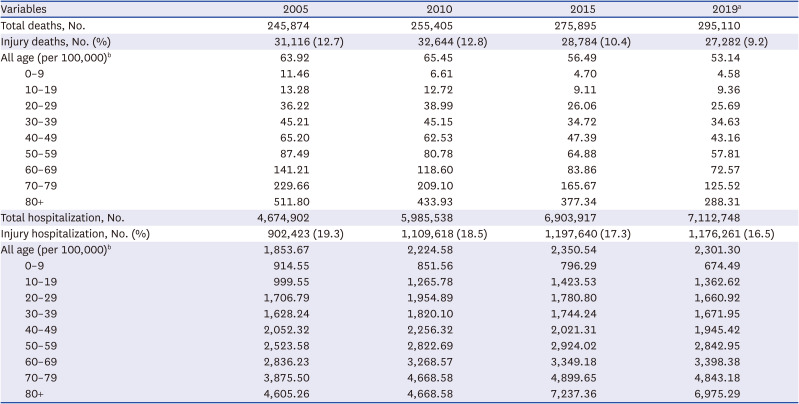
In 2016, a total of 1,176,261 patients were hospitalized due to an injury, which accounted for 16.5% of all discharge patients. The injury-related hospitalization rate (per 100,000 population) is on the rise when the rate is compared between 2005 and 2010. By age, the rate was the lowest among children under the age of 10 years (674.49 per 100,000 population), and this rate is on a decline since 2005. The injury-related hospitalization rate increases with advancing age, with a marked increase in the rate among the ≥ 80 years population from 4605.26 (per 100,000 population) in 2005 to 6,975.29 (per 100,000 population) in 2016 (Table 1).
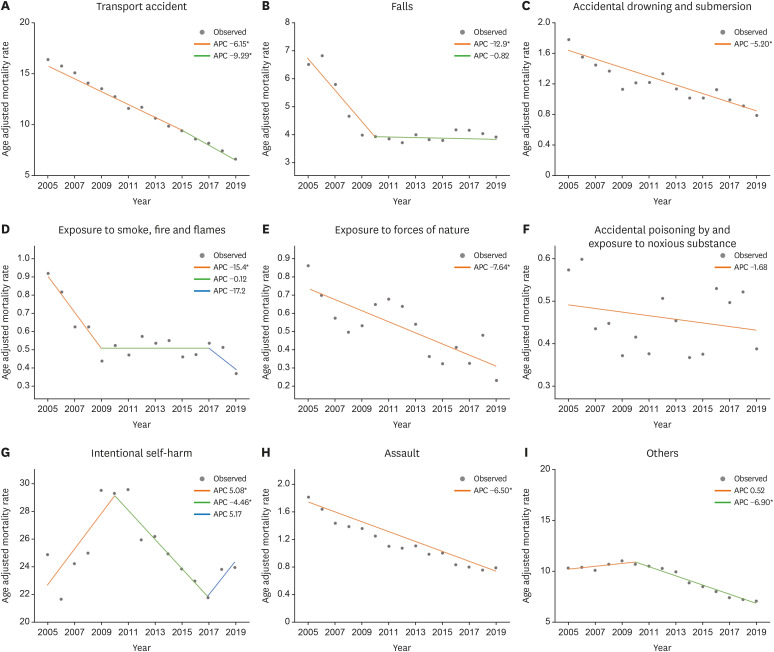
The age-standardized death rates by mechanism of injury from 2005–2019 were on a downward trend overall, but the APC differed by mechanism of injury (Fig. 1). Death by transport accidents is continuously on a decline, with an APC of −6.15%, until 2015. After 2015, Death by transport accidents is on a decline, with an APC of −9.29%. Death by falls was reduced dramatically until 2010 with an APC of −12.9%, but the rate was similar in the subsequent years with little change. Further, death by drowning is consistently on a decline with an APC of −5.2%. Death by natural disaster was consistently on a decline with an APC of −7.64% and death by poisoning changed minimally over the years. On the other hand, death by intentional self-harm (suicide) increased from 2005 to 2010 with an APC of 5.08%, but it began to decline from 2010 to 2017 with an APC of 4.46%. However, after 2017, it has shown an upward trend again. Death by assault it continuously on a decline with an APC of −6.5%. Finally, death by other injury was slightly on an upward trend with an APC of 0.52% from 2005 to 2010, but has been converted to a downward trend since 2010 with an APC of 6.9%.
Fig. 1
Injury age adjusted mortality rate (per 100,000 people) trends by injury mechanism, 2005–2019.
APC = annual percent change.
aIndicates that APC is significantly different from zero at the alpha = 0.05 level.
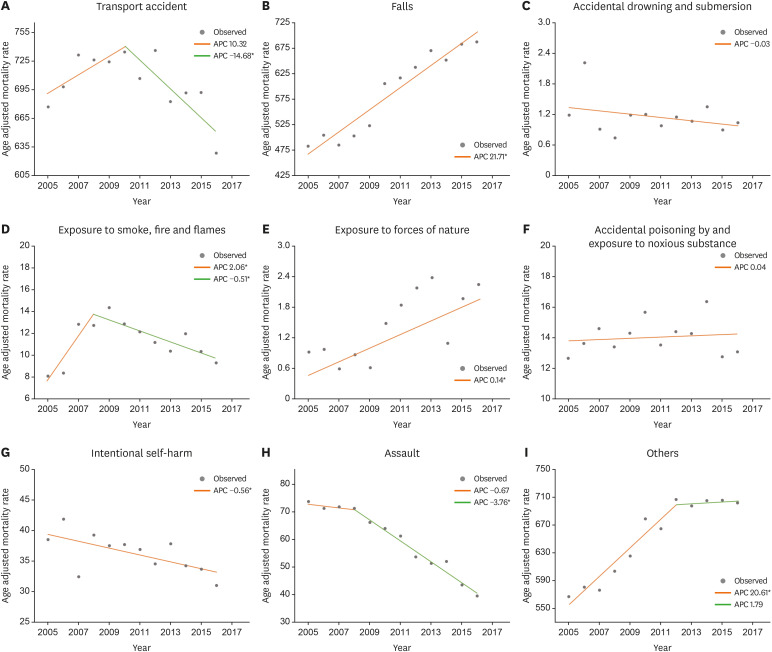
Regarding the age-standardized hospitalization rates by mechanism of injury from 2005–2016, the annual rates of hospitalization due to transport accidents changed from 2010, where it was on an upward trend with an APC of 10.32% until 2010 but changed to a downward trend since 2010 with an APC of −14.68% (Fig. 2). The age-standardized hospitalization rate due to falls is on an upward trend with an APC of 21.71%. For drowning, the APC is about −0.03% and is not statistically significant. The trend in hospitalization due to fire changed from year 2008, where the APC was 2.06% until 2008 but it changed to a downward trend with −0.51% since 2008. On the other hand, hospitalization due to natural disaster increased with an APC of 0.14%. Yearly changes in hospitalization by poisoning were not statistically significant, with an APC of 0.04%. Hospitalization due to intentional self-harm (suicide) is on a consistent decline, with an APC of −0.56%. The trend of hospitalization due to intentional assault (crime) changed from year 2008, where it was on a downward trend with an APC of −0.67% until 2008, after which it took a dramatic decline with an APC of −3.76%. Hospitalization due to other injuries rapidly escalated until 2012 with an APC of 20.61%, but little changes were observed after the year 2012.
Fig. 2
Injury age adjusted hospitalization rate (per 100,000 people) trends by injury mechanism, 2005–2016.
APC = annual percent change.
aIndicates that APC is significantly different from zero at the alpha = 0.05 level.
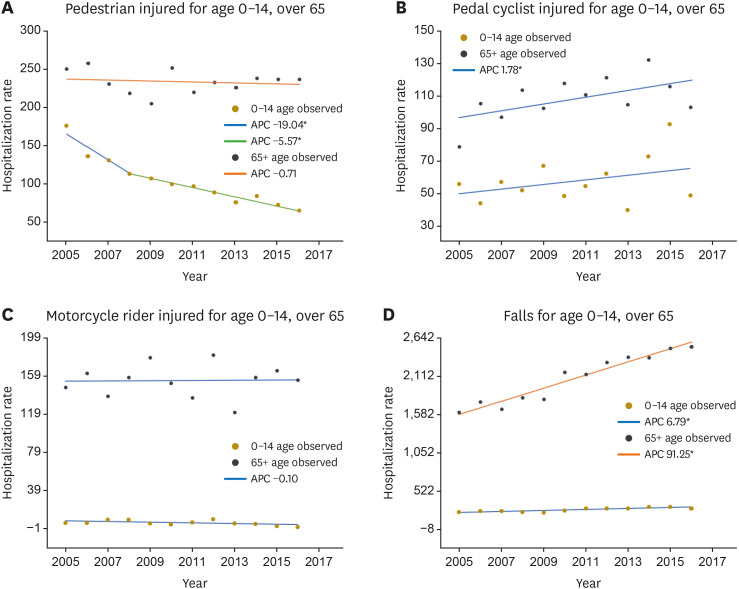
We calculated the APC for hospitalization rates due to transport accidents by three types of mechanisms (pedestrian, bicycle, motorcycle) for 0–14 years group and ≥ 65 years group. For falls, we calculated the APC for hospitalization rates for 0–14 years group and ≥ 65 years group (Fig. 3). In the 0–14 years group, the APC in the hospitalization rate due to pedestrian accidents was −19.04% until 2008, indicating a rapid decline, and it continued to decline consistently since then, with an APC of −5.57%. In contrast, in the ≥ 65 years group, the APC was −0.71%, which was not statistically significant. Hospitalization due to bicycle accidents are on a steady rise for both 0–14 years and ≥ 65 years groups, with an APC of 1.78%. Hospitalization due to motorcycle accidents did not change statistically significantly over the years for 0–14 years and ≥ 65 years groups, with an APC of −0.10%. Hospitalization due to falls is on a rise for the 0–14 years group, with an APC of 6.79%. In the ≥ 65 years group, hospitalization due to falls is on a steep rise, with an APC of 91.25%.
DISCUSSION
In this study, it was found that although the mortality rate due to injury is declining, hospitalization continues to increase. However, there was a difference in the mechanism of injury. For the past 10 years, the age-standardized hospitalization rate due to falls, natural disasters, and other injuries showed a linear increase, while the age-standardized hospitalization rate due to intentional injuries, drowning, and fire decreased. Furthermore, and hospitalization rate due to poisoning did not change. Although the mortality and hospitalization rates are decreasing, transport accident injuries still account for a large proportion of the total injuries. In addition, there was a difference in the change of trend according to the age group and detailed types of external causes. In children, the average APC in hospitalization for pedestrian transport accidents decreased significantly, while bicycle transport accidents increased. In addition, the decrease in the rate of pedestrian transport accidents was insignificant in the elderly population, and the APC in hospitalization for bicycle transport accidents showed an increasing trend. Therefore, in this study, it was found that the trend of hospitalization and death due to injury differed depending on the mechanism and age, and it was found that careful analysis, interpretation, and application are necessary for injury prevention and management.
In the usual disease pattern, the higher the incidence rate, higher is the mortality rate. However, the injury trend over the past decade has shown a different pattern (hospitalization rates increased and, mortality rates decreased). In some cases, the fatality rate was lowered through the trauma care system by designating a regional emergency medical center. In addition, the severity of the pyramid is different for each injury mechanism. The hospitalization rate decreased for transport accidents with a relatively narrow pyramid form, and falls with a wide pyramid form at the bottom because of a larger increase in the hospitalization rate. Studies have suggested that the mortality rate of overall damage decreased because of a decrease in the mortality rate from transport accidents,2223 and in this study, the mortality rate decreased because of a decrease in the hospitalization rate. The incidence of relatively low-severity falls increased, and the overall increase in injury hospitalization rates had insignificant effect on mortality. In 2019, the number of deaths due to transport accidents (8.22 per 100,000 people) decreased significantly compared to 2005 (16.41 per 100,000) (Supplementary Table 1). However, in 2016, the number of hospitalizations due to falls increased (794.17 per 100,000) compared to 2005 (483.17 per 100,000) (Supplementary Table 2). Therefore, attention should be paid to the trend of mortality and incidence according to the pyramid by severity of injury.
Although the incidence of transport accidents remains high, it has decreased significantly over the past 10 years. This is the result of various efforts24 made to reduce transport accidents, such as automobile safety technology, road design, driving speed regulation, and safety education implementation. Many policy interventions, especially efforts for pedestrian safety, have significantly reduced the number of hospitalizations and deaths in children’s due to pedestrian transport accidents.11 However, South Korea’s transport accident mortality rate is 9.7 per 100,000 people, which is higher than the average of the OECD 6.3 (per 100,000 people).4 In addition, since pedestrian transport accidents among the elderly population and bicycle transport accidents of all age groups are increasing recently, it is still a health issue that needs attention.1125
This study showed that falls are a major injury problem in South Korea, especially among children and the elderly individuals. In previous studies, many falls were reported among children before school age, which may be due to the immaturity of physical and mental development and lack of ability to sense danger.26 One in five elderly people have experienced at least one fall,27 and injury in the elderly population is an unavoidable new epidemic in the population, which has entered an aging society.28 We also found that falls significantly increased in the elderly population. Most unintentional falls in the elderly individuals are preventable. The Mayo Clinic suggests steady physical activity and multi-drug management, vitamin D supplementation to improve bone density, safety management at home, and the use of appropriate lighting and auxiliary tools.29 In the future, it will be necessary to actively promote fall prevention programs for the elderly individuals in South Korea.
A peculiar finding of this study is that hospitalization for injuries caused by natural disasters is increasing. The Institute for Health Metrics and Evaluation (IHME) also reported a significant increase in injury deaths due to natural disasters.30 They included injuries from exposure to excessive natural heat and cold, sunlight, earthquakes, volcanic eruptions, storms, floods, and unspecified forces of nature. However, most of the injuries hospitalized in South Korea (approximately 95.9%) are injuries caused by extremely hot and cold weather. Therefore, more attention must be paid to injuries from extreme weather condition due to on-going climate change.
Other injuries encompass unclassified injuries and injuries with unclear intentionality, and while the relevant death rate is declining, it still accounts for a substantial portion. Until 2012, there was a spike in hospitalization due to other injuries, and this rate was higher than that related to other mechanisms of injury. Thus, a more detailed classification of other injuries is needed for more efficient preventive management.
In this study, the increasing trend of hospitalization due to injuries, newly increasing injury mechanisms, and increasing injury types in children and the elderly individuals were identified. One limitation of this study is that we could not compare same time data because of the released time periods at which the cause of death statistics and KNHDIS data are published. Nevertheless, this study is significant as it observed injury-related mortality and hospitalization rates over a long period of more than 10 years and analyzed the trends using a joinpoint regression model. We believe that the results of this study will be reflected as the basis for the prevention and management policy of injuries and contribute in reducing the occurrence of injuries.
 XML Download