

 PDF
PDF Citation
 Print
Print


INTRODUCTION
It has been more than one and a half years since the national implementation of non-pharmacological interventions (NPIs) such as universal mask wearing and physical distancing to control the unprecedented coronavirus disease 2019 (COVID-19) pandemic.123 Additionally, effective vaccines against severe acute respiratory syndrome coronavirus 2 (SARS-CoV-2) have also been introduced.4 However, the COVID-19 pandemic has not subsided and is still causing an increase in the number of cases.5 Reduction in the effect of NPIs, consistently large number of unvaccinated people, and the emergence of SARS-CoV-2 variants may be the primary reasons why the COVID-19 pandemic remains uncontrollable. It is difficult to determine the effects of each of these factors on the COVID-19 outbreak as they act in a complex way. Recently, several researchers reported that the NPIs for COVID-19 suppressed the outbreak of common respiratory virus infections as well as that of COVID-19.67891011121314 The outbreaks of common respiratory virus infections are not directly affected by the COVID-19 vaccination rate or the emergence of SARS-CoV-2 variants; hence, the data of common respiratory virus infection outbreaks help determine the effect of NPIs without being affected by other factors related to the COVID-19 outbreak. Among the common respiratory viruses, non-enveloped viruses such as rhinovirus (RV), human bocavirus (BOV), and adenovirus (ADV) are continuously detected despite the implementation of NPIs during the COVID-19 pandemic, because they are more resistant to environmental challenges or alcohol-based disinfectants than enveloped viruses and can be easily transmitted through not only respiratory droplets but also contacts with unwashed hands.91014 In particular, the incidence of RV infection decreased when the NPIs were strongly implemented but suddenly increased when the implementation of NPIs was relaxed.141516 Because of such distinct inverse relationship between the incidence of RV and intensity of NPI implementation during the COVID-19 pandemic, the incidence of RV was suggested as an indicator of the effect of NPIs.15 Therefore, we aimed to investigate the changes in the effect of NPIs during the COVID-19 pandemic, utilizing the surveillance data of common respiratory viruses, especially RV, BOV, and ADV.
METHODS
The national respiratory virus surveillance dataset from the Korea Influenza and Respiratory Surveillance System (KINRESS) and data on the number of COVID-19 patients were retrieved from the Korea Disease Control and Prevention Agency (KDCA) website, between the first week of 2020 and the 34th week of 2021.5 The KINRESS and its dataset were described in the previous study of our group.14 Resources related to COVID-19 vaccination are available elsewhere.17
Graphs of the weekly positivity rates of each respiratory virus and the weekly number of COVID-19 patients were created. Of the eight respiratory viruses, human coronavirus, influenza virus, parainfluenza virus, human metapneumovirus, and respiratory syncytial virus were rarely detected during the COVID-19 pandemic (Supplementary Fig. 1). Thus, only the graphs of the weekly positivity rates of RV, BOV, and ADV are presented in this study. The respiratory virus data were divided into those before the COVID-19 pandemic and those during the COVID-19 pandemic. The mean values for each week from week 1 to week 52 between 2015 and 2019 were included in the data before the pandemic.
To compare the effects of NPIs on each COVID-19 surge during the pandemic, three intervals for each COVID-19 surge were measured using the graphs showing the number of COVID-19 cases and the weekly RV positivity rate. The KDCA recognized the beginning of the ongoing surge and implemented higher-intensity NPIs (as the starting point). As an effect of the NPIs, the number of patients with COVID-19 did not increase further, peaked, and then began to decrease (a point of the first visible effect). As the effect of NPIs continued, the weekly RV positivity rate decreased to the lowest point (a point of the maximum effect). After the effect of NPIs temporarily decreased, it started to increase again (a point at which the effect decreased). The time interval from the starting point to the point of first visible effect, that from the point of first visible effect to the point of the maximum effect, and that from the point of the maximum effect to the point at which the effect decreases were defined as time interval 1 (T1), time interval 2 (T2), and time interval 3 (T3), respectively. In other words, T1 indicates the time to the first identifiable effect of NPIs, T2 is the time to the maximum effect of NPIs, and T3 is the duration of the maximum effect of NPIs. For RV, additional data were obtained by determining the difference between the weekly positivity rate of the COVID-19 pandemic and the mean positivity rate of the corresponding week between 2015 and 2019. This was marked as RVdiff. This value was used as an indicator to show whether the effect of NPIs is sufficient to decrease the current weekly RV positivity rate to a level lower than that of the pre-pandemic period. For each week, the RVdiff was calculated by subtracting the positive rate during the pre-pandemic period from that during the pandemic period. If the effect of the current NPIs is sufficient to suppress the current RV incidence more than the usual RV incidence, the value of RVdiff becomes zero or less. The number of weeks for RVdiff to be below zero (time to RVdiff of ≤ 0) and number of weeks RVdiff remains below zero (duration of RVdiff of ≤ 0) after the implementation of stronger NPIs were measured. We also investigated whether the BOV and ADV exceeded the maximum weekly activity of BOV and ADV in the 2015–2019 period despite the application of NPIs.
During the study period, NPIs were initially applied in three stages (levels 1, 2, and 3), then changed to five stages (levels 1, 1.5, 2, 2.5, and 3) on November 7, 2020 and four stages (levels 1, 2, 3, and 4) on January 1, 2021. Details of the officially announced level of intensity of NPIs can be found in the previous study of our group and the KDCA homepage.514 The date of the change in NPI intensity level and the corresponding week number are listed in Supplementary Table 1. The change date of the NPI intensity level was based on the date that the interventions were implemented in metropolitan areas, including Seoul, Incheon, and Gyeonggi-do.5 This is because nearly half of the entire population of South Korea lives in this area; moreover, except for the first outbreak of COVID-19 in Daegu and Gyeongsangbuk-do, COVID-19 patients in the metropolitan area accounted for the majority of all confirmed cases.5
RESULTS
In South Korea, four COVID-19 surges were reported during the study period, and three had already passed; the fourth COVID-19 surge is currently underway (Fig. 1). The number of vaccinated people was reported from the 12th week of 2021; approximately 50.1% of the total population received one or more COVID-19 vaccinations, while 22.4% completed the vaccination schedule at the end of the study period (the 34th week of 2021) (Fig. 1). The delta variant was first reported by the KDCA on April 18, 2021 (19th week); in a report by the KDCA on July 13 (29th week), more than 60% of SARS-CoV-2 viruses that were investigated were delta variants (Fig. 1).
Fig. 1
Weekly numbers of patients with COVID-19 and of persons who received COVID-19 vaccination between the first week of 2020 and the 34th week of 2021 in South Korea. The dark blue line indicates the weekly number of COVID-19 patients. The orange line indicates the weekly proportion of people who received more than one dose of COVID-19 vaccination. The red line indicates the weekly proportion of those who have completed the vaccination schedule. Black circles with white numbers indicate the four COVID-19 surges. Boxes indicate the comments related to the appearance of the delta variant in South Korea. Each week is designated by a four-digit number (YYWW) (e.g., 2012 and 2112 indicate the 12th week of 2020 and 2021, respectively).
COVID-19 = coronavirus disease 2019, SARS-CoV-2 = severe acute respiratory syndrome coronavirus 2.
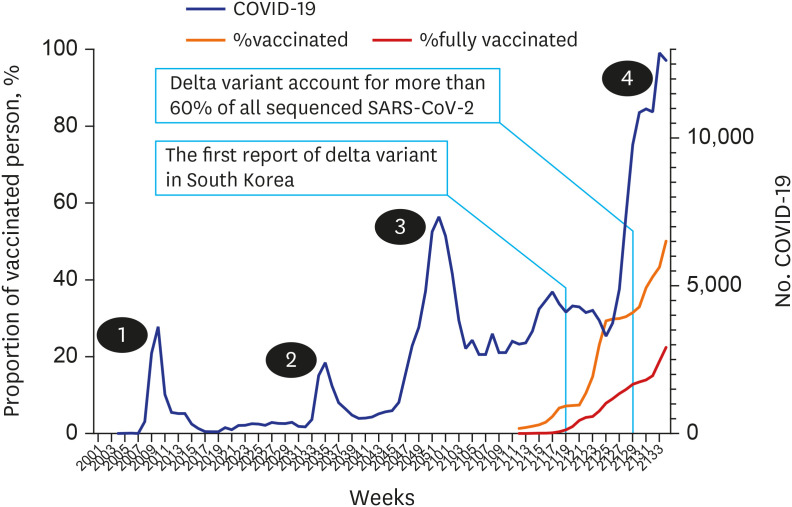
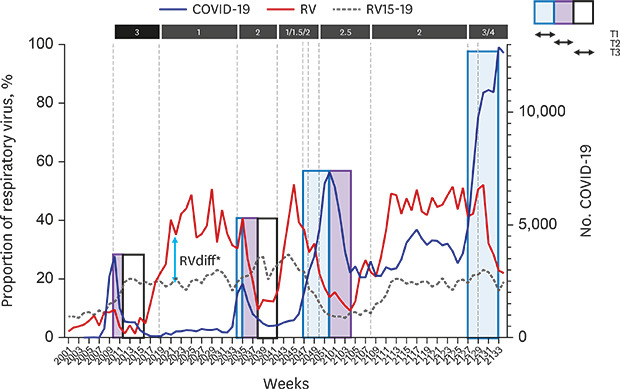
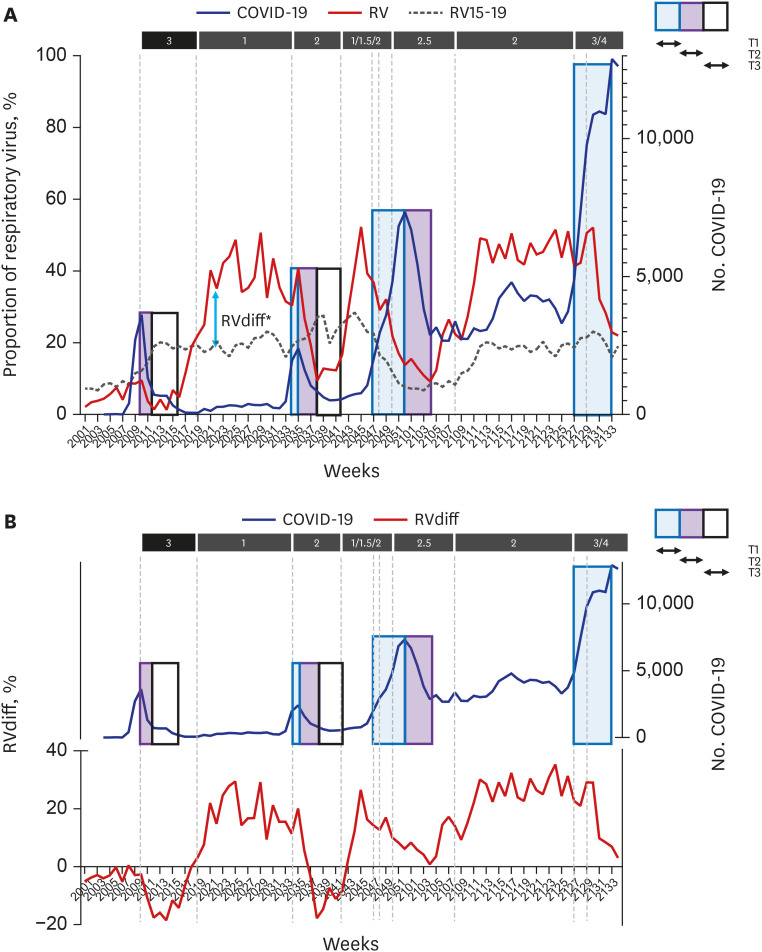
Fig. 2A shows the change in the level of intensity of NPIs, the weekly number of COVID-19 patients, and the weekly RV positivity rate before and after the COVID-19 pandemic. T1, T2, and T3 are presented in Supplementary Table 2. T1 (time to the first visible effect) and T2 (time to the maximum effect) increased as the pandemic progressed, but T3 (duration of the maximum effect) decreased. Compared with the first and the second surges, changes in T1 and T3 were evident in the third surge starting from the 47th week (mid-November) of 2020. The RVdiff value has been added to Fig. 2B. In each surge, the RVdiff value must drop close to zero before the number of COVID-19 patients stops increasing. For the same reason, the T1 value increases as “time to RVdiff of ≤ 0” increases (Supplementary Table 2). In the first to third surges, the maximum effect of NPIs was maintained only when the RVdiff was ≤ 0. For the same reason, T3 value decreases as the “duration of RVdiff of ≤ 0” decreases (Supplementary Table 2). As the pandemic progressed, the “time to RVdiff of ≤ 0” increased and the “duration of RVdiff of ≤ 0” decreased. In the third surge, the “time to RVdiff of ≤ 0” increased to 9 weeks. As it took a long time for the NPIs to become sufficiently effective to make the RVdiff close to zero, the number of COVID-19 patients continued to increase, and the peak of the surge also increased (Fig. 2B). In the third surge, the “duration of RVdiff of ≤ 0” decreased to one week. Because the NPIs’ effect of decreasing the RVdiff below zero did not last, the number of COVID-19 patients could not be sufficiently reduced and the number after the surge did not return to the pre-surge level (Fig. 2B).
Fig. 2
(A) Weekly number of patients with COVID-19, weekly positivity rate of RV during the pandemic, and the level of intensity of non-pharmacological interventions against COVID-19 between the first week of 2020 and the 34th week of 2021 in South Korea. (B) Weekly value of RVdiff. The dark blue line indicates the number of COVID-19 patients. The red line indicates the weekly positivity rate of RV during the pandemic. The dotted line indicates the weekly mean positivity rate of RV before the pandemic (2015–2019). RVdiff indicates the difference in the weekly RV positivity rate between the pandemic period and the pre-pandemic period (in Fig. 2A, an example of RVdiff is introduced). The three boxes indicate the time to the first visible effect (T1), time to the maximum effect (T2), and duration of the maximum effect (T3) of non-pharmaceutical interventions implemented in each COVID-19 surge. Each week is designated by a four-digit number (YYWW) (e.g., 2012 and 2112 indicate the 12th week of 2020 and 2021, respectively).
COVID-19 = coronavirus disease 2019, RV = rhinovirus.
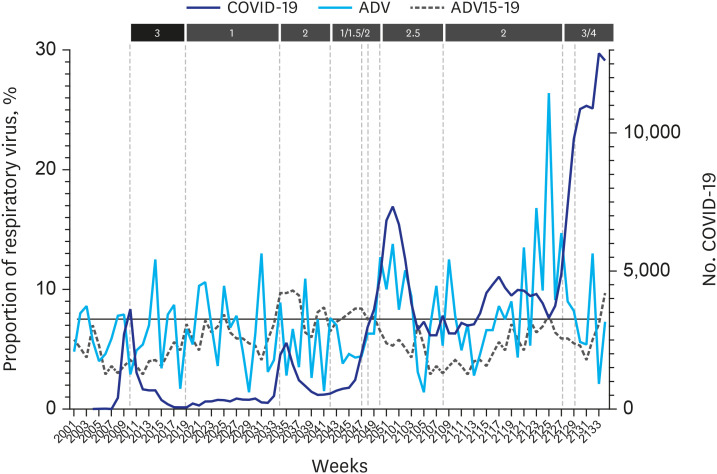
In Fig. 3, the weekly positivity rate of BOV during the pandemic exceeded the maximum value of the mean weekly positivity rate of the pre-pandemic period in the third surge (between the 47th week of 2020 and 17th week of 2021) and before the fourth surge (between the 13th week and 28th week of 2021). In Fig. 4, the weekly positive rate of ADV exceeded the maximum value of the mean weekly positive rate of the pre-pandemic period before the fourth surge (between the 23rd week and 28th week of 2021).
Fig. 3
Weekly number of patients with COVID-19, weekly positivity rate of human BOV during the pandemic, and the level of intensity of non-pharmacological interventions against COVID-19 between the first week of 2020 and the 34th week of 2021 in South Korea. The dark blue line indicates the number of COVID-19 patients. The orange line indicates the weekly positivity rate of BOV during the pandemic. The dotted line indicates the weekly mean proportion of BOV before the pandemic (2015–2019). The horizontal line indicates the maximum value of the weekly mean proportion of BOV before the pandemic. Each week is designated by a four-digit number (YYWW) (e.g., 2012 and 2112 indicate the 12th week of 2020 and 2021, respectively).
COVID-19 = coronavirus disease 2019, BOV = bocavirus.
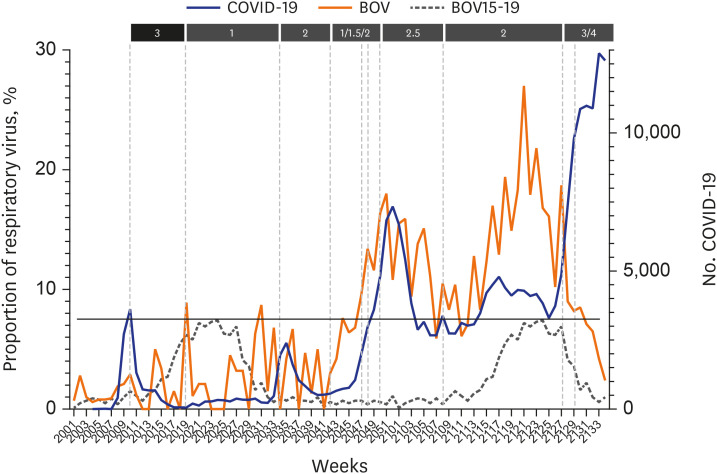
Fig. 4
Weekly number of patients with COVID-19, weekly positivity rate of ADV during the pandemic, and the level of intensity of non-pharmacological interventions against COVID-19 between the first week of 2020 and the 34th week of 2021 in South Korea. The dark blue line indicates the number of COVID-19 patients. The light blue line indicates the weekly proportion of ADV during the pandemic. The dotted line indicates the weekly mean proportion of ADV before the pandemic (2015–2019). The horizontal line indicates the maximum value of the weekly mean proportion of ADV before the pandemic. Each week is designated by a four-digit number (YYWW) (e.g., 2012 and 2112 indicate the 12th week of 2020 and 2021, respectively).
COVID-19 = coronavirus disease 2019, ADV = adenovirus.
DISCUSSION
Based on the national respiratory virus surveillance data, especially those of RV, BOV, and ADV, during the pandemic, as the pandemic continued, the effect of NPIs appeared slower, the duration of the effect became shorter, and the intensity of the effect also decreased. These changes were clearly observed even less than a year after the onset of the COVID-19 pandemic.
South Korea responded to the COVID-19 pandemic only by implementing NPIs for more than a year before the COVID-19 vaccination began. Through high compliance with NPIs, until recently, the number of COVID-19 patients in Korea was less than 250,000 (less than 0.5% of the total population) and the prevalence of SARS-CoV-2 antibody in 1,200 people living in the metropolitan area was only 0.33%.5 However, Korea is currently experiencing the fourth COVID-19 surge. The recently emerged delta variant has been reported to have a higher viral load and higher transmissibility than the alpha variant which caused the previous surges in the United Kingdom and other European countries,18 and has been identified as the most influential factor in the fourth surge. However, based on the data of this study, it is difficult to attribute the cause of the fourth surge to the delta variant alone because a decrease in the effect of NPIs was observed prior to the emergence of the delta variant and gradually progressed thereafter. It is a situation in which the effect of NPIs needs to be strengthened further in order to combat the highly transmissible delta variant, but doing so is not simple. With the implementation of stronger NPIs for each surge, the response to the warning signal slows and weakens, even though the same strong warning signal is transmitted through all available media. It is thought that the fatigue phenomenon of warning signals and NPIs started less than a year after the pandemic and have continued. Given the chronic aspect of this change, there is no groundbreaking way to further motivate people, who are already exhausted of looking out for strong warning signals and strictly implementing NPIs, other than a forced lockdown that ignores the importance of individual social and economic activity. Therefore, the COVID-19 response strategy must be completely overhauled.
Intuitive analysis of the data of this study shows that T2 and T3 values obtained using the RV data, in addition to the T1 obtained using the COVID-19 data, are helpful in showing the rate of the NPI effect and the duration of the effect. Additionally, analysis using the RVdiff value shows that the effect of NPIs may stop the COVID-19 surge and reduce the number of COVID-19 patients to pre-surge levels only if the NPIs can decrease the RVdiff to below 0 and the condition must be maintained for a sufficient period of time. The reason that the changes in RV incidence reflects the effect of NPIs well in real time is thought to be because this data itself is a weekly data and the median incubation period of RV is very short, about 1.9 days.19 The positivity rates of BOV and ADV increased to a level that was not observed five years prior to the pandemic. These extraordinary changes in BOV and ADV preceded the third or fourth surge or occurred simultaneously with the surge. Thus, they may also be considered as indicators of the decrease in the effect of NPIs. Although it is necessary to compare the changes in the positivity rate of these common respiratory viruses with those of other indicators related to the effect of NPIs, even with the results of this study, data of common respiratory viruses are of great help in predicting the effect of NPIs.
A major limitation of this study is that the number of samples obtained from KINRESS decreased after the onset of the COVID-19 pandemic (Supplementary Fig. 2). The accuracy of the respiratory virus incidence data obtained from a small number of samples and the comparability with the data obtained from a larger number of samples before the pandemic may be questioned. In other words, the changes in RV incidence might be affected by those in the number of samples rather than those in the actual amount of RV infection. We have previously mentioned in a study of our group that it is difficult to see that the changes in RV incidence after the pandemic are simply due to a decrease in the number of samples, citing several reasons.14 Therefore, we estimate that even if there was an effect of decreasing number of samples, it would not have had a significant impact on the major findings of this study.
In conclusion, the common respiratory virus data during the COVID-19 pandemic suggest that NPIs are losing their effect and that a new response strategy is needed. Appropriate use of RV, BOV, and ADV data may help determine the effect of NPIs during a pandemic.
 XML Download