

 PDF
PDF Citation
 Print
Print


INTRODUCTION
Idiopathic pulmonary fibrosis (IPF) is a chronic progressive fibrosing interstitial pneumonia with unknown etiology. The clinical course of IPF patients varies from gradual progression to acute deterioration, and the median survival is 2.5–3.5 years after diagnosis.1 Assessment of IPF disease severity is crucial for selecting future treatments such as lung transplantation or determining the risk of invasive procedures.23 Several parameters including lung function (forced vital capacity [FVC] or diffusing capacity for carbon monoxide [DLco]), exercise capacity, and the extent of fibrosis on high-resolution computed tomography (CT) scan are reportedly associated with disease severity and prognosis in IPF patients456; however, their predictive capacity may be limited by insufficient respiratory effort, complications such as emphysema or pulmonary hypertension, or inter-observer variability.789
18F-fluorodeoxyglucose (18F-FDG), an analog of glucose, provides information on glucose metabolism in brain10 or cancer lesion.11 Therefore, 18F-FDG positron emission tomography with CT (PET/CT) is used to evaluate the potential malignancy of lung nodules and screen for hidden lesions by detecting increased 18F-FDG uptake in cancer patients.1213 The 18F-FDG uptake is reportedly increased in fibrotic areas (reticulation and honeycombing) in diffuse parenchymal lung diseases14 due to increased glucose transporter-1 (Glut-1) expression in inflammatory cells and erythrocytes, as a result of neovascularization in fibrotic areas.1415 Previous studies, including IPF patients (n = 18–31), reported that 18F-FDG uptake in fibrotic areas is significantly associated with the FVC, DLco, total lung capacity (TLC), C-reactive protein (CRP) level, lactate dehydrogenase level, Krebs von den Lungen-6 level, surfactant protein-D level1416171819 and prognosis such as decline in lung function (FVC, DLco), transplant-free survival, death, and disease progression (death, acute exacerbation [AE], more than 10% decline in FVC or 15% decline in DLco).16171819 However, the number of patients in these studies was relatively small and the utility of differences in baseline FDG value or air density distribution adjusted 18F-FDG uptake values is not well known in IPF.
This study aimed to investigate the value of 18F-FDG PET/CT for assessing disease severity and prognosis in IPF patients and to identify the superior parameter among various standardized uptake values (SUVs) parameters.
METHODS
Subjects
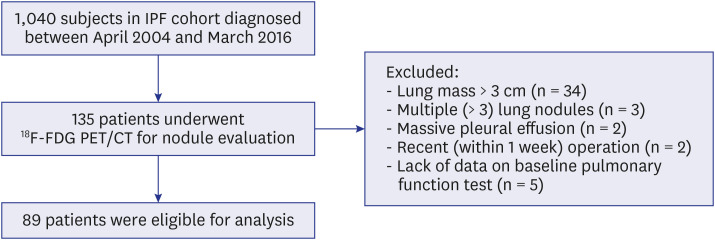
A total of 135 IPF patients who underwent 18F-FDG PET/CT for evaluation of lung nodules or cancer staging between April 2004 and March 2016 at Asan Medical Center, Seoul, Republic of Korea, were screened for enrollment among 1,040 IPF cohort (Fig. 1). Forty-one patients were excluded for the following reasons that could affect the 18F-FDG uptake in fibrotic areas: 1) lung mass (> 3 cm in diameter, n = 34), 2) multiple lung nodules (> 3, n = 3), 3) massive pleural effusion (n = 2), and 4) recent (within 1 week) thoracic surgery before PET/CT (n = 2). Five patients without lung function data were also excluded. Finally, 89 IPF patients (biopsy-confirmed cases: 34.8%) were included in this study (Fig. 1). All patients fulfilled the IPF diagnostic criteria of the American Thoracic Society/European Respiratory Society/Japanese Respiratory Society/Latin American Thoracic Association, and the Korean guideline.2021
Clinical data
The clinical and survival data of all patients were retrospectively collected from medical records, telephone interviews, and/or the National Health Insurance records of Korea. Spirometry, DLco, and TLC by plethysmography were measured according to previous recommendations.72223 All clinical parameters including demographics, lung function, exercise capacity, and CRP were obtained within one month before and after the PET-CT and the median time from IPF diagnosis to PET-CT was 19.5 months (interquartile range [IQR]: 4.2-49.6 months). The six-minute walk test (6MWT) was performed according to the American Thoracic Society guidelines.24 The gender-age-physiology (GAP) index and GAP stage, which are designed to predict the mortality of IPF patients, were calculated using the GAP model, which consists of the following baseline variables: sex, age, and lung function (FVC and DLco).25 AE was defined as the acute worsening of dyspnea typically within 30 days with new bilateral lung infiltration, which was based on a 2016 report by an international working group.26 The follow-up period was defined from date of PET-CT to date of death, lung transplantation or last follow-up.
PET/CT imaging protocol and analysis
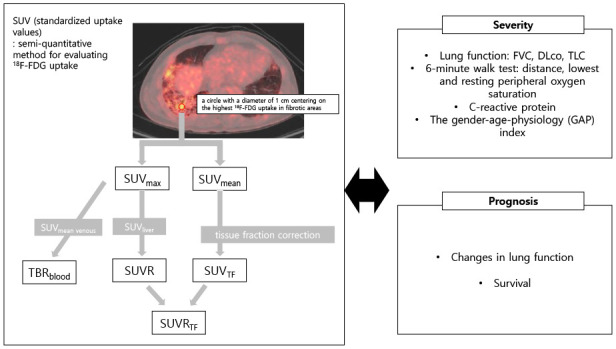
Patients fasted for > 6 hours before 18F-FDG PET/CT, and the blood glucose level was maintained at < 8.33 mmol/L (150 mg/dL) before PET/CT. 18F-FDG (5.18-7.4 MBq/kg [0.14–0.2 mCi/kg]) was injected and PET/CT was performed within 50-70 minutes after 18F-FDG administration. The following scanners were used: Biograph Sensation 16 (Siemens, Knoxville, TN, USA), Biograph TruePoint 40 (Siemens), Discovery STe 8 (GE Healthcare, Milwaukee, WI, USA), Discovery 690 (GE Healthcare), Discovery 690 Elite (GE Healthcare), or Discovery 710 (GE Healthcare). PET images were obtained using 3D mode from the base of the skull to the mid-thigh with 5-8 beds for 2-3 minutes each, according to the PET/CT scanner used. Reconstructed PET images were acquired using an iterative algorithm with attenuation correction to CT images. 18F-FDG uptake of fibrotic area of the lung except lung nodules was assessed semi-quantitatively using the SUV27 by a nuclear medicine board certified physician (S.H.L. 8-year experience in nuclear medicine) on Advantage Workstation 4.6 (GE Healthcare) (Fig. 2 and Supplementary Fig. 1). We calculated maximum SUV (SUVmax) from the highest voxel value in the fibrotic area of the image slice. To measure the mean SUV (SUVmean), a red circle with a diameter of 1 cm was drawn centered on SUVmax. The fibrotic area of lung was confirmed in a low-dose CT image in PET/CT series or the most recent 1-mm thin slice image of chest CT. During the shots, the patient was instructed to do shallow breathing. The SUV was calculated with the following formula: SUV = 18F-FDG activity in a region of interest (Bq/mL)/(injected 18F-FDG activity [Bq]/lean body mass [g]).
Fig. 2
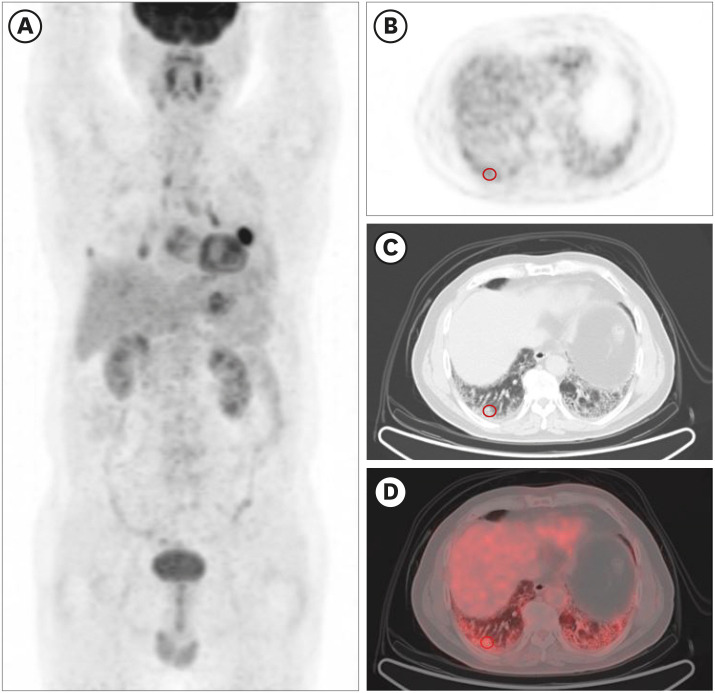
Measurement of the standardized uptake value in the fibrotic area in 18F-FDG positron emission tomography/computed tomography images. (A) A coronal PET image. (B) A horizontal PET image. (C) A CT image. (D) A combined PET and CT fusion image. The red circles indicate the 1 cm diameter area centering on the highest 18F-FDG uptake in fibrotic areas. Both maximum standardized uptake value and mean standardized uptake value were measured in this circle.
18F-FDG = 18F-fluorodeoxyglucose, PET = positron emission tomography, CT = computed tomography.
Because the SUV is affected by multiple factors (e.g. inhomogenous density of fibrotic lung, different resolution of various PET/CT machines, and measurement methods), we described 18F-FDG uptake with five different SUV parameters by correcting confounders. The SUVmax was estimated based on the highest 18F-FDG uptake in fibrotic areas and SUVmean, defined as the mean values measured by drawing a circle with a diameter of 1 cm centering on SUVmax, were obtained. The SUV ratio (SUVR), defined as SUVmax of fibrotic area divided by SUVmean of the liver (measured by drawing a 3 cm-sized circle in the right hepatic lobe), was calculated to adjust the differences in SUVs among individuals.28 Tissue fraction-corrected SUVmean (SUVmeanTF), suggested by Lambrou et al.29 and SUVR (SUVRTF, defined as SUVmeanTF-to-liver SUVmean ratio) were also obtained; the lung is a mixture of parenchyma and air, so correction for the effect of air (tissue fraction correction) is needed to assess the true FDG uptake of lung parenchyma. Moreover, the target-to-background ratio (TBR; SUVmax/minimum SUV [SUVmin]) and the tissue-to blood ratio (TBRblood; SUVmax/mean inferior vena cava blood SUV) were calculated to adjust SUV background activity.30
Statistical analysis
All values are expressed as the mean ± standard deviation for continuous variables or as percentages for categorical variables. Death was defined as the primary outcome, and lung transplantation was considered an equivalent outcome to death. Spearman's correlation coefficient was used to assess correlations of SUVs and clinical parameters. Univariate Cox proportional hazard regression analyses were used to identify the risk factors for mortality and multivariate analysis included SUVs with P < 0.1 separately, along with FVC, DLco, and distance during 6MWT. All statistical analyses were performed using SPSS 23.0 (IBM Corp., Armonk, NY, USA). A P value of < 0.05 was considered statistically significant.
RESULTS
Baseline characteristics
The median follow-up period was 51 weeks (IQR, 21.0–119.0 weeks). Of all patients, the mean age was 68.1 years, 94.4% were male, and 91.1% were ever-smokers (Table 1). The patients had moderate lung function impairment and most (89.9%) had a GAP stage of I or II. Most patients underwent PET/CT for pulmonary nodule evaluation (85.4%), followed by a staging work up (14.6%), and 68.5% were finally diagnosed with lung cancer (n = 61; non-small lung cancer [NSCLC]:56 [stage I: 31, stage II: 6, stage IIIA: 10, stage IIIB: 3 stage IV: 6], small cell lung cancer [SCLC]: 5 [limited: 4 extensive: 1]). Patients with lung cancer showed more ever-smokers, longer distance and higher the minimum peripheral oxygen saturation (SpO2) during 6-minute walk test (6MWT) than those without, but other clinical characteristics and SUV parameters were not different between two groups (Supplementary Table 1).
Table 1
Baseline characteristics of the patients
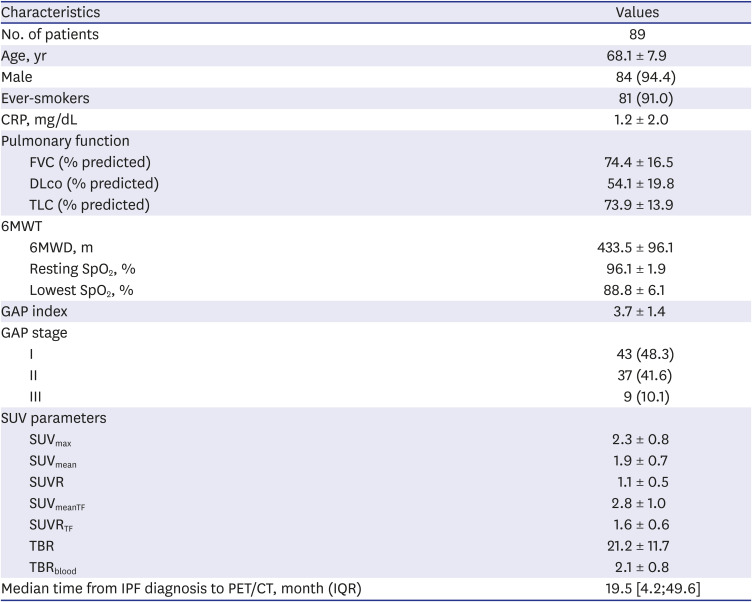
Data are presented as the mean ± standard deviation or number (%), unless otherwise indicated.
CRP = C-reactive protein, FVC = forced vital capacity, DLco = diffusing capacity for carbon monoxide, TLC = total lung capacity, 6MWT = six-minute walk test, SpO2 = peripheral saturation of oxygen, GAP = gender-age-physiology, SUV = standardized uptake value, SUVmax = maximum standardized uptake value, SUVmean = mean standardized uptake value, SUVR = standardized uptake value ratio, SUVmeanTF = tissue fraction-corrected mean standardized uptake, SUVRTF = tissue fraction-corrected standardized uptake value ratio, TBR = target-to-background ratio, TBRblood = tissue-to-blood ratio, PET/CT = Positron emission tomography-computed tomography, IQR = interquartile rage.
Correlations with clinical parameters
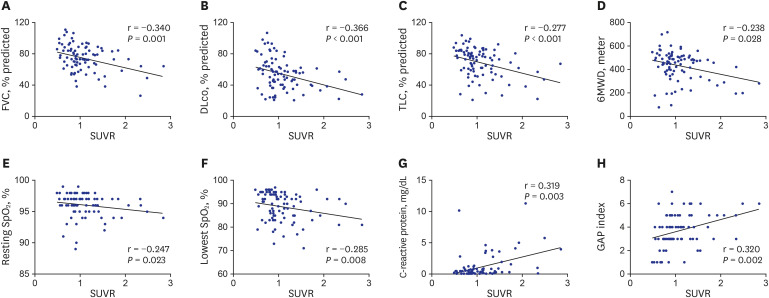
All SUV parameters were inversely correlated with FVC and DLco, and positively correlated with CRP and GAP index (Table 2). TLC was also negatively correlated with all parameters aside from SUVRTF. The SUVRTF and SUVR were also negatively correlated with the distance, and resting and the lowest SpO2 during the 6MWT. The SUVR was the only parameter that was correlated with all clinical parameters and exhibited the numerically highest correlation with the FVC (r = −0.340, P = 0.001), TLC (r = −0.277, P < 0.001), and CRP (r = 0.319, P = 0.003) (Fig. 3).
Table 2
Correlations between standardized uptake value and clinical parameters
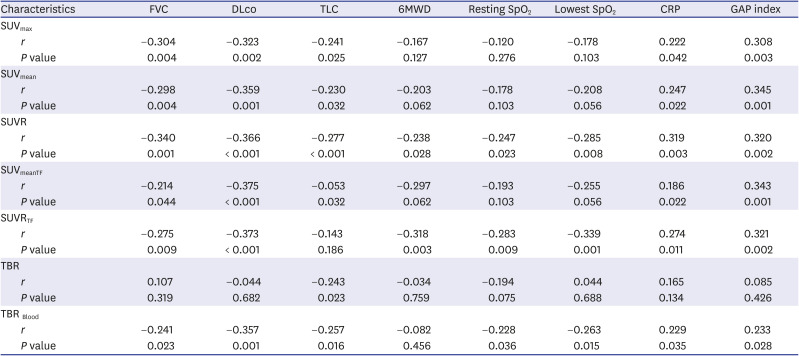
Data are presented as Spearman correlation coefficients (r).
FVC = forced vital capacity, DLco = diffusing capacity for carbon monoxide, TLC = total lung capacity, 6MWD = six-minute walk distance, SpO2 = peripheral saturation of oxygen, CRP = C-reactive protein, GAP = gender-age-physiology, SUVmax = maximum standardized uptake value, SUVmean = mean standardized uptake value, SUVR = standardized uptake value ratio, SUVmeanTF = tissue fraction-corrected mean standardized uptake, SUVRTF = tissue fraction-corrected standardized uptake value ratio, TBR = target-to-background ratio, TBRblood = tissue-to-blood ratio.
Fig. 3
Scatter plot depicting the correlation between standardized uptake value ratio and clinical parameters. (A) FVC. (B) DLco. (C) TLC. (D) 6MWD. (E) Resting SpO2. (F) Lowest SpO2. (G) C-reactive protein. H. GAP index.
FVC = forced vital capacity, DLco = diffusing capacity for carbon monoxide, TLC = total lung capacity, 6MWD = six-minute walk distance, SpO2 = peripheral saturation of oxygen, GAP = gender-age-physiology, SUVR = standardized uptake value ratio.
Correlations with changes in lung function
Changes in lung function at 6 months were evaluated in 20 IPF patients who did not undergo intervention including surgery or radiation therapy for lung nodules after enrollment. The SUVmax showed a trend of correlation with FVC changes (r = −0.409, P = 0.073) (Table 3). Changes in DLco were negatively correlated with the SUVmax (r = −0.465, P = 0.039) and SUVmean with marginal significance (r = −0.439, P = 0.053). The SUVmeanTF showed the numerically highest correlation with TLC changes (r = −0.501, P = 0.024), followed by SUVmax (r = −0.490, P = 0.028) and SUVmean (r = −0.193, P = 0.027) (Table 3).
Table 3
Correlations between standardized uptake value parameters and changes in lung function at 6 months
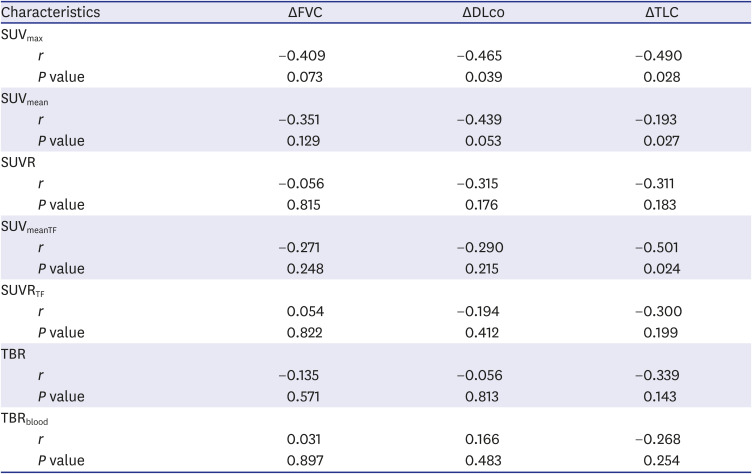
Data are presented as Spearman correlation coefficients (r).
ΔFVC = changes in the forced vital capacity, ΔDLco = changes in the diffusing capacity for carbon monoxide, ΔTLC = changes in the total lung capacity, SUVmax = maximum standardized uptake value, SUVmean = mean standardized uptake value, SUVR = standardized uptake value ratio, SUVmeanTF = tissue fraction-corrected mean standardized uptake, SUVRTF = tissue fraction-corrected standardized uptake value ratio, TBR = target-to-background ratio, TBRblood = tissue-to-blood ratio.
Prediction of survival
During follow-up, 73 patients (82.0%) died and one (1.1%) patients underwent lung transplantation. Most common cause of death was cancer progression (24.7%) and pneumonia (24.7%) followed by AE of IPF (16.4%), and IPF progression (11.0%). The median survival period did not differ between patients with and without cancer (51.0 vs. 59.0 weeks, P = 0.361). Non-survivors had lower lung function (FVC, DLco, and TLC), poorer exercise capacity (distance and the lowest SpO2 during the 6MWT), and a higher GAP stage than did survivors (Table 4). All baseline SUV parameters did not differ between survivors and non-survivors (Table 4). In the univariate Cox analysis, the SUVR (hazard ratio [HR], 1.738; 95% CI, 1.011–2.991; P = 0.046), SUVRTF (HR, 1.441; 95% CI, 1.000–2.098; P = 0.049), and TBRblood (HR, 1.377; 95% CI, 1.038–1.827; P = 0.027) were significant risk factors for mortality in IPF patients along with lung function, exercise capacity, and the GAP index (Table 5). However, in the multivariate analysis, the SUVR, SUVRTF, and TBRblood lost their significance, and FVC and DLco were independent prognostic factors for mortality (Supplementary Table 2).
Table 4
Comparison of baseline characteristics between non-survivors and survivors among patients with idiopathic pulmonary fibrosis
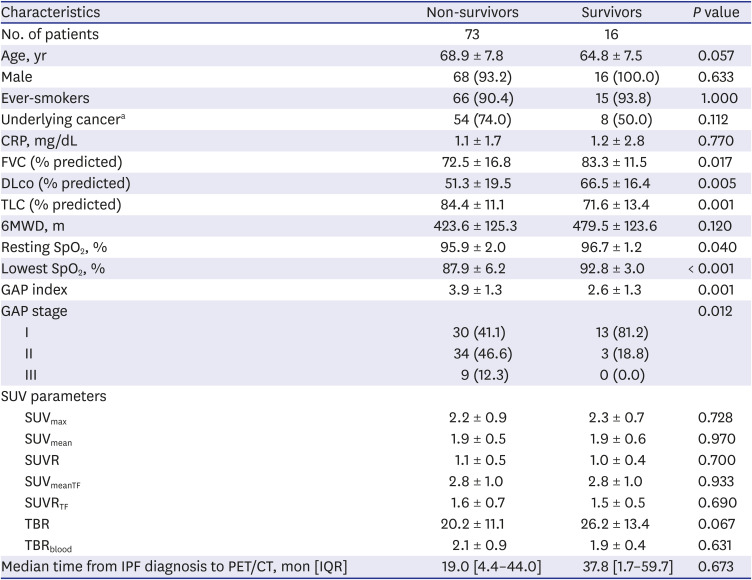
Data are presented as mean ± standard deviation or number (%), unless otherwise indicated.
CRP = C-reactive protein, FVC = forced vital capacity, DLco = diffusing capacity for carbon monoxide, TLC = total lung capacity, 6MWD = six-minute walk distance, SpO2 = peripheral saturation of oxygen, GAP = gender-age-physiology, SUVmax = maximum standardized uptake value, SUVmean = mean standardized uptake value, SUVR standardized uptake value ratio, SUVmeanTF = tissue fraction-corrected mean standardized uptake, SUVRTF = tissue fraction-corrected standardized uptake value ratio, TBR = target-to-background ratio, TBRblood = tissue-to-blood ratio, PET/CT = positron emission tomography-computed tomography, IQR = interquartile rage.
aRefers to cancers diagnosed before and after PET/CT.
Table 5
Risk factors for mortality in patients with idiopathic pulmonary fibrosis according to a univariate Cox proportional hazards model
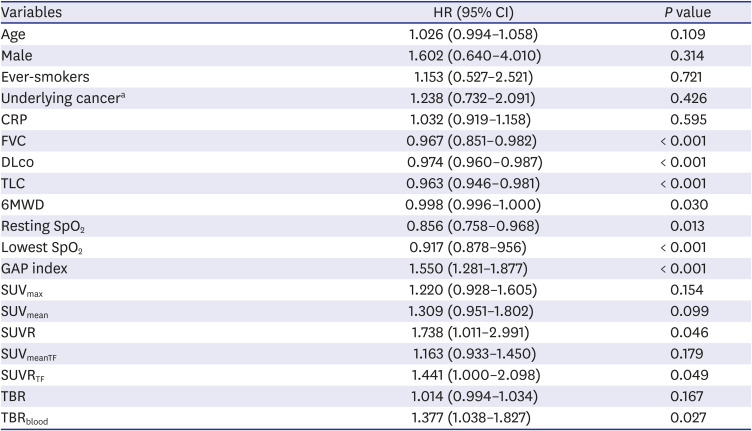
aRefers to cancers diagnosed before and after PET/CT.
HR = hazard ratio, CI = confidential interval, CRP = C-reactive protein, FVC = forced vital capacity, DLco = diffusing capacity for carbon monoxide, TLC = total lung capacity = 6MWD = six-minute walk distance, SpO2 = peripheral saturation of oxygen, GAP = gender-age-physiology, SUVmax = maximum standardized uptake value, SUVmean = mean standardized uptake value, SUVR = standardized uptake value ratio, SUVmeanTF = tissue fraction-corrected mean standardized uptake, SUVRTF = tissue fraction-corrected standardized uptake value ratio, TBR = target-to-background ratio, TBRblood = tissue-to-blood ratio.
DISCUSSION
This study demonstrated that SUV parameters were significantly correlated with lung function, exercise capacity, CRP level, and the GAP index in IPF patients. SUV parameters were also significantly associated with lung function changes and were prognostic factors for mortality in the univariate analysis, but not in the multivariate analysis.
In our study, various SUV parameters were associated with lung function and exercise capacity, which is in line with previous findings.16171819 Lee et al.16 reported that the mean mediastinal blood pool-corrected SUV was significantly correlated with FVC (r = −0.6, P = 0.024) and DLco (r = −0.7, P = 0.001) at study enrollment in eight IPF patients. Nobashi et al.17 also demonstrated that SUVTF was significantly correlated with baseline DLco (r = −0.29, P = 0.022) in 90 patients with interstitial lung disease including 24 with IPF. Castiaux et al.19 reported that SUVmeanTF was inversely associated with the lowest SpO2 during the 6MWT (r = −0.376, P = 0.049) in 31 IPF patients. In addition, a previous study on IPF patients (n = 27) found a significant difference in SUVmean between GAP stage I and II (P = 0.019) and between GAP stage II and III (P = 0.016).19 These results suggest that SUV parameters are useful for assessing disease severity in patients with IPF.
In this study, SUV parameters were also negatively correlated with lung function changes, which was supportive of previous reports.1618 Lee et al.16 reported that SUVmax was highly correlated with 6-month FVC changes (r = −0.9, P = 0.019), but not with DLco changes in IPF patients. In contrast, Justet et al.18 reported no correlation between SUV parameters and lung function (FVC and DLco) changes at 12 months in 22 IPF patients. In our study, there was significant correlation between changes in TLC at 6 months and SUVs, but no significant correlation between changes in FVC and SUVs. Although FVC is one of the most reliable surrogate markers for IPF disease severity, it could be affected by airway obstruction as well as patient's efforts.7 Nathan et al.31 also demonstrated that changes of FVC in IPF patients showed markedly intersubject and intrasubject variability. Because our study only analyzed short-term changes of lung function in small number of IPF patients (n = 20), FVC measurements might not be accurate to reflect IPF prognosis. Also, SUVmax was correlated with changes in DLco at 6 months although DLco could be affected by the multiple factors including the extent of emphysema and the presence of pulmonary hypertension.32 These findings suggest that 18F-FDG PET/CT could be useful for assessing disease progression in IPF patients.
We found that SUVR, SUVRTF and TBRblood were significant prognostic factors in an univariate analysis, which is consistent with previous reports.18 Justet et al.18 reported that SUVmean was significantly associated with 1-year progression-free survival (HR, 1.28; 95% CI, 1.06–1.55; P = 0.010) after PET/CT in 27 IPF patients in a univariate Cox analysis but was not an independent predictor in a multivariate analysis adjusted for age, FVC, and DLco. In our study, SUVs also lost their significance on multivariate analysis, whereas FVC and DLco were independent predictors for mortality. The lack of statistical significance on multivariate analysis might be attributed from the association between FVC and SUVs.
In this study, among SUV parameters, SUVR and SUVRTF, corrected for individual variation and air components, exhibited the strongest correlation with clinical parameters and prognosis. Because the SUVmean and SUVmax can be affected by several factors such as the size and shape of a region of interest and the reconstruction method, SUVR was recommended as a more suitable method for performing regional comparisons within and between subjects when calculating the target regions with respect to a reference region.33 We estimated SUVR based on the SUVmean of the liver because the liver is a highly-vascularized organ.283435 Further, because SUV could be artificially lowered by air component in lung tissues, the tissue fraction correction method was developed to enhance 18F-FDG uptake detection in fibrotic lungs by adjusting the air density of the background lung structure.29 Castiaux et al.19 also demonstrated that SUVmeanTF significantly differed between GAP stage I and III (P = 0.037) and between GAP stage II and III (P = 0.027), but SUVmean did not, in 31 IPF patients.
In our study, the underlying cancer status was not associated with mortality in patients with IPF. Lung cancer is known to be a poor prognostic factor in patients with IPF.36 However, Lee et al.37 also reported that among 579 patients with IPF, those with early lung cancer (stage 1 to IIIA NSCLC and limited-staged SCLC) did not show any differences in survival compared with those without lung cancer (P = 0.075), while those with advanced lung cancer had significantly lower survival compared with those without lung cancer or with early lung cancer (P < 0.001). Patients with lung cancer included in our study mostly showed early stage of lung cancer (NSCLC: 83.9% [non-advanced] vs. 16.1% [advanced]; SCLC: 80% [limited] vs. 20% [extensive]), and this might contribute to the lack of the effect of lung cancer on mortality in IPF.
This study has some limitations. First, this study was a single-center retrospective study and various PET/CT scanners were used. Thus, our analysis was conducted using various SUV parameters, such as the SUVR, which adjusts each individual's 18F-FDG uptake. Second, most of our patients underwent PET/CT for lung nodule evaluation, and 68.5% of total subjects were diagnosed with lung cancer. This may have affected SUV measurement in the fibrotic area and assessment of the correlations between SUVs and clinical parameters. However, we attempted to minimize these effects by excluding patients with confounders affecting SUV measurement or who underwent interventions that could have affected the results. Since our study included many IPF patients with lung cancer, our findings cannot be generalized to all patients with IPF. Third, there is no common consensus for suitable SUV parameters of lung parenchyma. Thus, we compared various corrected SUV parameters, and found that SUVR and SUVRTF were the most useful. Lastly, respiratory movement may affect measurements of SUVs, especially in the lower lobes, where fibrotic area is located primarily in IPF. There are also some subjective factors in measuring SUVs in fibrotic area, which limits the reproducibility of our findings. However, most SUV values in our study were based on SUVmax which is reproducible. Despite these limitations, we demonstrated that PET/CT could provide additional information on disease severity and prognosis in IPF patients with lung nodules.
In conclusion, PET/CT could be useful for assessing disease severity at baseline, and for predicting prognosis in IPF patients. Among the SUV parameters, SUVR was correlated with all clinical parameters and was a predictor of mortality, suggesting that it is superior to other SUV parameters.
 XML Download