

 PDF
PDF Citation
 Print
Print


INTRODUCTION
Out-of-hospital cardiac arrest (OHCA) is one of the major health issues worldwide.1 Less than one-third of OHCA victims achieve return of spontaneous circulation (ROSC), and less than ten percent remain neurologically favorable after OHCA.23
Current guidelines recommend evaluating neurological outcomes after cardiac arrest at least 72 hours after ROSC to minimize the rate of false-positive results.456 Despite the recommended guidelines, caregivers sometimes request early outcome predictions,7 which may allow the caregivers and the medical personnel enough time to share information and to discuss the care plan for cardiac arrest survivors.
Machine learning has been widely implemented in recent studies on cardiac arrest. Several studies have shown that prediction models developed with machine learning methods can predict neurological outcomes in cardiac arrest victims.8910 These studies mainly used prehospital features for establishing outcome prediction models, except several hospital features such as initial electrocardiography rhythm at emergency department (ED), percutaneous coronary intervention, targeted temperature management and extracorporeal membrane oxygenation.
In recent studies, initial laboratory results at hospital arrival after OHCA, such as arterial pH,1112 serum potassium level,1314 and serum creatinine level,1516 have been reported to be associated with neurological outcomes after cardiac arrest. Machine learning is a crucial component in the establishment of prediction models that include laboratory test results as features since a variety of laboratory tests are performed and conventional statistical techniques have difficulty handling them. Previous machine learning studies did not include laboratory results in their prediction models, which have an important association with neurological outcomes in cardiac arrest survivors.
Few studies have evaluated the prediction of neurological outcomes with machine learning methods in OHCA survivors immediately after ROSC. We performed this study to investigate the long-term neurological outcome prediction performance of several models using machine learning methods in OHCA survivors immediately after ROSC.
METHODS
Study setting and design
We performed a retrospective analysis of prospectively collected data archived in a multicenter registry of OHCA survivors. The registry consists of the data collected from adult OHCA survivors who had visited the EDs of three university hospitals in the Republic of Korea. We analyzed data from patients who had visited the EDs from March 31, 2013, to December 31, 2019. We included all adult (age ≥ 18 years) OHCA patients registered in the registry during the study period. Patients were excluded if their cerebral performance category (CPC) scales before OHCA were between three and five or their 1-year neurological outcomes were missing.
Outcome measures
The primary outcome was neurological status at one year according to the CPC scale. A favorable neurological outcome was defined as a CPC score of one or two, and an unfavorable neurological outcome was defined as a CPC score higher than two (i.e., three to five).
Statistical analysis for demographics
Continuous variables are presented as the mean ± standard deviation and were compared using Student's t-test or the Mann-Whitney test as appropriate. Categorical variables are presented as numbers (percentages) and compared using the χ2 test or Fisher's exact test as appropriate. Two-sided P values < 0.05 were statistically significant.
Dataset
After selection of study participants, we first split the whole dataset into two separate datasets: data acquired from March 31, 2013 to December 31, 2018 (dataset 1) and data from January 1, 2019 to December 31, 2019 (dataset 2). Dataset 1 was split again into a develop dataset and an internal validation dataset with an 80:20 ratio, and dataset 2 was reserved as an external validation dataset. Missing values were imputed with means for continuous data and with modes for categorical data. As missing data were not considered missing completely at random, we made new binary variables indicating the missingness of specific variables.
Machine learning models
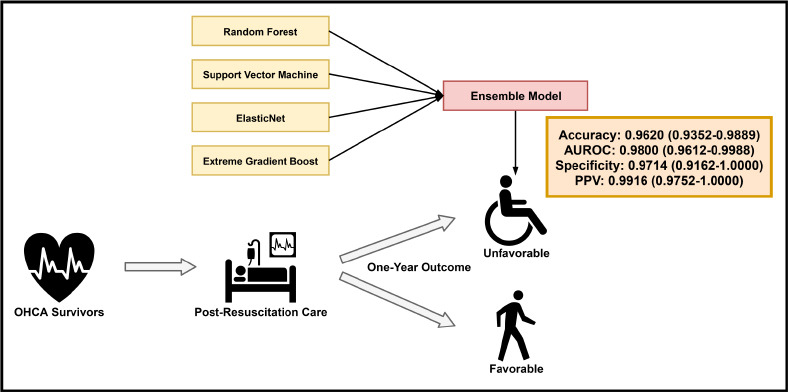
We implemented four machine learning methods for the prediction of unfavorable neurological outcomes in the develop dataset: random forest (RF), support vector machine, elastic net, and extreme gradient boost. To obtain the best hyperparameters, a grid search was performed for each classifier. After optimization of the hyperparameters, we calculated the following parameters in each model on the develop and the internal validation datasets: accuracy, areas under the receiver operating characteristics curve (AUROCs), areas under the precision-recall curve (AUPRCs), sensitivity, specificity, negative predictive values (NPVs), positive predictive values (PPVs) and F1 scores. We also calculated 95% confidence intervals (CIs) for each value if possible. Five-fold cross validation was implemented to calculate the average prediction performance of each model on the develop dataset. After model establishment, we implemented the ensemble method with soft voting with the four prediction models and tested the prediction performance of the ensemble prediction model on the internal validation dataset. The cutoff probability score of the ensemble model was selected with which the F1 score was maximized. The F1 score is one of the measures of the overall performance of a prediction model, and it is defined as a harmonic mean of sensitivity and PPV of the prediction model at a certain cutoff probability score. Finally, we tested the prediction performance of the ensemble model in the external validation dataset with the same cutoff probability score and calculated the same prediction performance parameters as in the develop and the internal validation datasets.
Variable selection
Since we aimed to establish prediction models that can be applied immediately after ROSC using machine learning techniques, we selected variables widely available at the time of ROSC. As for the laboratory variables, we used most of initial laboratory test results for model develop. However, we discarded variables 1) that are thought to have strong correlation with other included variables (e.g., total carbon dioxide level, pH, arterial oxygen saturation), 2) that are associated with organ function but represented by other included variables (e.g., aspartate aminotransferase, alanine aminotransferase, alkaline phosphatase, activated partial thromboplastin time, creatinine kinase, creatinine kinase MB isoenzyme, pro-B-natriuretic peptide), 3) that are non-classic anion or cation (e.g. ionized calcium, phosphorus), 4) that are not thought to be widely used in general EDs (e.g., red cell distribution width, neuron-specific enolase, S100 protein, central venous oxygen saturation, cortisol, adrenocorticotropic hormone, antidiuretic hormone), and 5) that are not available immediately after ROSC (data from laboratory tests performed at 24 hours and 72 hours after ROSC). We finally used 46 variables for the analysis, including baseline variables, prehospital variables, ED resuscitation variables and laboratory variables. Details of the variables used are described in Supplementary Table 1.
Subgroup analysis
We selected patients whose cardiac arrest was presumed to be of cardiac origin as a cardiac subgroup. We performed the same analysis as we performed in the main analysis with the cardiac subgroup dataset, including data splitting, implementation of the four machine learning methods and ensemble technique, selection of cutoff probability scores and calculation of prediction parameters.
Logistic regression analysis
To explain the variable importance indirectly and to compare performance metrics of the ensemble models with that of classic prediction models, we established multivariable logistic regression models for unfavorable neurological outcomes with the same variables used in the machine learning analysis. We set the cutoff probability score of 0.5 for logistic regression analyses. Same performance metrics used in the machine learning analysis, such as accuracy, AUROC, AUPRC, sensitivity, specificity, PPV, NPV, and F1 scores were calculated.
Tools for analysis
All statistical analyses for demographics, data splitting and logistic regression analysis were performed with R version 4.0.2 (R Foundation, Vienna, Austria). All codes for machine learning analyses and calculation of performance metrics were written in Python 3.7 (Python Software Foundation, Wilmington, DE, USA).
Ethics statement
Study protocols for collecting data for the registry and for the main analyses were approved by the Institutional Review Boards (IRBs) of participating hospitals (Seoul National University Hospital, IRB No. 1408-012-599; Seoul Metropolitan Government-Seoul National University Boramae Hospital, IRB No. 16-2013-157; Seoul National University Bundang Hospital, IRB No. B-1401/234-402) and the IRB of Seoul National University Hospital (IRB No. 2012-016-117), respectively. Informed consent was waivered by the IRB of Seoul National University Hospital, according to the retrospective nature of the study.
RESULTS
Patient selection and baseline demographics
During the study period, 1,214 patients were registered in the registry of which 1,061 comprised dataset 1 and 153 comprised dataset 2 (Fig. 1). A total of 1,054 of the 1,061 patients in dataset 1 met the inclusion criteria. After excluding patients meeting the prespecified exclusion criteria, 789 patients were included in the final analysis. Six hundred thirty-one patients were assigned to the develop dataset, and the rest were assigned to the internal validation dataset. Four hundred ninety-two (78.0%) patients in the develop dataset remained with unfavorable neurological outcomes at the 1-year follow-up. Thirty-nine patients from dataset 2 were excluded, and the remaining 114 patients were included in the external validation dataset. The baseline characteristics of the develop dataset are described in Table 1.
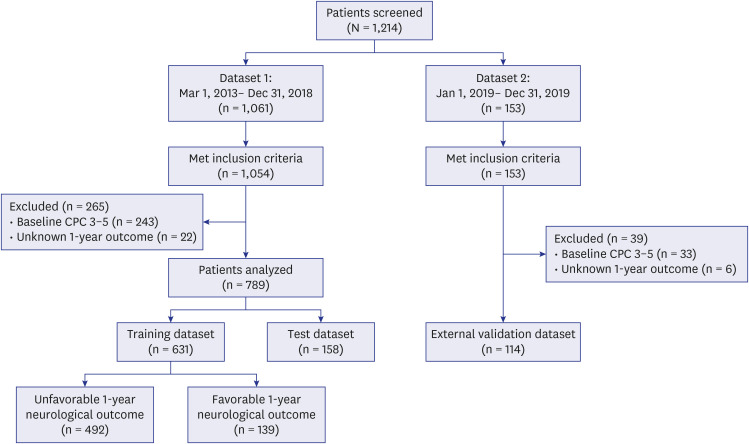
Table 1
Baseline characteristics of the original develop dataset
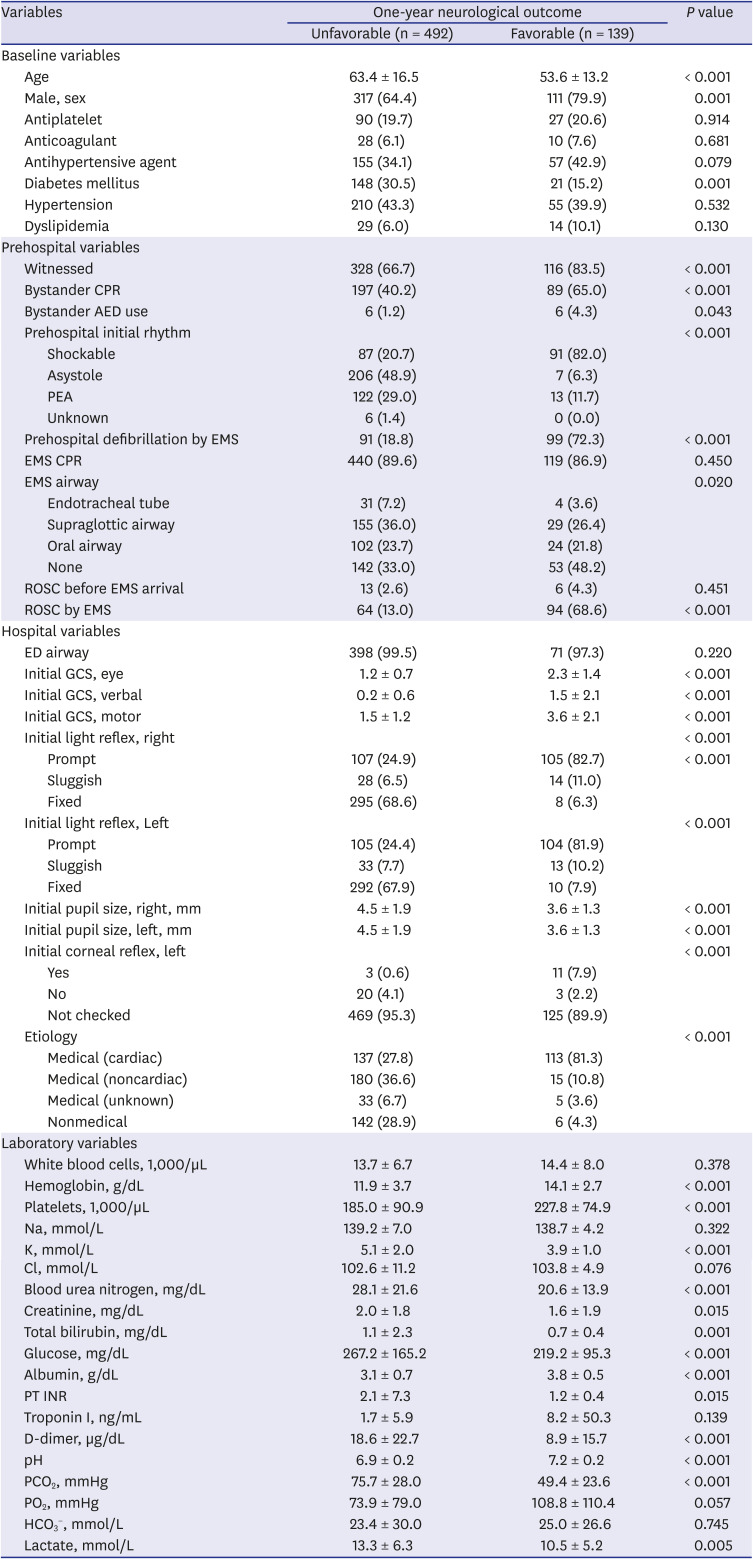
CPR = cardiopulmonary resuscitation, AED = automated external defibrillator, PEA = pulseless electrical activity, EMS = emergency medical service, ROSC = return of spontaneous circulation, ED = emergency department, GCS = glasgow coma scale, PT INR = prothrombin time international normalized ratio, PCO2 = partial pressure of carbon dioxide, PO2 = partial pressure of oxygen, HCO3
− = bicarbonate ion.
Prediction performance
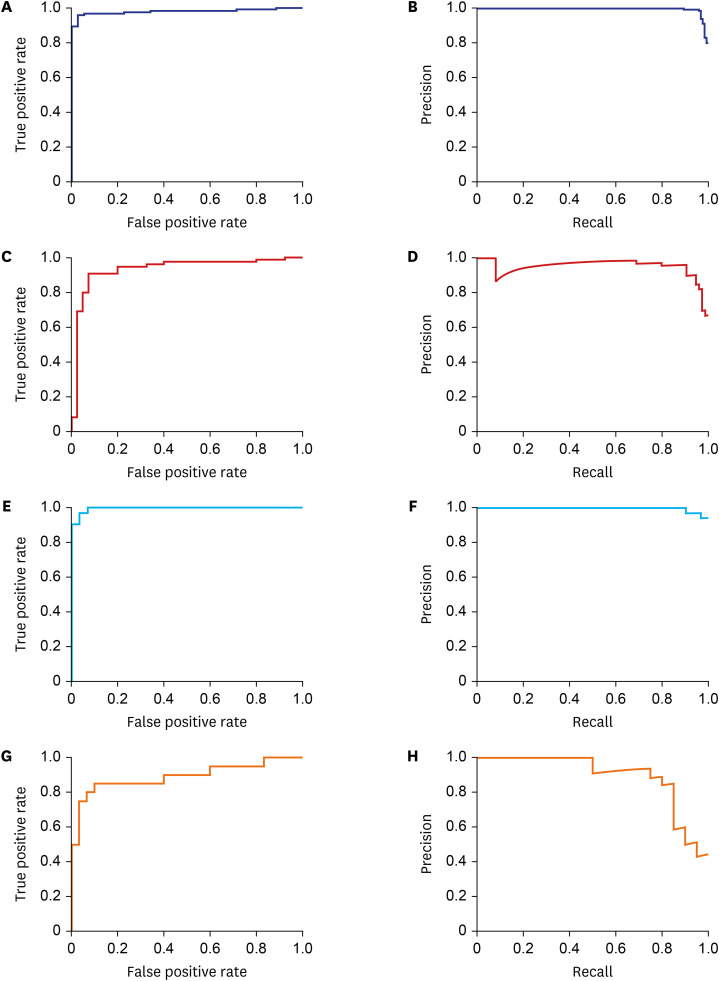
The average prediction performance of each model in the original develop dataset calculated by five-fold cross validation for each model with cutoff probability scores of 0.5 is described in Supplementary Table 2. The cutoff probability score of the ensemble model was set as 0.605, and the prediction performance of the ensemble model in the internal validation dataset is described in Table 2, Fig. 2A and B. When the ensemble model was implemented in the external validation dataset, overall prediction performance metrics such as accuracy, AUROC, AUPRC, and F1 score were all decreased by certain degrees compared with those in the internal validation dataset (Table 2, Fig. 2C and D). The average prediction performance of each model in the cardiac subgroup develop dataset calculated by five-fold cross validation for each model with cutoff probability scores of 0.5 is described in Supplementary Table 3. In the cardiac subgroup analysis, the cutoff probability score of the ensemble model was set as 0.525. Prediction performance was decreased in the cardiac subgroup internal validation dataset compared with that in the original internal validation dataset (Table 2, Fig. 2E and F), and prediction performance in the cardiac subgroup external validation dataset was also decreased (Table 2, Fig. 2G and H).
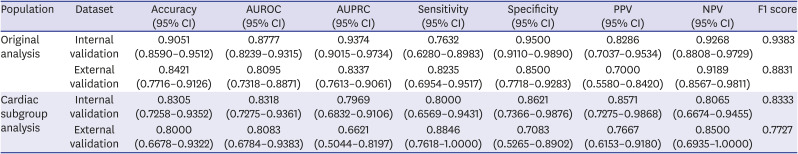
Table 2
Accuracy, AUROC, AUPRC, sensitivity, specificity, PPVs, NPVs, and F1 scores for the ensemble model in the internal validation dataset, the external validation dataset and the cardiac subgroups of the internal validation and the external validation datasets
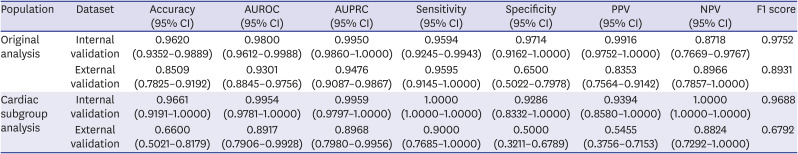
The cutoff probability scores for unfavorable neurological outcomes were set at 0.605 and 0.525 for the ensemble models in the original and the cardiac subgroup analyses, respectively.
AUROC = area under the receiver operating characteristic curve, AUPRC = area under the precision-recall curve, PPV = positive predictive value, NPV = negative predictive value, CI = confidence interval.
Fig. 2
Receiver operating characteristic curves and precision-recall curves for the ensemble prediction model in various datasets. (A) and (B) in the original internal validation dataset, (C) and (D) in the external validation dataset, (E) and (F) in the cardiac subgroup internal validation dataset, (G) and (H) in the cardiac subgroup external validation dataset.
Multivariable logistic regression models derived from the original develop dataset and the cardiac subgroup develop dataset are described in the Supplementary Tables 4 and 5, respectively. Most of the performance metrics were decreased in the logistic regression models compared with that in the ensemble models (Table 3). Only following metrics were better in the logistic regression models: NPV in the original internal validation dataset, NPV in the original external validation dataset, accuracy, specificity, PPV and F1 score in the cardiac subgroup external validation dataset. Receiver operating characteristics curves and precision-recall curves for the multivariable logistic regression models in each dataset are presented in the Supplementary Fig. 1.
Table 3
Accuracy, AUROC, AUPRC, sensitivity, specificity, PPVs, NPVs, and F1 scores for the multivariable logistic regression model in the internal validation dataset, the external validation dataset and the cardiac subgroups of the internal validation and the external validation datasets
The cutoff probability scores for unfavorable neurological outcomes were set at 0.5 for the logistic regression model.
AUROC = area under the receiver operating characteristic curve, AUPRC = area under the precision-recall curve, PPV = positive predictive value, NPV = negative predictive value, CI = confidence interval.
DISCUSSION
In the present study, we established and validated a prediction model using an ensemble technique with four machine learning methods for the prediction of unfavorable 1-year neurological outcomes in OHCA survivors. The overall prediction performance of the ensemble model in the external validation set was favorable, with an AUROC of 0.9301 (95% CI, 0.8845–0.9756) and an AUPRC of 0.9476 (95% CI, 0.9087–0.9867). The prediction performance of the ensemble model in the cardiac subgroup external validation set was also good but not comparable with that in the original external validation set, with an AUROC of 0.8917 (95% CI, 0.7906–0.9928) and an AUPRC of 0.8968 (0.7980–0.9956). Performance metrics of the ensemble models were higher than that of the multivariable logistic regression models in general.
The prediction performance of certain machine learning methods is decreased when class imbalance is present in the develop dataset.17 In the develop dataset of our cardiac subgroup, the number of patients with favorable 1-year neurological outcomes was 114 (48.3%) among 236, which means that the classes in the cardiac subgroup develop dataset were more balanced than those in the original develop dataset. In the present study, however, prediction performance in terms of the AUPRC was decreased in general in the cardiac subgroup compared with the original group. Despite relatively balanced classes in the cardiac subgroup, a smaller sample size might have carried a higher risk of model overfitting, which might have resulted in slightly decreased prediction performance.
Early neurologic prognostication after cardiac arrest is important to avoid obvious futile treatment or inappropriate withdrawal of postcardiac arrest care. Current international guidelines recommend that neurologic prognostication be performed using multiple modalities, including clinical examination findings, serum biomarkers and electrophysiological tests.456 It is also recommended that the timing of prognostication be delayed for at least 72 hours after ROSC.456
Several studies have evaluated the prediction performance of machine learning-based models for neurological outcomes after OHCA. Kwon et al.9 used national OHCA registry data to develop a deep learning-based prediction model, the prediction performance of which was better than conventional machine learning-based models. These authors' model did not include hospital variables except the ED visit to ROSC time, and the study endpoints were short-term neurological outcome and survival discharge. Seki et al.8 used the RF model to predict 1-year survival in OHCA patients with presumed cardiac etiology without predicting long-term functional outcomes. Park et al.10 also developed machine learning-based prediction models for neurological outcomes at discharge in OHCA patients; however, long-term neurological outcome was not the scope of the study.
Aside from the overall performance of the prediction models, one of the most important issues is minimizing false positive prediction for unfavorable neurological outcomes when predicting neurological outcomes of cardiac arrest survivors. False positive prediction can lead to withdrawal of intensive postcardiac arrest care from patients who otherwise may fully or nearly fully recover and return to daily life. To exclude the possibility of false positive prediction, recent guidelines recommended the use of prognostic measures with false positive rates lower than or equal to 1%, i.e., with specificity higher than 99%.45618 We set cutoff probability scores in each prediction model with which the F1 score is maximized. Although the specificity of the ensemble model in the original internal validation dataset scored 0.9714 (0.9162–1.0000) with a cutoff probability score of 0.605, which is not over 99% but is acceptable, the specificity was significantly reduced (0.6500 [95% CI, 0.5022–0.7978]) when it was implemented in the external validation dataset. Although we trained the prediction models comprising the ensemble model in a separate develop dataset, the prediction performance was different in the internal validation and external validation datasets. Both datasets were hold-out datasets, which had never been involved in model training. However, the internal validation dataset was collected in the same period in which the develop dataset was acquired, and the external validation dataset was collected thereafter. The internal validation dataset was more likely to be similar to the develop dataset than the external validation dataset, and the difference in similarity between the two datasets might have resulted in different prediction performances.
The previously reported specificity of machine learning methods for the prediction of unfavorable outcomes in cardiac arrest victims ranged from 66.7% to 95.3%.910 and the ensemble prediction models in the present study outperformed the previous models in terms of specificity in the internal validation dataset. The major difference between our study and previous studies is that we included laboratory variables to train and to establish prediction models. Initial laboratory data immediately after ROSC have a significant association with neurological outcomes in cardiac arrest survivors.111213141516 Establishing prediction models by adding widely available laboratory data might have contributed to the improvement of model performance, despite a smaller sample size than those of previous studies.
One of the strengths of our study is that we developed a neurological outcome prediction model that can be implemented immediately after ROSC in OHCA survivors. Earlier timing of prognostication than currently recommended by guidelines456 may aid medical personnel and the guardians of the OHCA victims in shared decision on implementation of intensive care or withdrawal of life-sustaining treatment. We used laboratory variables that had been initially obtained at the timing of ED arrival. Previous studies using machine learning models for neurological outcomes in OHCA patients did not include laboratory values in the prediction models,8910 which might have improved prediction performance if they had been included. We defined 1-year neurological outcomes as the primary outcome, which was not focused on previous studies.8910 As the hospital cost of caring for cardiac arrest survivors is considerable.192021 our study may have a role in reducing the socioeconomic burden associated with potentially futile treatment.
There are a couple of factors to consider before implementation of our prediction model in clinical field to aid clinical decisions. First, prognostic measures that are considered reasonable for neuroprognostication in the guidelines showed specificity higher than or equal to 99%.45618 As our prognostic model could not reach such high specificity for unfavorable neurological outcomes, performance improvement is essential before clinical implementation, especially in terms of specificity. We hope organizing dataset with a large number of medical centers may improve specificity of the prediction model, without compromising sensitivity. Second, prognostic measures that are available immediately after ROSC, such as gray-white matter ratio,22 may improve prognostic performance of the model when added. Furthermore, as guidelines recommend multimodal approach for neuroprognostication, our prediction model may help clinical decision by providing outcome probability as one of the prognostic measures, not by simply discriminating the prognosis into favorable outcomes or unfavorable outcomes.
Our study has several limitations. First, the small sample size compared with previous studies reduced the statistical power of the results.8910 Considering that the rate of survival to ED arrival in OHCA patients is approximately one-fourth,23 the number of participants in our study may be larger than it was thought needed to be. Second, although we performed an external validation with the ensemble prediction model, the external validation dataset was too small. Moreover, the prediction performance of the model in the external validation set showed a potential risk of overfitting, which may impede the generalizability of the study results. However, we performed the analyses with a multicenter registry, and the multicenter nature of the study may attenuate this weakness. Finally, we did not include several prognostic tools that are suggested in the current guidelines, such as neuron-specific enolase or quantitative pupillometry. These tests are not always routinely performed in small centers; therefore, the exclusion of those variables from the models is reasonable in view of practical use.
In conclusion, we established an ensemble prediction model for prediction of unfavorable 1-year neurological outcomes in OHCA survivors using four machine learning methods. The prediction performance of the ensemble model was higher than the multivariable logistic regression model, while its performance was slightly decreased in the external validation dataset.
 XML Download