

 PDF
PDF Citation
 Print
Print


INTRODUCTION
The coronavirus disease 2019 (COVID-19) pandemic is a worldwide public health crisis in which COVID-19 cases soared across most countries, affecting 221 countries with an estimated 75 million people infected and 1.6 million deaths in 2020.1 In Korea, the first confirmed COVID-19 case occurred on January 20, the first mortality occurred on February 19, and a total of 60,000 people were infected and 900 people died from COVID-19 in 2020.
Excess mortality during the COVID-19 pandemic was caused not only by deaths directly attributable to COVID-19 but also to deaths indirectly caused by COVID-19 that were due to disruptions in the operation of the existing healthcare system.2 Patients with acute medical illnesses are reluctant to visit emergency departments (EDs) because of concerns about COVID-19 contamination in hospitals, as well as stay-at-home orders. Patients with severe illness who visit the ED may also experience delays in proper treatment, which are due to a lack of resources resulting from the consumption of many medical resources, such as beds, intensive care units (ICUs) and medical staff, in the course of responding to the COVID-19 outbreak.234
Even in the context of the COVID-19 pandemic, appropriate patient care according to acuity level is essential in the emergency setting because most patients with acute illness will still be primarily using emergency medical services (EMS) for treatment.56 However, the COVID-19 outbreak is consuming emergency medical resources in a community and delaying proper care for emergency patients. Therefore, this disaster will worsen the clinical outcomes of patients who visit EDs, and there will be disparities in excess mortality depending on community characteristics as well as individual factors.
The socioeconomic position (SEP) is a complex component that is determined by the individual's or group's relative position within a society and is based on socially derived economic factors.7 People with lower SEPs at the individual and neighborhood levels have higher mortality rates, which have been consistently reported in patients with various diseases and in special situations such as disasters.8910111213 Recent analyses of the excess mortality from COVID-19 have also reported higher excess mortality in the general population with lower income and education levels,2414 but few attempts have been made in patients with emergency conditions.
We hypothesize that the COVID-19 outbreak will worsen the clinical outcomes of patients visiting EDs and that excess mortality rates will be greater in patient groups living in communities with lower SEPs than in those with higher SEPs, especially income levels. The objective of this study was to estimate the excess in-hospital mortality among patients who visited EDs during the COVID-19 outbreak and to assess whether the excess mortality during the COVID-19 pandemic varies across community income levels.
METHODS
Study design and setting
This is a retrospective observational study using a nationwide emergency patient database. Korea has approximately 50 million people living in 100,210 km2, and there are 17 provinces, including 6 metropolitan cities. These areas are subdivided into 229 counties for administrative purposes, including 69 counties in metropolitan cities (gu, median population density: 9,214 persons per km2), 78 counties in urban cities (si, median population density: 598 persons per km2), and 82 counties in rural areas (gun, median population density: 65 persons per km2).
The Korean EMS system is a government-based public system operated by the National Fire Agency. There are a total of 219 fire stations (EMS centers) with approximately 1,400 ambulance stations nationwide. The Ministry of Health and Welfare in Korea designed 3 levels of EDs based on the availability of human resources, facilities, instruments, and equipment. There are 402 EDs categorized into 38 level 1 EDs, 125 level 2 EDs, and 239 level 3 Eds.15 Level 1 and 2 EDs provide the highest level of emergency care services in the country.
Data sources
This study used the National Emergency Department Information System (NEDIS) database in Korea. NEDIS is an emergency information network designated by the Ministry of Health and Welfare, which has been in use since 2003 and is operated by the National Emergency Medical Center (NEMC). NEDIS includes administrative and clinical information on all patients who have visited all 402 nationwide EDs across the country.16 The NEDIS data contain patient information, including demographics (sex, age, address, and insurance), symptoms (chief complaints and onset), prehospital (EMS use and treatment), ED-hospital (vital signs and level of consciousness at presentation, triage, diagnosis codes based on the International Classification of Disease 10th Edition-based (ICD-10), disposition, hospital stay after admission, and final clinical outcomes) information. All patient-related information was automatically transferred from each hospital to a central server according to protocols. Inaccurate data were filtered by a data processing system.
Community characteristics regarding SEP, including per capita income tax and employment rate, were acquired using Korean Statistical Information Service (KOSIS) data for 2018. KOSIS was developed in 1976 by Statistics Korea under the Ministry of Strategy and Finance. The income tax is imposed on the annual gross income, which is the sum of earned income, pension income, and financial income, with a progressive tax rate. The employment status and occupation are surveyed monthly for sampled households by Statistics Korea.
Study population
The study population was defined as patients who visited all 402 EDs with medical conditions other than injuries in Korea between January 27 and May 31, 2020 (after-COVID) and the corresponding period in 2019 (before-COVID). The start date of the study period, January 27, 2020, is the day of the announcement of the national crisis warning level of “Alert” for COVID-19 in Korea, and the same period of the previous year was included to compare the effects of the COVID-19 outbreak on the study outcome. Patients who visited the ED with acute or chronic injuries and for nonmedical purposes, such as issuing a medical certificate, were excluded.
Study outcomes and variables
The study outcome was the in-hospital mortality measured for the study population when discharged from the EDs or hospitals.
The main exposure of interest was the COVID-19 outbreak in 2020. The interaction variable of interest was per capita income tax for each county. We calculated the per capita income tax in each county as the annual income tax divided by the number of residents using the 2018 KOSIS data. The study population was categorized based on the quartile group for the per capita income tax of the county in which he/she lives.
Demographic findings and outcomes were collected: patient demographics (age, sex, address, and medical insurance) and clinical information (EMS use, vital signs and mental status at presentation, initial triage, diagnosis codes based on ICD-10, and dispositions after ED visits and hospital admission). Based on the diagnosis codes at ED discharge, respiratory disease (ICD-10, J00–J99), cardiovascular disease (ICD-10, I00–I99), and neurologic disease (ICD-10, G00–G99) were defined.
For community characteristics, per capita income tax, employment rate, and the proportion of service/sales workers of the 229 counties were calculated and merged with individual-level data of the study population, which were matched to the address. All community-level factors were categorized into quartiles according to study population distributions. The employment rate was defined as the proportion of individuals with a paid job among those of working age (15 to 64 years old). The proportion of workers in service/sales jobs, one of the vulnerable occupations during the COVID-19 outbreak, was calculated as the number of service and sales workers divided by the number of individuals with paid jobs in each county.
Statistical analysis
Demographic findings and outcomes are described by the COVID-19 outbreak and the quartile of county per capita income tax. The Chi-square test was used for the categorical variables. Incidence rates of ED visits per 100,000 person-days were calculated using 2019 census data.
To estimate the effect of the COVID-19 outbreak on in-hospital mortality among patients who visited EDs, we calculated the adjusted odds ratios (ORs) and 95% confidence intervals (CIs) for the study outcomes using multilevel multivariate logistic regression analysis after adjustment for potential individual- and community-level confounders. In addition, to test the interactive effects between the COVID-19 outbreak and county per capita income tax on the study endpoints, a multilevel logistic regression model with an interaction term (year of visit × quartile of county income tax) was used.
We calculated the risk-adjusted rates and 95% CIs for in-hospital mortality by study group after adjusting year of visit, age, sex, insurance, community factors (per capita income tax, employment rate, and proportion of service/sales workers), and interaction term (year of visit × quartile of county income tax). In addition, we calculated the difference in risk-adjusted rates between before and after the COVID-19 outbreak using generalized linear mixed models to estimate the excess in-hospital mortality among patients who visited EDs during the COVID-19 outbreak. Finally, the difference-in-difference of risk-adjusted rates between before and after the COVID-19 outbreak for each quartile of county per capita income tax, compared to the highest quartile of county income tax, were calculated using a multilevel linear regression model with the interaction term to evaluate whether the effects of the COVID-19 outbreak on excess in-hospital mortality varied according to the county income level. We also calculated the difference-in-difference of risk-adjusted rates between exposure groups for each county income tax among elderly (over 60-years old) group for sensitivity analysis.
All variables included in the final model were assessed for multicollinearity, which was not detected in this analysis. Analyses were performed using SAS ver. 9.4 (SAS Institute Inc., Cary, NC, USA), with a P value ≤ 0.05 being deemed significant.
RESULTS
Demographic findings
During the study period (January 27 to May 31, 2019 and January 27 to May 31, 2020), 6,765,717 (year 2019, hereafter before-COVID) and 4,896,450 (year 2020, hereafter after-COVID) patients, respectively, visited EDs.
The demographic characteristics of ED visits are summarized in Table 1. The incidence rates of ED visits per 100,000 person-days were 105.4 for the before-COVID and 75.7 for the after-COVID groups. The in-hospital mortality rate was higher in the after-COVID group (1.9%) than in the before-COVID group (1.4%) (P < 0.01).
Table 1
Study population characteristics according to the COVID-19 outbreak
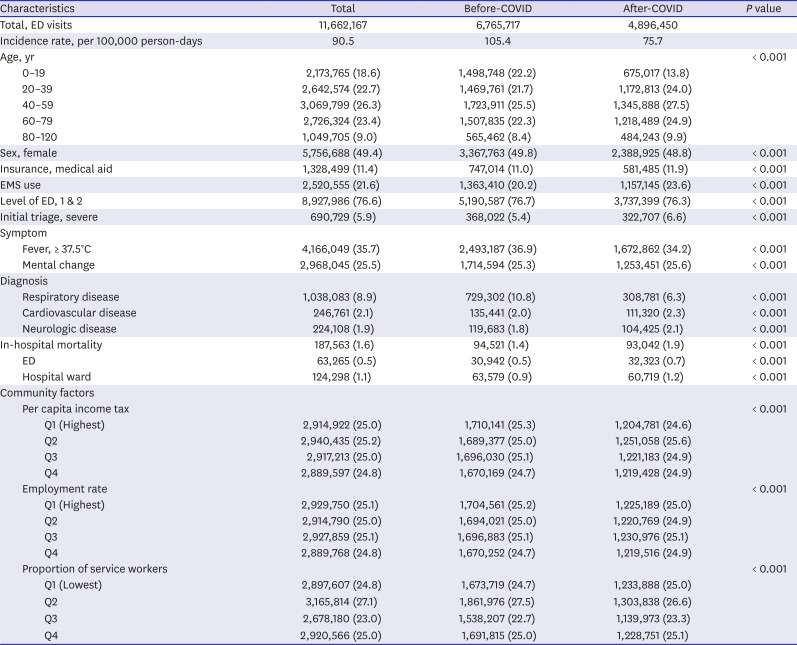
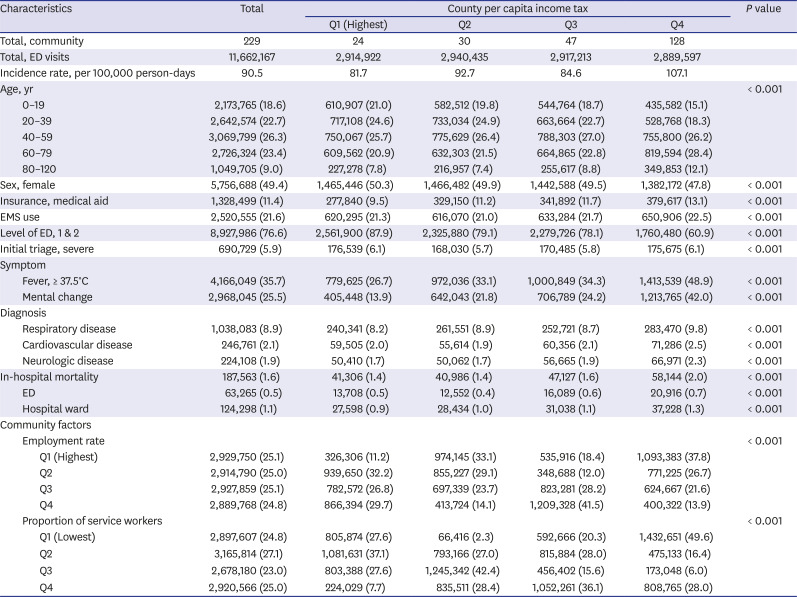
Table 2 describes the demographic characteristics according to the quartile of county per capita income tax. In-hospital mortality rates were 1.4% among patients in the Q1 and Q2 groups, which were lower than 1.9% in the Q3 group and 2.0% in the Q4 group (P < 0.01).
Table 2
Study population characteristics by county per capita income tax
COVID-19 outbreak and in-hospital mortality
Multilevel logistic regression analysis showed that the adjusted OR (95% CI) for in-hospital mortality was 1.22 (1.18–1.25) in the after-COVID compared to the before-COVID. By the county per capita income tax, the adjusted ORs (95% CIs) compared to the highest quartile group were 1.01 (0.96–1.05) in the Q2 group, 1.07 (1.02–1.12) in the Q3 group, and 1.06 (1.01–1.13) in the Q4 group (Table 3 and Supplementary Table 1).
Table 3
Multilevel multivariable logistic regression analysis on study outcomes by the COVID-19 outbreak and county per capita income tax
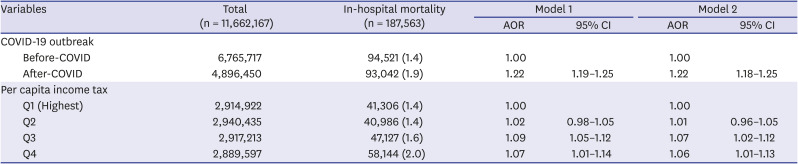
Model 1: adjusted for year of visit, age, sex, and community factor (per capita income tax); Model 2: adjusted for year of visit, age, sex, insurance, and community factors (per capita income tax, employment rate, and proportion of service/sales workers).
COVID-19 = coronavirus disease 2019, AOR = adjusted odds ratio, CI = confidence interval.
Interaction effects between COVID-19 and county income on excess in-hospital mortality
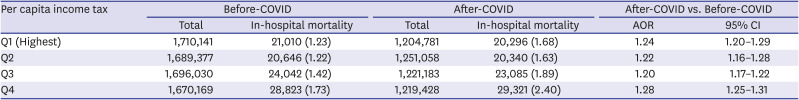
In the interaction model for assessing whether the in-hospital mortality during the COVID-19 outbreak varied according to the county income tax, the adjusted ORs (95% CIs) for study outcome in the after-COVID group compared to the before-COVID group varied according to the county per capita income tax: 1.24 (1.20–1.29) in the Q1 group, 1.22 (1.16–1.28) in the Q2 group, 1.20 (1.17–1.22) in the Q3 group, and 1.28 (1.25–1.31) in the Q4 group (P for interaction < 0.01) (Table 4).
Table 4
Interaction analysis between the COVID-19 outbreak and county per capita income tax
COVID-19 = coronavirus disease 2019, AOR = adjusted odds ratios, CI = confidence interval.
Adjusted for year of visit, age, sex, insurance, community factors (per capita income tax, employment rate, and proportion of service/sales workers), and the interaction term (year of visit × quartile of county income tax), P for interaction < 0.01.
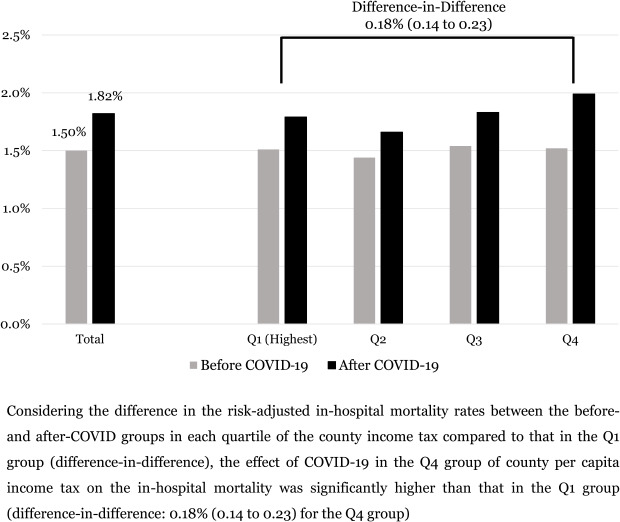
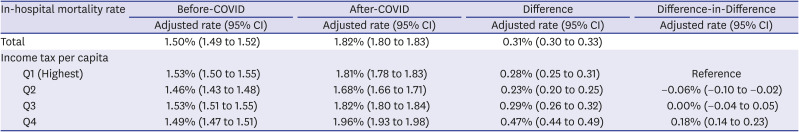
In the multilevel multivariable linear regression model to estimate the excess in-hospital mortality among patients who visited EDs during the COVID-19 outbreak, the risk-adjusted in-hospital mortality rate in the after-COVID group was higher than that in the before-COVID group (1.82% vs. 1.50%), and the difference (95% CIs) in the risk-adjusted rates was 0.31% (0.30 to 0.33).
Considering the difference in the risk-adjusted in-hospital mortality rates between the before- and after-COVID groups in each quartile of the county income tax compared to that in the Q1 group (difference-in-difference), the effect of COVID-19 in the Q4 group of county per capita income tax on the in-hospital mortality was significantly higher than that in the Q1 group (difference-in-difference: 0.18% [0.14 to 0.23] for the Q4 group) (Table 5 and Supplementary Table 2).
Table 5
Risk-adjusted in-hospital mortality rates and the differences according to the COVID-19 outbreak and the county income tax per capita
DISCUSSION
This cross-sectional study used a nationwide emergency patient database to evaluate the impact of the COVID-19 outbreak on in-hospital mortality among patients who visited EDs and whether these effects differed across community income levels. We found that there was excess in-hospital mortality among patients who visited EDs during the COVID-19 outbreak compared to those who visited EDs in the corresponding period of the previous year (the difference in risk-adjusted rates, 0.31% [0.30 to 0.33]; adjusted OR, 1.22 [1.18 to 1.25]), and there was an interaction effect between the COVID-19 outbreak and county per capita income tax on in-hospital mortality (P for interaction < 0.01). Using the difference-in-difference models, the excess in-hospital mortality rate was significantly increased for patients in the lowest quartiles of the county per capita income tax compared to those in the highest quartile group (difference-in-difference: 0.18% [0.14 to 0.23]). These results emphasize that the COVID-19 outbreak appears to have a particularly significant detrimental impact on socioeconomically vulnerable populations.
Several countries have reported that there were excess deaths during the COVID-19 outbreak compared to the mortality rates in previous years.1718 In addition to the high mortality of COVID-19 confirmed cases, it should be taken into account that a significant number of deaths among non-infected patients were indirectly associated with the COVID-19 pandemic. Reduced accessibility to healthcare services (economic incompetence, lack of access to transportation, or disruption of medical services), as well as a shortage of human and economic resources that strain the healthcare system, might lead to excess mortality during catastrophic pandemics.131920
The direct impact of the COVID-19 outbreak on the in-hospital excess mortality rate varies greatly depending on the country's COVID-19 incidence rate and fatality rate of COVID-19. In the United States, it has been reported that approximately two-thirds of excess mortality is directly attributable to COVID-19, whereas in South American studies, more than 85% of the total excess mortality is not directly attributable to COVID-19.1421 The COVID-19 incidence rate in Korea is less than 800 patients per 100,000 people, which is less than 10% of that of the United States or major European countries, and the case fatality rate is approximately 1.5%, which is also lower than that of other countries.1
To date, several studies have shown that older people, racial and ethnic minorities and people with lower SEPs have higher COVID-19-related mortality.142223 However, only a few attempts at such analysis have been made in patients with emergency conditions. We analyzed the interaction effects between SEP and the COVID-19 outbreak on excess mortality using nationwide emergency patient data covering all patients who visited all 402 EDs. Using the difference-in-difference models, we observed that there was excess mortality during the COVID-19 outbreak, as well as disparities in the excess mortality rates between community SEP, which was 0.18% higher in the lowest SEP group than in the highest SEP group. Based on these study results on the disparities in excess mortality according to community SEP, one of the weaknesses of the current response to the COVID-19 pandemic is that there are few medical services considering the characteristics of patients with low SEP.2224 To overcome the disparities caused by SEP, it is necessary to develop customized healthcare policies that consider various factors, including age, sex, and SEP.
Emergency medical care systems are among the first access points to healthcare in the low SEP population. The high quality of the EMS system improves health equity by treating all patients regardless of individual and neighborhood SEP. Preparedness for disasters such as COVID-19 pandemics and resource allocation that considers socioeconomic factors are important to reduce excess mortality and to resolve disparities in healthcare services. As the COVID-19 pandemic is currently underway, it is necessary to analyze further the impact of COVID-19 pandemic on the excess in-hospital mortality among patients who visited EDs after the end of the communicable disease pandemic. Our findings have important implications for future protection strategies in the potential risk of chronic COVID-19 outbreaks or other communicable disease pandemics.
This study has several limitations. First, this study was not a randomized controlled trial. There might have been unmeasured confounders over time other than the COVID-19 outbreak. Second, we conducted multilevel logistic regression models and generalized linear mixed models because one of the exposure variables was at the county level and the outcome variable was an individual-level variable. We tried to find an appropriate indicator that reflects the patients' SEP, the county income tax per capita may not fully reflect a patient's individual SEP. This study has ecological features and is not free from ecological fallacy. However, community factors such as medical resources in the county, which may be related to both the exposure and outcome variables, were not fully adjusted for. Third, because the study population was patients who visited all 402 EDs with medical conditions other than injuries in Korea, the patient demographic characteristics, hospital care, and clinical outcomes were different between the patients with medical illness and the injured patients. It is likely that the calculated excess mortality is underestimated.
During the COVID-19 pandemic, there was excess in-hospital mortality among patients who visited emergency departments in Korea, and there were disparities in excess mortality, depending on the community socioeconomic position. The excess mortality rates were greater in patient groups living in communities with lower income than in those living in communities with higher income. There is a need to develop carefully customized strategies, including preparedness of emergency healthcare resources for vulnerable populations, to overcome the disparities in clinical outcomes occurring in disaster situations.
 XML Download