

 PDF
PDF Citation
 Print
Print


INTRODUCTION
Kawasaki disease (KD) is an acute, systemic vasculitis that affects infants and young children, mainly children under the age of 5 years. It is characterized by prolonged fever that is unresponsive to antibiotics; polymorphous skin rash; erythema of the oral mucosa, lips, and tongue; erythema of the palms and soles; bilateral conjunctival injection; and cervical lymphadenopathy.1) The primary pathological changes associated with KD include inflammation of medium-sized muscular arteries throughout the body, particularly the coronary arteries, and possible formation of coronary artery aneurysms.2)3) High-dose intravenous immunoglobulin (IVIG) (2 g/kg over 12 hours) together with aspirin effectively abrogate the fever and systemic inflammation, and reduce the rate of aneurysm to less than 5% of cases.4) Although the pathogenesis of KD remains unknown, it is thought to be due to an abnormal immune reaction triggered by unknown infectious agents in genetically susceptible individuals.5)
Recent genome-wide association studies (GWAS) identified several genes related to B cell signaling, including BLK, CD40, FCGR2A, and BCL2L11,6)7)8)9) as susceptibility genes for KD. Farh et al.10) conducted bioinformatics analyses integrating published GWAS results and information about gene expression, expression quantitative trait loci, and epigenetic information, which suggested the importance of B cells in KD pathogenesis.11) Thus, the data imply that B cells may play an important role in the pathogenesis of KD. Immunoglobulins (Igs) play key roles in B cell development and function. In this study, we measured Ig levels (IgG, IgA, IgM, and IgE) during the clinical course of KD and examined the effects of each Ig isotype level on inflammatory laboratory data and clinical outcomes (i.e., coronary artery lesions [CALs] and non-responsiveness to IVIG).
METHODS
Subjects
Children with KD were recruited from 11 tertiary academic hospitals in Korea, all of which participated in the Korean Kawasaki Disease Genetics Consortium. All patients were diagnosed by pediatricians in accordance with the diagnostic criteria of the American Heart Association.12) A total of 241 patients were selected from the pool of our KD patients, including severe cases with coronary artery aneurysms (n=61) and cases without coronary artery aneurysms (n=180). Among these, 210 had complete KD, with fever lasting 5 days or longer, and at least 4 of the 5 principal clinical features of KD. All patients received single high-dose IVIG (2 g/kg). Two-dimensional echocardiography results were interpreted by pediatric cardiologists and coronary arteries were categorized as normal or abnormal (showing CALs, i.e., dilation or aneurysm). In addition, the coronary artery aneurysms were classified by size: small (internal diameter 3 to <5 mm), medium (5 to <8), or giant (≥8 mm). The study protocol was approved by the Institutional Review Boards (2014-0823) of the involved institutions, and the parents or guardians of all patients provided written informed consent.
Ig measurement
Plasma samples from 241 children were collected during the acute (before IVIG treatment; n=56), subacute (within 3 weeks after treatment; n=157), convalescent (between 3 weeks and 6 months after treatment; n=7), or normal (>6 months after treatment; n=21) phase of KD. The concentrations of IgG, IgA, and IgM were measured in a nephelometric immunoassay using the IgG/IgA/IgM Flex Reagent Cartridge kit (Siemens, Munich, Germany) and a Dimension Vista 500 instrument (Siemens). IgE concentrations were measured in a fluorescence enzyme immunoassay (UniCAP Total IgE kit; Phadia AB, Uppsala, Sweden) and the ImmunoCAP 1000 instrument (Phadia AB). Ig levels were classified as low (below the reference range), normal (within the reference range), or high (above the reference range) in accordance with the reference values from the Texas Children's Hospital Clinical Laboratory13) (for IgG, IgA, and IgM) and the ImmunoCAP Total IgE system14) (for IgE). The reference values are presented in Supplementary Tables 1 and 2.
Laboratory parameters
All laboratory tests (except Ig measurements) were performed before initial IVIG treatment; these included a white blood cell count, a neutrophil count, a platelet count, the erythrocyte sedimentation rate, and the concentrations of hemoglobin, C-reactive protein, aspartate aminotransferase, alanine aminotransferase, serum albumin, and total protein.
Genotyping and quality control
Genotype data used for GWAS of Ig levels were obtained from our previous study.15) Genotyping methods and quality control steps for GWAS are also described in detail in the previous study.15) Briefly, 296 children with KD were genotyped using the Illumina Human Omni1-Quad Bead Chip (Illumina, San Diego, CA, USA), according to the manufacturer's instructions. Among them, 241 patients with Ig data were included in the analysis. To filter single nucleotide polymorphism (SNP) markers, the following were excluded: 2,553 SNPs with missing call rates >2%, 413 SNP markers with a Hardy-Weinberg Equilibrium p value of <1×10⁻⁶, and 209,342 SNP markers with a minor allele frequency <0.01. After SNP filtration, 718,717 SNPs were included in the genome-wide association analysis.
Statistical analysis
Statistical analysis was performed using the SPSS Statistics, version 24 (IBM, Armonk, NY, USA). Because Ig data showed a skewed distribution, the data were log transformed. Data are expressed as mean±standard deviation, as the geometric mean (95% confidence interval), as the median (interquartile range), or as percentages as appropriate. For continuous variables, differences between 2 groups were analyzed using Student's t-test or the Mann-Whitney test. Differences among 3 or more groups were analyzed by 1-way analysis of variance (followed by Tukey's test) and the Kruskal-Wallis test. An analysis of covariance test, adjusted for age at the time of sampling, was also used to compare Ig levels among the 4 groups. For categorical variables, the χ2 test was used. To determine the effects of Ig levels on CAL, logistic regression analysis adjusted for age, sex, and plasma sampling time point was performed and Pearson correlation coefficient was calculated. A 2-tailed p value <0.05 was considered statistically significant. To analyze the association between Ig levels and SNPs, linear regression analysis adjusted for age at sampling, sex, and plasma sampling time point was performed using PLINK software, version 1.07 (http://pngu.mgh.harvard.edu/~purcell/plink/).16) The levels of each Ig isotype and amount of isotype switching (the ratio of each Ig isotype to IgM) were log transformed before analysis.
RESULTS
IgG, IgA, and IgM levels were significantly higher during the subacute phase after IVIG treatment, whereas IgE levels were constitutively elevated at all clinical phases of KD
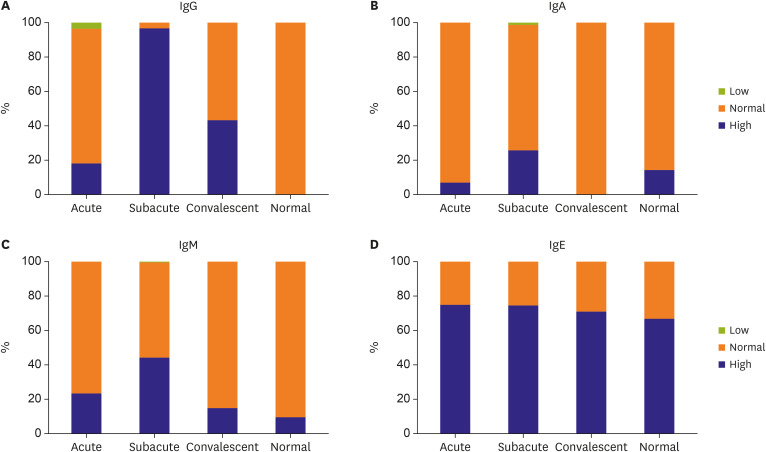
To measure the amount of each Ig isotype, we collected plasma samples from 241 patients during the acute phase (n=56), subacute phase (n=157), convalescent phase (n=7), or normal phase (n=21). Significantly higher IgA, IgG, and IgM levels were observed during the subacute phase after IVIG treatment than during the other phases. In particular, and as expected, plasma samples taken during the subacute phase (within 3 weeks after IVIG treatment) contained about 3 times more IgG than plasma samples collected before IVIG treatment (acute phase) (Table 1). By contrast, there were no significant changes in IgE levels during the 4 different clinical phases of KD. However, compared with the reference values, constitutively elevated IgE levels were observed in 73.9% (178/241) of patients during all clinical phases of KD (75.0% in the acute phase, 74.5% in the subacute phase, 71.4% in the convalescent phase, and 66.7% in the normal phase; Figure 1 and Supplementary Table 3).
Table 1
Clinical characteristics and Ig levels of patients with KD
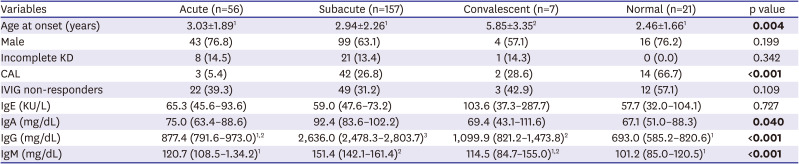
Data are shown as the mean±standard deviation, number (%), or geometric mean (95% confidence interval). The p values were calculated by analysis of variance test, the χ2 test, or analysis of covariance (adjusted for age). Significant values are shown in bold. The same group is designated by the same number.
CAL = coronary artery lesion; Ig = immunoglobulin; IVIG = intravenous immunoglobulin; KD = Kawasaki disease.
Figure 1
Distribution of Ig levels according to the sampling time point. (A) IgG, (B) IgA, (C) IgM, and (D) IgE levels were classified as low, normal, or high according to the reference values for each Ig. The percentage of each Ig during the different disease phases (acute, n=56; subacute, n=157; convalescent, n=7; normal, n=21) is presented.
Ig = immunoglobulin.
IgA and IgM levels are associated with CALs in KD, whereas high IgG and constitutively elevated IgE levels are not associated with clinical outcome
To examine the effect of each Ig isotype level in KD, we compared inflammatory laboratory parameters and clinical outcomes of KD between the normal and high groups for each Ig isotype (Supplementary Tables 4,5,6,7,8,9). Significantly more CALs were observed in the high IgA group than in the normal IgA group (44.7% vs. 20.8%, respectively; p<0.01; Supplementary Table 4). In particular, we observed 2.2-fold (p=0.038) and 1.7-fold (p <0.001) higher IgA levels in the CAL group than in the non-CAL group during the acute and subacute phases, respectively (Table 2). Less significant increases in IgM levels were observed in the CAL group during the acute phase (1.6-fold, p=0.039) and subacute phase (1.3-fold, p=0.001) than in the non-CAL group (Table 2). Since Ig levels can be affected by compounding factors such as age and sex, we performed logistic regression analysis after adjusting for age, sex, and sampling time point to determine the effects of each Ig isotype on CAL formation in KD patients. High IgA and IgM levels were significantly associated with the incidence of CALs (odds ratio [OR]=2.58, p=0.022 and OR=2.12, p=0.043, respectively) (Table 3). When the same logistic regression analysis was performed separately for the 2 subgroups (acute and subacute), a larger effect size was observed for the acute phase than for the subacute phase (IgA: OR=6.31, p=0.199 vs. OR=2.46, p=0.035, respectively; IgM: OR=25.7, p=0.073 vs. OR=1.84, p=0.113, respectively; Supplementary Table 10). This result suggests that the high IgA and IgM levels in the acute phase are a potential prognostic marker for predicting the risk of CALs. In addition, the concentrations of IgA and IgM increased in line with the size of the coronary artery aneurysms (non-CAL, 74.3 mg/dL; small, 111.3 mg/dL; medium, 159.2 mg/dL; giant, 197.6 mg/dL for IgA, p <0.001; non-CAL, 132.4 mg/dL; small, 170.9 mg/dL; medium, 171.6 mg/dL; giant, 320.9 mg/dL for IgM, p=0.001) (Table 4). Furthermore, correlation analysis revealed that IgA and IgM levels correlated significantly with CAL size (IgA: r=0.435, p<0.001; IgM: r=0.272, p<0.001; Figure 2). However, IgE and IgG levels were not associated with clinical outcomes such as CALs and non-response to IVIG (Supplementary Tables 6,7,8,9). Notably, elevated IgE during all clinical phases of KD was not associated with inflammatory laboratory data or other clinical variables, although the incidence of complete KD in the high IgE group was slightly higher than that in the normal IgE group (90.4% vs. 79.4%, respectively; p=0.040; Supplementary Table 6). This result suggests that elevated IgE levels in patients with KD do not play a crucial role in disease pathogenesis.
Table 2
Comparison of Ig levels between the CAL and non-CAL groups during the acute and subacute phases
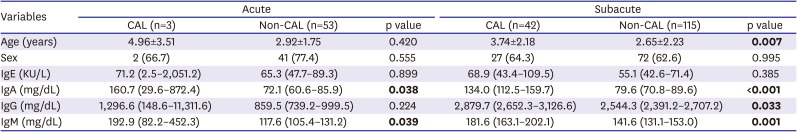
Table 3
Effect of Igs on CALs
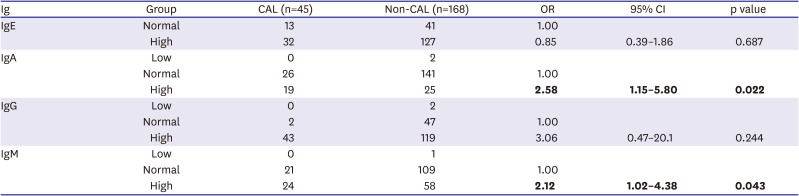
Table 4
Ig levels according to CAL size during the acute and subacute phases
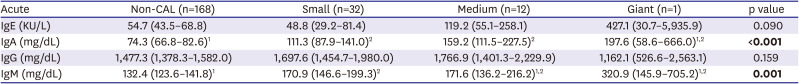
Data are shown as the geometric mean (95% confidence interval) adjusted for age. The p values were tested by ANCOVA adjusted for age, sex, and sampling time point. Significant values are shown in bold. The Bonferroni test was used to identify significant differences between groups after the ANCOVA test. The same group is designated by the same number.
Values are presented as below: small: ID 3 to <5 mm, medium: ID 5 to <8 mm, giant: ID ≥8 mm.
ANCOVA = analysis of covariance; CAL = coronary artery lesion; ID = internal diameter; Ig = immunoglobulin.
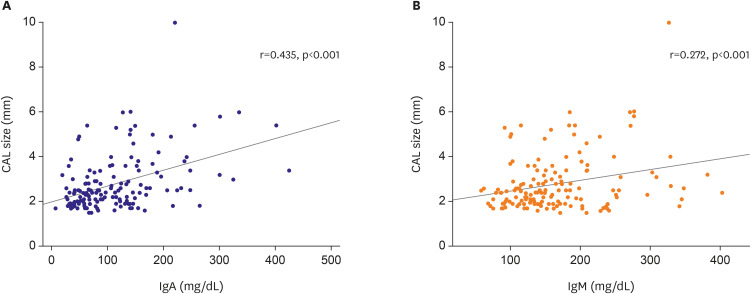
Figure 2
Correlation between CAL size and (A) IgA and (B) IgM levels during the acute and subacute phases of KD. The largest internal diameters of coronary arteries were plotted against (A) IgA and (B) IgM levels. IgA and IgM levels correlated significantly with CAL size (IgA: r=0.435, p<0.001; IgM; r=0.272, p<0.001).
CAL = coronary artery lesion; Ig = immunoglobulin; KD = Kawasaki disease.
Genetic loci affecting Ig levels in patients with KD are not associated with known KD susceptibility loci (except the ACOXL-BCL2L11 locus)
To test whether the loci determining Ig levels are associated with known KD susceptibility genes, we performed a GWAS using our previous SNP chip data derived from 241 KD patients. Several potential genes associated with Ig levels were identified (Supplementary Tables 11 and 12). However, with the exception of the ACOXL-BCL2L11 locus, none of the loci associated with Ig levels or specific Ig isotype switching were associated with loci linked to KD susceptibility. One SNP (rs875063; located in the intron of the ACOXL gene) showed a strong association with IgE levels (p=2.73×10⁻⁶) and with IgE isotype switching (IgE/IgM) (p=2.61×10⁻⁷) (Supplementary Table 11). In particular, at the IgE level in patients with KD, the T allele increased by 1.5-fold per allele (GG genotype=38.4 KU/L; GT genotype=57.9 KU/L; TT genotype=119.2 KU/L; p=2.3×10⁻⁵; Table 5). SNP rs875063 is located 65.4 kb upstream from the transcription start site of the BCL2L11 gene, which was identified as a strong KD susceptibility gene, especially in IVIG responders.9) However, the SNP associated with IgE levels (rs875063) was not linked to a previously reported SNP (rs3789065) located in the intron of the BCL2L11 gene, which is associated with KD (r2=0.013; Supplementary Figure 1). This result indicates that the locus in the ACOXL gene determining IgE levels is independent of the KD susceptibility locus in the BCL2L11 gene, although both genes are located very near to each other. In addition, well-known susceptibility genes for KD (rs6993775 in BLK, rs1801274 in FCGR2A, rs3789065 in BCL2L11, rs9378199 in HLA-B) reported by us9)15) did not show an association with IgE levels or IgE isotype switching (Supplementary Table 13). These results suggest that elevated IgE levels in patients with KD do not affect the pathogenesis of KD (at least not directly).
Table 5
Ig levels in patients with KD according to the genotype of rs875063 in ACOXL
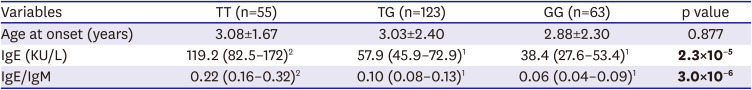
Data are shown as the mean±standard deviation or as the geometric mean (95% confidence interval). The p values were calculated using ANOVA. Significant values are shown in bold. Tukey's test was used to identify significant differences between groups after the ANOVA test. The same group is designated by the same number.
ANOVA = analysis of variance; Ig = immunoglobulin; KD = Kawasaki disease.
DISCUSSION
The data presented herein show that 74% of patients with KD had elevated IgE levels, and that the ACOXL-BCL2L11 locus is associated significantly with IgE levels and IgE isotype switching. However, elevated IgE levels in patients with KD were not associated with inflammatory data or with clinical outcomes. By contrast, high levels of IgA and IgM were significantly associated with development of CALs.
High IgE levels during the acute phase are a characteristic of KD.17)18) This study also observed elevated IgE levels during all clinical phases of KD (compared with reference IgE values). Compared with controls, children with KD have a significantly higher incidence of allergic diseases associated with high IgE levels, including asthma, atopic dermatitis, and allergic rhinitis.19)20) Wei et al.21) also reported that children with allergic diseases are at high risk of KD, with the following adjusted ORs for having KD: 1.82 for urticaria, 1.44 for allergic rhinitis, and 1.22 for atopic dermatitis. All of these data suggest that KD tends to be associated with allergic diseases, and that both KD and allergic diseases share a common B cell-mediated pathogenesis. We also found that IgE levels were not associated with inflammatory laboratory data or with clinical outcome; the exception was that the incidence of complete KD was slightly higher in high IgE group (90.4% with complete KD vs. 79.4% in the normal IgE group; p=0.040). Therefore, the results indicate that elevated IgE levels in patients with KD may not affect the severity of inflammation or the pathogenesis of KD.
In this study, we found no significant difference between IgE and IgG levels and the clinical outcome of KD. However, IgA and IgM levels in the CAL group were significantly higher than those in the non-CAL group, and correlated with the severity of CALs. In particular, high IgA was much more significantly associated with CALs than IgM. For example, a larger effect size and significance was observed for IgA than for IgM when comparing the CAL group with the non-CAL group (Tables 2 and 4). Moreover, a higher correlation was observed between CAL size and Ig levels for IgA than for IgM (r=0.435, p<0.001 for IgA; r=0.272, p<0.001; Figure 2). Furthermore, high IgA levels were significantly associated with CALs (44.7% vs. 20.8% in the normal IgA group, p<0.01; Supplementary Table 4), whereas high IgM levels were not (30.6% vs. 22.6% in the normal IgM group, p=0.332; Supplementary Table 5). All of these results indicate that high IgA levels are superior to high IgM levels as a prognostic marker for predicting CAL risk in KD. Sawaji et al.22) showed that IgG, IgM, and IgA z-scores in the CAL group (n=20) were significantly lower than those in the non-CAL group (n=68), and that a low IgG z-score was a risk factor for CALs. However, Yanagimoto et al.23) reported no difference in IgG, IgA, or IgM z-scores in patients with and without CALs (16 cases with CAL vs. 181 cases without CALs). However, these 2 studies examined a very small number of samples obtained before IVIG treatment. Ding et al.3) also reported no difference in IgA, IgG, and IgM levels between the CAL and non-CAL groups in a Chinese population. All of these results are different from our own. However, none of these previous studies are conclusive due to small sample sizes, different study populations, different measurement time points, and differences in data analysis methods. Further investigations are needed to identify true differences. Recent studies suggest that the IgA response in KD may be an important contributor to vasculitis linked to cardiovascular inflammation. Noval Rivas et al.24) revealed that vascular inflammation is associated with intestinal permeability and elevated circulating secretory IgA (sIgA) levels in patients with KD, as well as with elevated sIgA and IgA deposition in vascular tissues in a mouse model of KD vasculitis. Furthermore, a high number of infiltrating oligoclonal IgA plasma cells were detected in inflammatory tissues of patients with KD.25)26) These results suggest that IgA plays an important role in mediating vascular damage in KD.
We observed elevated levels of IgA, IgM, and IgG during the subacute phase of KD, and constitutively elevated IgE levels during the entire clinical course of KD. However, GWAS suggested that none of the loci associated with Ig levels or specific Ig isotype switching in patients with KD were associated with known loci for Ig levels or KD susceptibility; the exception was the ACOXL-BCL2L11 locus. SNPs located in the ACOXL gene were significantly associated with both IgE levels and IgE isotype switching (Supplementary Table 11). ACOXL, which encodes acyl-CoA oxidase-like protein, participates in fatty acid β-oxidation, fatty acid metabolic processes, and oxidation/reduction. Missense variant rs1554005 in the ACOXL gene is associated with IgG isotype switching.27) Recent GWAS has implicated the ACOXL gene and its neighboring BCL2L11 gene, which is located 2.4 kb downstream, in chronic lymphocytic leukemia.28) The BCL2L11 gene is also associated with KD.9) In addition, rs1448187 in the BCL2L11 locus is associated with elevated levels of IgA and IgG.27) Wood et al.29) reported that upon infection by EBV, BCL2L11 was repressed by the EBV repressors EBNA3A and EBNA3C through inactivation of multiple enhancers in the regulatory hub encompassing the ACOXL gene. Therefore, even if the ACOXL gene SNP associated with IgE levels is not linked to the BCL2L11 gene SNP associated with KD susceptibility, the ACOXL locus may function as an enhancer that controls expression of BCL2L11 in human B cells (Supplementary Figure 1).
In this study, we demonstrated that high IgA levels may be a prognostic marker for predicting CAL risk in KD; however, the study has some limitations, including lack of healthy control Ig data, no continuous measurement of Ig concentrations in the same patients during all clinical phases, no information on the effect of IVIG infusion on the change of IgA and IgM levels, and no replication studies to confirm the GWAS results for Ig levels and Ig isotype switching. Therefore, further research is needed to overcome these limitations.
In summary, we found that the elevated IgE levels during all clinical phases are characteristic of KD, and we identified the ACOXL locus as being associated with IgE and IgE isotype switching in patients with KD. However, elevated IgE levels in patients with KD are not associated with clinical outcome. By contrast, IgA levels were significantly associated with development of CALs in KD.
 XML Download