

 PDF
PDF Citation
 Print
Print


INTRODUCTION
As of March 11, 2020, the World Health Organization declared the novel coronavirus disease-2019 (COVID-19) outbreak a global pandemic, as the number of confirmed cases outside China multiplied at alarming levels, and cases increased 13-fold.1 Through this declaration, many countries that did not begin to take action were coerced to do so by executing social distancing or lockdown as methods to contain the spread of the severe acute respiratory syndrome coronavirus 2 (SARS-CoV-2).
Although social distancing is critical in reducing the transmission of COVID-19, these measures did not take into account the detrimental effects that it would have on the health of children.2 School closure was one of the measures chosen by many governments and policymakers. However, aside from the hindrance in learning, disparities in education, and stunted social and emotional skill development, the physical activity of children was reduced to levels nearing nadir to 50% as compared to the norm.34
Childhood obesity is one of the nation's greatest public health challenges, and obesity-related risk factors are more prevalent during school breaks, such as summer vacation, as children are exposed to ‘gaining weight environments’ of reduced physical activity and easily accessible high sugar and fat food sources.5 Due to social distancing measures enforced during the COVID-19 pandemic, children and adolescents are restricted to staying at home, further reducing opportunities for physical activities and exercise. In fact, the risk of weight gain as a consequence of school closure in children during the COVID-19 has been recognized as the delay in school opening continues.36
In order to improve methods to efficiently and effectively control the novel infectious disease pandemic while minimizing the harmful effects of social distancing, more objective data are needed to provide a basis for policymakers to consider when making decisions regarding the welfare of children. Therefore, the purpose of this study was to investigate the indirect effects of social distancing and school closure on the health of children during the COVID-19 pandemic by investigating changes in their anthropometric and metabolic parameters before and during the COVID-19 pandemic.
METHODS
This was a retrospective cohort study of children and adolescents who were on regular follow-up for growth and development assessment at the Growth Clinic of the Pediatric Department of The Catholic University of Korea, Seoul St. Mary's Hospital, which is a tertiary referral university hospital.
Study definitions
The date of enforcement of social distancing and school closure due to the COVID-19 pandemic was defined as March 2, 2020 in this study, as this was the original date for the 2020 school year opening following a 2-week winter break. With both social distancing and school closure effective from this date, children were forced to adjust to the restrictions caused by the COVID-19 pandemic; therefore, the 6-month period after March 2, 2020 was defined as the ‘COVID-19 period.’ The ‘pre-COVID-19 period’ was defined as the 1-year period prior to March 2, 2020, when children were performing their normal daily activities without restrictions in their physical activities. The 2017 Korean National Growth Charts for children and adolescents were used to interpret auxological measurements including the height and weight of the children included in this study.7
Study participants
Pre-school and school-aged children who did not have any underlying diseases or conditions that influenced their height and weight status were included. Children who fulfilled all of the following inclusion criteria were included: 1) age between 4 and 18 years, 2) had been regularly attending a learning institution during the pre-COVID-19 period, 3) had at least one growth assessment at the Growth Clinic during the pre-COVID-19 period, and 4) had at least one growth assessment at the Growth Clinic during the COVID-19 period. Children who fulfilled any of the following exclusion criteria were excluded: 1) diagnosed with any psychiatric disorder, such as depression, anxiety disorders, eating disorders, or addictive behaviors; 2) underlying endocrine disorders that required therapeutic intervention, including growth hormone deficiency, precocious puberty, metabolic syndrome, or diabetes mellitus; and 3) any underlying diseases that would prohibit them from regularly attending schools, such as underlying hemato-oncologic diseases, immunodeficiencies, and physical disabilities.
Anthropometric parameters
The medical records of the study participants were reviewed for the following objective parameters: birthdate, sex, date of each visit, chronological age at each visit, anthropometric and laboratory indices. For each child, the standard deviation scores (z-scores) for height, weight, and body mass index (BMI) were calculated at each visit over the pre-COVID-19 period and COVID-19 period.7 Their weight status was categorized based on the BMI z-scores as follows: obese (BMI z-score ≥ 1.645), overweight (1.036 ≤ BMI z-score < 1.645), normoweight (−1.645 ≤ BMI z-score < 1.036), and underweight (BMI z-score < −1.645).8
Laboratory parameters
The following laboratory parameters were measured at each visit in the pre-COVID-19 period and COVID-19 period: fasting blood sugar (FBS), glycated hemoglobin (HbA1c), insulin, homeostatic model assessment for insulin resistance, aspartate aminotransferase (AST), alanine aminotransferase (ALT), uric acid, total cholesterol, triglycerides, high-density lipoprotein-cholesterol (HDL-C), low-density lipoprotein-cholesterol (LDL-C), and calcidiol (25OHD). Only parameters that were available for both the pre-COVID-19 period and COVID-19 period were used in the final analyses to calculate the changes between these two periods. Vitamin D levels collected during the two periods were adjusted by seasonal variation: summer (March–August) and winter (September–February).
Statistical analyses
The χ2 test was used to compare the categorical variables. The paired sample t-test was used to compare differences in height, weight, BMI z-scores, and laboratory parameters during the pre-COVID-19 period and COVID-19 period. The linear regression model was used in the univariate analyses to identify factors associated with an increase in BMI during the COVID-19 period. Variables found to be significant in the univariate analyses were included in the final multivariate linear regression model. In participants that were normoweight during the pre-COVID-19 period, the risk being overweight or obesity in the COVID-19 period was found through binary logistic regression analyses. To adjust for seasonality in vitamin D levels between pre-COVID-19 and COVID-19 period, a multiple linear regression analysis was performed. All tests were two-sided, and a P value of < 0.05 was considered statistically significant.
RESULTS
Description of the outbreak and school closure
Korea's first COVID-19 case was confirmed on January 20, 2020, and the number of cases increased exponentially, with 210 newly confirmed cases and a total accumulated 3,736 confirmed cases by March 1, 2020.2 As the outbreak accelerated, the Korea Disease Control and Prevention Agency (KDCA) together with the Ministry of Education deemed it inevitable for the decision to delay school opening after the winter break in February 2020. The date for the 2020 school year opening, which was originally planned for March 2, 2020, was delayed indefinitely.
Eight weeks into the school closure, KDCA and the Ministry of Education decided towards a stepwise partial opening of schools under the conditions that schools maintain a 30%–60% population density during school hours. Therefore, ten weeks after school closure, within a span of three weeks, students from all 12 grades began attending school.9 Actual school attendance per grade was at an average of one time per week, and the remaining class sessions were converted to online interactive learning. This method of social distancing in schools was maintained until the end of the first semester, 22 weeks from the date of school closure. By 24 weeks after school closure, a sudden increase in the number of newly confirmed cases reached beyond 200 per day.10 As a result, the government escalated social distancing measures to a degree where elementary and middle schools only permitted online learning as the second semester began. High school students could attend school while maintaining a 30% population density during school hours.11
Baseline characteristics of the study participants
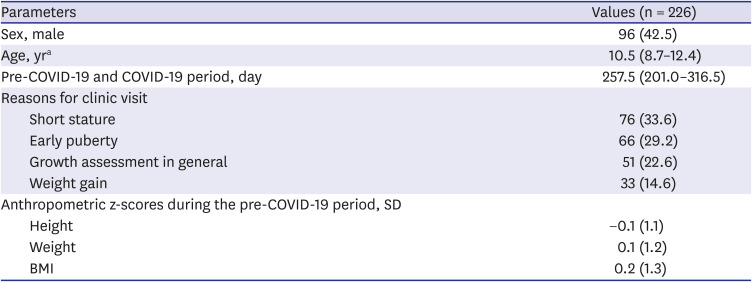
In the pre-COVID-19 period, which began from March 2, 2019 to March 1, 2020, a total of 477 children and adolescents visited the growth clinic for growth assessment. Excluding children who were diagnosed with underlying medical conditions and those who did not follow up at the clinic during the COVID-19 period, 226 children fit the study's case definition and were included in the analyses (Fig. 1). The median age at the onset of school closure in the children included in this study was 10.5 (interquartile range [IQR], 8.7–12.4) years, and 42.5% were male. There were four major reasons for clinic visit: guardians regarded child as shorter than other same-aged children, however not indicated for therapy (short stature, n = 76, 33.6%), guardians regarded child as early pubertal than other same-aged children, however not indicated for therapy (early puberty, n = 66, 29.2%), guardians regarded child as heavier than other same-aged children (weight gain, n = 33, 14.6%) and growth assessment in general (n = 51, 22.6%) (Table 1).
Fig. 1
Flow chart of the cases included in this study. A final 226 cases were included in this study.
COVID-19 = coronavirus disease 2019.
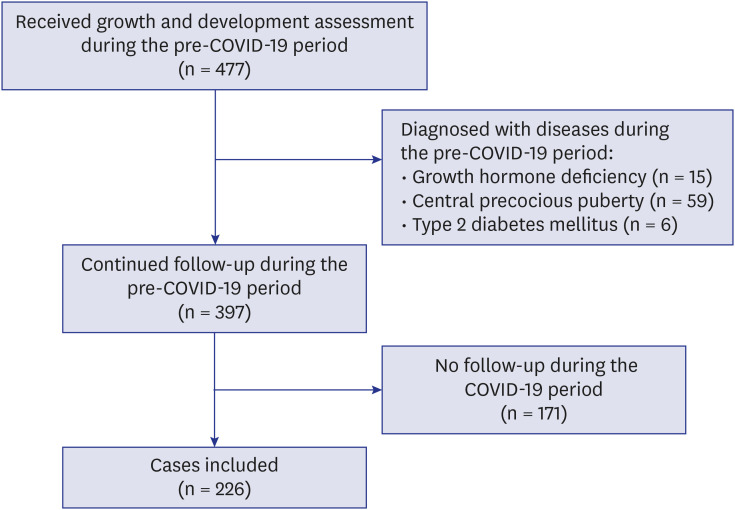
Table 1
Baseline demographics of the children included in this study
Changes in BMI
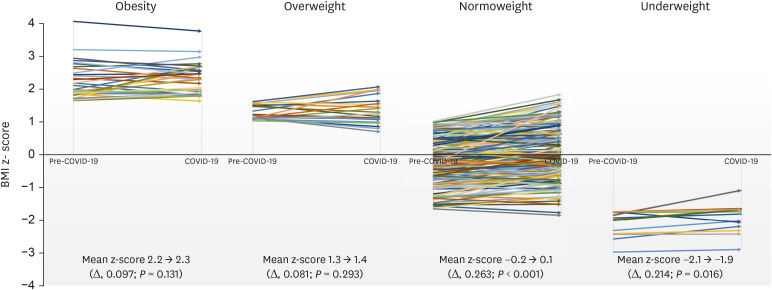
The mean BMI z-score of the cases during the COVID-19 period was 0.42 ± 1.25, which was significantly higher than that during pre-COVID-19 period (0.20 ± 1.25) (P < 0.001). On average, the mean differences of the BMI z-scores were 0.219 (95% confidence interval [CI], 0.167–0.271; P < 0.001) higher in the COVID-19 period compared to the pre-COVID-19 period. In the normoweight group, 9.5% (n = 22/158) shifted up into the overweight and obesity category, and the mean differences of the BMI z-scores of this group from the pre-COVID-19 period to COVID-19 period was 0.263 (CI, 0.199–0.328; P < 0.001) (Fig. 2).
Fig. 2
BMI z-scores of the cases in the pre-COVID-19 period and COVID-19 period. The mean BMI z-score of the patients in the COVID-19 period was significantly higher compared to the pre-COVID-19 period in the normoweight and underweight group. In the normoweight group, the mean BMI z-scores of this group increased by 0.263 (95% CI, 0.199–0.328; P < 0.001).
COVID-19 = coronavirus disease 2019, BMI = body mass index, CI = confidence interval.
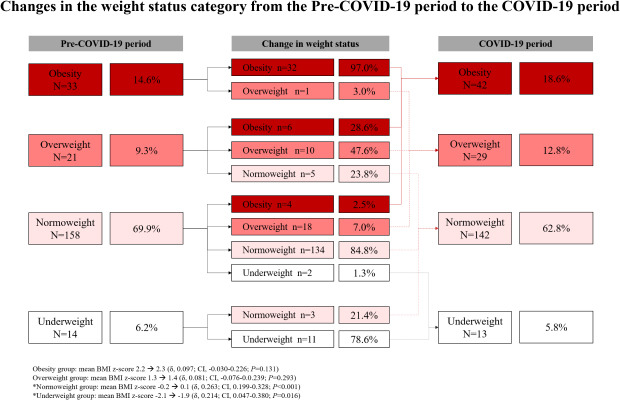
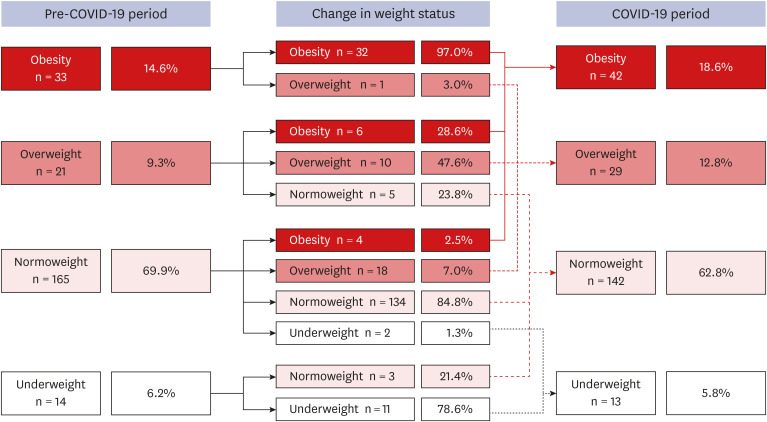
An overall shift towards a higher weight status category was observed from the pre-COVID-19 period to the COVID-19 period. In the pre-COVID-19 period, 23.9% of the children were in the overweight or obesity group; however, this proportion increased to 31.4% in the COVID-19 period (P = 0.074) (Fig. 3).
Fig. 3
Changes in the weight status category from the pre-COVID-19 period to the COVID-19 period. The proportion of overweight or obesity increased from 23.9% in the pre-COVID-19 period to 31.4% in the COVID-19 period.
COVID-19 = coronavirus disease 2019.
Univariate and multivariate analyses were carried out to adjust for major possible confounding factors associated with weight gain in the study participant during the two periods, and to identify factors associated with an increased BMI during the COVID-19 period compared to pre-COVID-19 period. The following parameters including sex, age at school closure, reasons for the initial visit to the Growth Clinic, number of days after school closure, and anthropometric profiles prior to school closure were assessed in the univariate regression model. The number of days passed after school closure (β, 0.002; 95% CI, 0.001–0.004; P = 0.002), and normoweight status (β, 0.147; 95% CI, 0.036–0.258, P = 0.010) were factors significantly associated with increased BMI in the COVID-19 period (Table 2).
Table 2
Univariate and multivariate regression analyses of factors associated with an increased BMI z-scores during the COVID-19 period
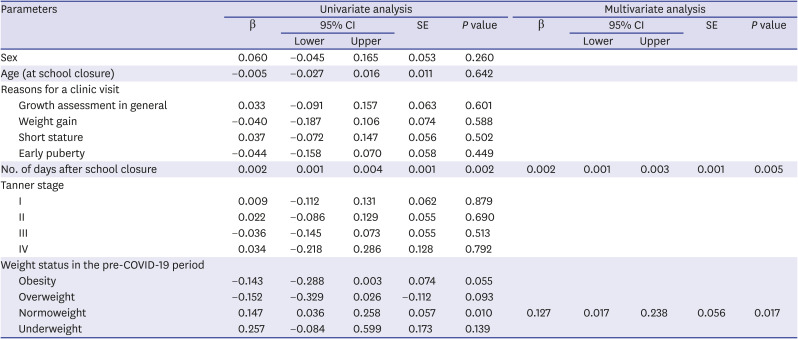
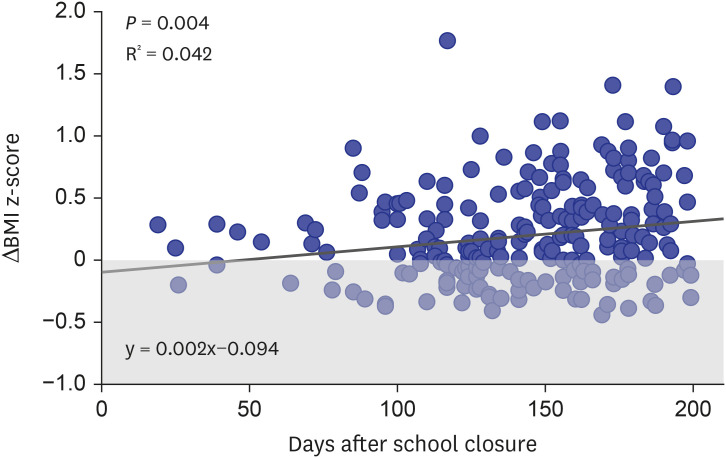
In the final multivariate analyses, the linear regression model showed that 47 days into the COVID-19 period (y = 0.002x−0.094), as each day passed, a 0.002 increase in BMI z-score was observed (β, 0.002; 95% CI, 0.001–0.003; P = 0.005) (Fig. 4). Furthermore, those that were in the normoweight status category prior to school closure showed an increase in BMI z-score of 0.127 (95% CI, 0.017–0.238; P = 0.017) in the COVID-19 period (Table 2). A logistic regression analysis showed that participants that were normoweight during the pre-COVID-19 period had a 9.9 (95% CI, 5.098–19.276; P < 0.001) times higher risk of becoming overweight or obesity in the COVID-19 period compared to those in any other weight status categories.
Fig. 4
Linear regression model showing the difference in BMI z-score during the pre-COVID -19 period and COVID-19 period. After 47 days of school closure, a positive increase in BMI z-scores of the cases is observed. Each circle represents the difference in BMI z-score (COVID-19 period BMI z-score – pre-COVID-19 period BMI z-score) in each case included. Circles located in the grey area of the graph show weight loss in the COVID-19 period compared to the pre-COVID-19 period, whereas circles in the white area show weight gain.
BMI = body mass index, COVID-19 = coronavirus disease 2019.
Changes in the laboratory parameters
Of the patients with metabolic, lipid, and 25OHD parameters evaluated during the pre-COVID 19-period as well as COVID-19 period, the two values were compared by paired t-test. Average levels of uric acid (5.3 mg/dL vs. 5.0 mg/dL, P < 0.001), triglyceride (105.8 mg/dL vs. 88.6 mg/dL, P < 0.001), and LDL-C (100.2 mg/dL vs. 94.0 mg/dL, P = 0.002) were significantly higher during the COVID-19 period compared to pre-COVID-19 period, respectively. A trend towards an increased total cholesterol was seen during the COVID-19 period compared to pre-COVID-19 period (171.0 mg/dL vs. 167.8 mg/dL, P = 0.058). A significantly decreased AST (24.1 mg/dL vs. 25.7 mg/dL, P = 0.007) and 25OHD (18.9 mg/dL vs. 23.8 mg/dL, P < 0.001) were observed during the COVID-19 period compared to pre-COVID-19 period, respectively (Table 3). After adjusting for seasonality, a linear regression analyses showed a significant linear decrease of 25OHD during the COVID-19 period compared to the pre-COVID-19 period (β, −6.404; 95% CI, −9.104 to −3.704; P < 0.001).
Table 3
Comparison of the laboratory findings of children during the pre-COVID-19 period and COVID-19 period
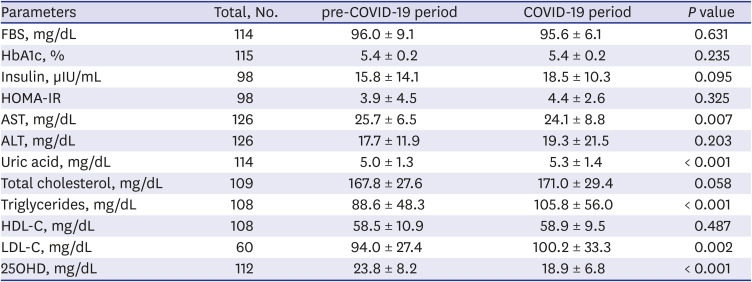
Values are presented as mean ± standard deviation.
COVID-19 = coronavirus disease 2019, 25OHD = calcidiol, ALT = alanine aminotransferase, AST = aspartate aminotransferase, FBS = fasting blood sugar, HbA1c = glycated hemoglobin, HOMA-IR = homeostatic model assessment for insulin resistance, HDL-C = high-density lipoprotein-cholesterol, LDL-C = low-density lipoprotein-cholesterol.
DISCUSSION
Globally, the number of confirmed COVID-19 cases continues to rise as safe and effective therapeutic drugs and vaccines are yet to be developed. With the unprecedented COVID-19 pandemic situation, there is a lack of data on the detrimental effects of social distancing and school closure on the health of children and adolescents. Therefore, this study was conducted to shed light on the harmful effects of school closure on the health of children, particularly on their weight and metabolic status, during the COVID-19 pandemic. We investigated the changes in BMI and metabolic parameters of 226 children without any underlying disease who were restricted to staying at home due to social distancing and school closure.
School closure results in the stoppage of school-based physical activities. Furthermore, the COVID-19 pandemic social distancing measures have urged society to avoid get-togethers and going to places where many people gather. These two combined measures have placed children and adolescents in a situation where the majority do not meet the daily recommended physical activity level.12 A microsimulation model simulated that a nationwide school closure starting from April to October 2020 would cause an increase in the BMI z-scores by 0.141 (95% CI, 0.140–0.142) and 0.198 (95% CI, 0.197–0.199) if school closure is extended up to December 2020.3 In our study, the mean BMI z-score of the children in the COVID-19 period (from March to August 2020), a 6-month period immediately following school closure in Korea, was higher than the simulated scores and was increased by 0.219 (95% CI, 0.167–0.271).
Studies have shown that compared to other months during the school year, weight gain during the summer months is significantly higher, and contributed to increased prevalence of overweight and obesity in children.1314 This study revealed that the proportion of children who were either overweight or obese increased from 23.9% to 31.4%. Also, children that were in the normoweight category experienced significant increase in BMI z-scores, and almost 10% of normoweight children moved up into the overweight or obese category. Furthermore, through multivariate analysis, this study found that being normoweight was a significant risk factor for increased BMI during school closure, meaning that normal weighted children are more likely to increase in weight possibly due to less alertness compared to overweight and obese children about gaining weight. This has profound implications because childhood overweight and obesity not only have short-term consequences on the physical and mental health of children but also long-term risks of metabolic diseases, such as diabetes, coronary heart disease, hypertension, stroke, and cancer.15 During the unprecedented and catastrophic period such as COVID-19 outbreak, any healthy children are prone to the risk of metabolic disorders, therefore, maintained by balanced nutrition and physical exercise, children should more be focused on staying healthy rather than staying normoweight.
As most of the classes were switched to online interactive learning during school closure in Korea, children and adolescents spent most of their time indoors and were not adequately exposed to sunlight. They also have more freedom in consuming high-sugar and high-fat diets during school closure.15 Furthermore, children from low-socioeconomic families do not have access to an affordable healthy diet with balanced caloric intake during school closure, which is normally provided during the school year in many countries, including Korea.1617 Consequently, elevated triglyceride and LDL-C levels and insufficient calcidiol levels were observed during the COVID-19 period. Dyslipidemia is a strong risk factor for atherosclerotic conditions, while vitamin D plays a critical role in bone maturation and mineralization and can cause metabolic syndrome when it is deficient.1819 Therefore, during the COVID-19 pandemic, the importance of indoor physical exercise and vitamin D consumption needs to be highlighted for the future prevention of cardiovascular disease and optimal bone mass acquisition throughout the pediatric age.2021
The duration of school closure was found to be a significant risk factor for increased BMI. This study found that beyond 6 weeks of school closure, the reduction in physical activity can significantly affect the BMI of children and adolescents, and the relationship between increased BMI and duration of school closure was found to be linear. Therefore, reopening schools at the earliest should be a priority for policymakers. Should circumstances following the COVID-19 pandemic regard it inevitable to keep schools closed, interventions should be made to increase opportunities for physical activity.
There are a few limitations to this study due to the retrospective design. First, to reduce selection bias, all children with underlying diseases were excluded. However, since the present study was conducted at a tertiary referral institution, the children included were more likely to have parents who were especially more interested in their child's growth status. Therefore, the changes in BMI during school closure might have been underestimated compared to the estimate in the general population. Second, because the situation of each case was not considered as a factor for the increase in BMI during school closure, caution needs to be taken when applying the study results to the general population. Finally, the present study included only a small number of children since many hospital visitors put off appointments due to either self-quarantining or fear of getting exposed to hospital-acquired COVID-19 infection. Nevertheless, the most important strength of this study is that the same cohort of children was followed up from the pre-COVID-19 period to the COVID-19 period, and all their anthropometric profiles were prospectively collected and recorded in the Growth clinic.
To conclude, within 6 months of social distancing and school closure, there have already been detrimental effects on children's health. Increased childhood overweight and obesity after social distancing and school closure due to the COVID-19 pandemic is a serious concern. The duration of school closure has a significant positive linear relationship with an increase in BMI and being normoweight does not exclude the risks for gaining weight. Policymakers need to pay attention to the changes in childhood obesity and vitamin D status of children following social distancing and school closure during the COVID-19 pandemic to prevent future metabolic complications.
 XML Download