

 PDF
PDF Citation
 Print
Print


INTRODUCTION
The continuing increase in obesity is a major concern, and has reached epidemic rates in many countries. The increased white adipose tissue (WAT) in obese individuals produces higher levels of endocrine peptides such as leptin, insulin, and adiponectin, which are typical characteristic markers for obesity. Extensive research efforts are seeking to identify factors that directly affect obesity, which could facilitate earlier and more accurate prediction of obesity and provide therapeutic targets for remediation of obesity [1].
MicroRNAs (miRNAs) are small noncoding RNA molecules that regulate target gene expression by repressing translational processes and RNA degradation [2]. miRNA expression is closely associated with cellular processes such as cell growth, proliferation, and apoptosis. Many studies have investigated the roles of miRNAs in cancer, inflammation, and immunity [345]. Recent studies demonstrated that miRNA profiles can be determined from blood [678], including circulating miRNAs and those associated with cancer or damaged tissues [910]. Circulating miRNAs are useful biomarkers for human diseases because they are present in a remarkably stable form in human blood, and the results may have a high degree of reproducibility within individuals [181112].
Several miRNAs display characteristic dysregulation in the fat tissues and blood of obese individuals [131415]. Oger et al. [15] analyzed WAT of obese individuals, and demonstrated that miR-200a and miR-200b were down-regulated, whereas miR-342-3p, miR-335-5p, and miR-335-3p were up-regulated. Young obese adults had increased levels of circulating miR-122, which were positively associated with obesity and insulin resistance [16]. Kilic et al. [17] reported that miR-143 and miR-223 expression was significantly lower in the blood of obese individuals. Heneghan et al. [18] analyzed miRNA expression profiles in omental fat tissue and blood of obese individuals, and found that miR-17-5p and miR-132 expression was significantly down-regulated in both. These studies suggest that circulating miRNA expression patterns reflect the expression patterns in omental fat tissue, and function as predictors of obesity. Although researches are trying to reveal the associations between miRNAs and obesity, the significance of circulating miRNAs for obesity is still poorly understood. Different studies have reported different miRNA expression profiles with respect to obesity, and these results are debated in the literature (reviewed in [19]). Many studies focus on model systems, so there is a lack of information on human subjects. Obesity is a complex condition, and intrinsic differences between fat tissues or individuals, such as adipocyte phenotype and obesity-related parameters, could generate differences in miRNA expression profiles [20]. Gender-specific differences in miRNA expression profiles also may lead to differences reported in the literature [21]. Asian populations (including Koreans) have characteristically lower body mass index (BMI) and a higher percentage of body fat at a given BMI compared with western populations [22]. These factors should be considered for a full understanding of obesity-related miRNAs.
This study characterized the circulating miRNA expression profiles in young obese women in Korea and determined their relationship with metabolic biomarkers. These miRNAs can contribute to a better understanding of obesity, and may lead to improved insights and therapeutic targets for controlling obesity.
SUBJECTS AND METHODS
Subject recruitment and data collection
This study was approved by the Ethics Committee of Daegu Catholic University Medical Center (CR-12-131-RES-001-R), and was in accordance with the principles of the Helsinki Declaration of the World Medical Association. Subjects with a medical history of diabetes, hypertension, or cardiovascular disease, and those who were pregnant, were excluded from the study. Finally, we enrolled 24 healthy female volunteers aged 20–23 years old; of these, 9 subjects were lean and 15 were obese. BMI was calculated as follows: weight (kg)/height in square meters (m2). Subjects with BMI < 25 were classified as lean, subjects with BMI > 25 were classified as obese. Bioimpedance analysis of body fat was performed with tetrapolar bioimpedance equipment (Inboby-720; Biospace, Seoul, Korea). Blood samples were collected at least 12 h after the last meal, and serum was isolated by centrifuging at 1,600 × g for 10 min at 4°C. The levels of triglyceride, total cholesterol, high-density lipoprotein (HDL) cholesterol, and low-density lipoprotein (LDL) cholesterol were measured with an autoanalyzer (KONELAB20; Thermo Scientific, Vantaa, Finland). Insulin and leptin levels were analyzed by enzyme-linked immunosorbent assay.
Extraction and preamplification of circulating miRNAs
Blood samples were collected into Paxgene Blood RNA tubes (PreAnalytiX/Qiagen, Hombrechtikon, Switzerland), and total RNA was extracted with Paxgene Blood RNA kit (PreAnalytiX/Qiagen) according to the manufacturer's protocols. Extracted total RNAs were reverse transcribed into cDNA using MegaPlex reverse transcription (RT) primer pools for miRNA expression. Multiplex RT products were preamplified using TaqMan PreAmp Master Mix and MegaPlex PreAmp primers (human pool sets A and B; Applied Biosystems, Foster City, CA, USA).
Analysis of circulating miRNA profiles and TaqMan low density arrays (TLDAs)
TLDAs (card A v2.0 and card B v3.0; Applied Biosystems) enable simultaneous quantification of 754 human miRNAs. We used the 2 TLDA cards to determine human circulating miRNA profiles in the 24 subjects (9 lean and 15 obese) in our study. TLDAs were conducted using the ViiA 7 Real-Time PCR System (Applied Biosystems). U6 snRNA was used for normalization. Quantitative miRNA expression data were acquired and analyzed using ABI 7900HT SDS software (Applied Biosystems), with a minimum threshold above the baseline for all assays showing measurable amplification above background.
Analysis of miRNA target genes and gene ontology (GO)
Gene targets for differently expressed miRNAs were predicted using miRWalk (http://zmf.umm.uni-heidelberg.de/apps/zmf/mirwalk2/), which is an established miRNA target gene prediction program. The predicted target genes of individual miRNAs were uploaded to the database for annotation, visualization and integrated discovery (DAVID; https://david.ncifcrf.gov/home.jsp). Analyses of GO annotations were performed using the DAVID bioinformatics resources 6.7 functional annotation tool (https://david.ncifcrf.gov/summary.jsp). DAVID functional annotation software can identify the most relevant biological terms associated with a given gene list [23] by grouping genes based on their associated GO annotation with significantly enriched GO terms (P ≤ 0.05).
Statistical analysis
The significance of the TLDA results was computed to analyze the miRNA profiling data. Student's t-test was used for comparisons between groups. Correlations between miRNA expression and metabolic variables were analyzed using Spearman's correlation analysis and linear regression analysis. Values with P < 0.05 were considered statistically significant. All statistical analyses were performed with GraphPad software (GraphPad, San Diego, CA, USA).
RESULTS
Phenotypic characterization of study subjects
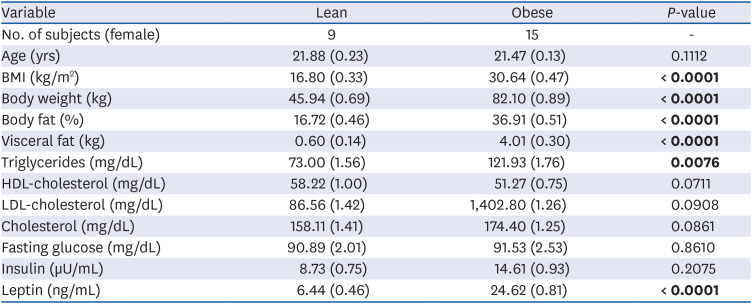
The clinical characteristics of the subjects included in this study are shown in Table 1. Lean and obese females aged 20–23 years old showed statistically significant differences in essentially all metabolic parameters except for fasting glucose, insulin, and cholesterols (HDL and LDL). The mean BMI of obese subjects was 30.64 kg/m2 (range, 27.2–38.1 kg/m2), which was significantly higher than that of lean subjects (range, 16.2–18.8 kg/m2, P < 0.0001). The percentages of body fat and visceral fat in obese subjects were significantly higher than those of lean subjects (body fat, lean vs. obese, 16.72% vs. 36.91%; visceral fat, lean vs. obese, 0.60% vs. 4.01%). Obese subjects also displayed significantly elevated leptin levels (P < 0.0001).
Table 1
Anthropometric and metabolic characteristics of the study population
TLDA analysis of circulating miRNA profiles
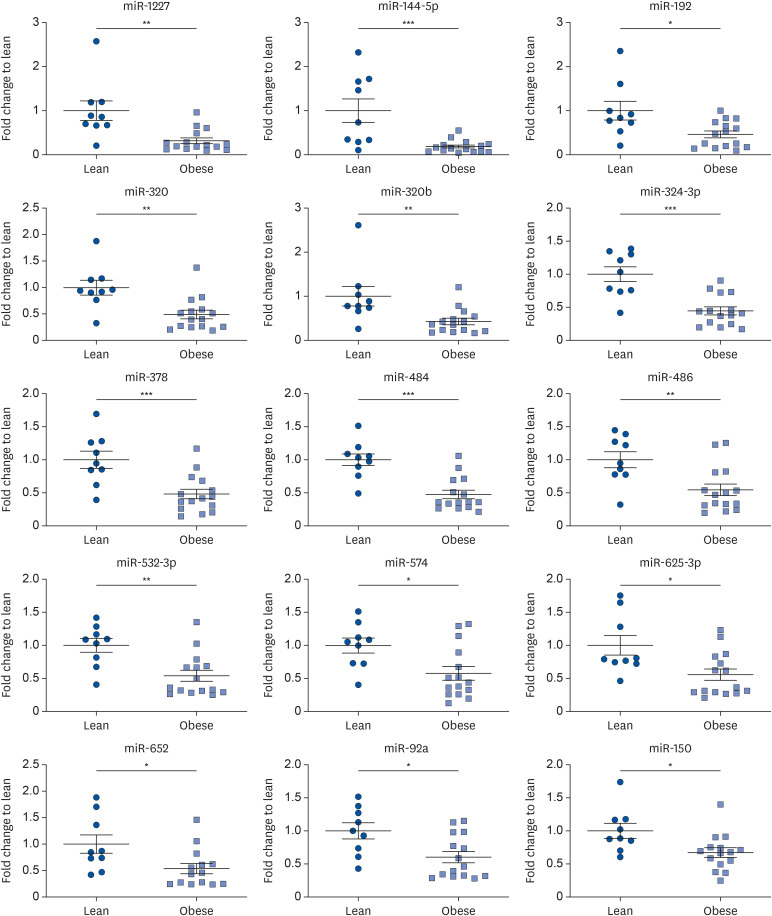
TLDA analysis was performed to identify circulating miRNAs with altered profiles in obese subjects compared with those of lean subjects. To identify obesity-specific candidate miRNAs, we had to identify the differential miRNA expression profiles between 2 groups for the following 2 criteria: 1) Ct values < 30 to enable reliable detection, and 2) miRNA levels had to show > 1.5-fold differences between obese and lean groups. A total of 90 human circulating miRNAs in the array had Ct values < 30. Hierarchical clustering showed that essentially all detected miRNAs were down-regulated in the blood of obese subjects compared with those in lean subjects (Fig. 1). We selected 15 miRNAs that displayed > 1.5-fold differences between the blood of obese and lean subjects (Fig. 2). Among them, there were > 5.5-fold and > 3-fold decreases in the expression levels of miR-144-5p and miR-1227, respectively, in the blood of obese subjects compared with those in lean subjects (P < 0.01).
Fig. 1
Heatmap of the expressions of miRNAs in obese subjects. The miRNAs are clustered based on the relative expression patterns to lean subjects, with green representing a relatively decreased and red as a relatively increased expression [123].
miRNA, microRNA.
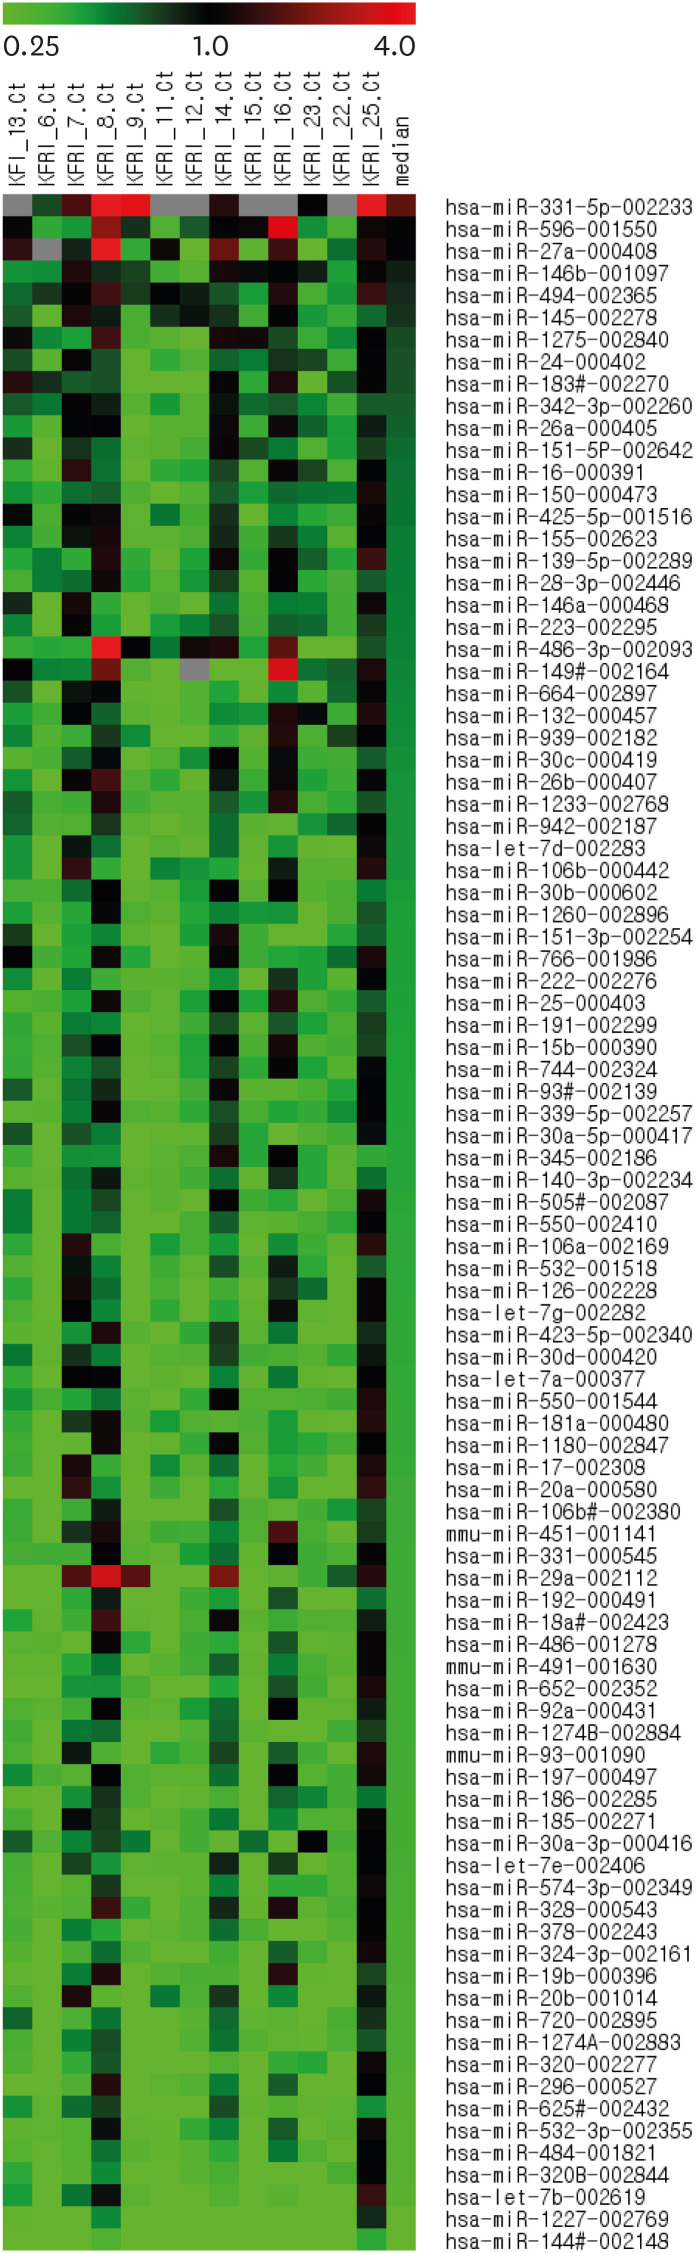
Fig. 2
Expression of circulating miRNAs in lean and obese subjects. Data are expressed as means ± SEM. The expression levels of miRNAs were normalized to U6 snRNA.
miRNA, microRNA; SEM, standard error of mean; snRNA, small nuclear RNA.
*P < 0.05, **P < 0.01 and ***P < 0.0001 for the difference between lean and obese subjects.
Correlations between circulating miRNA profiles and metabolic parameters
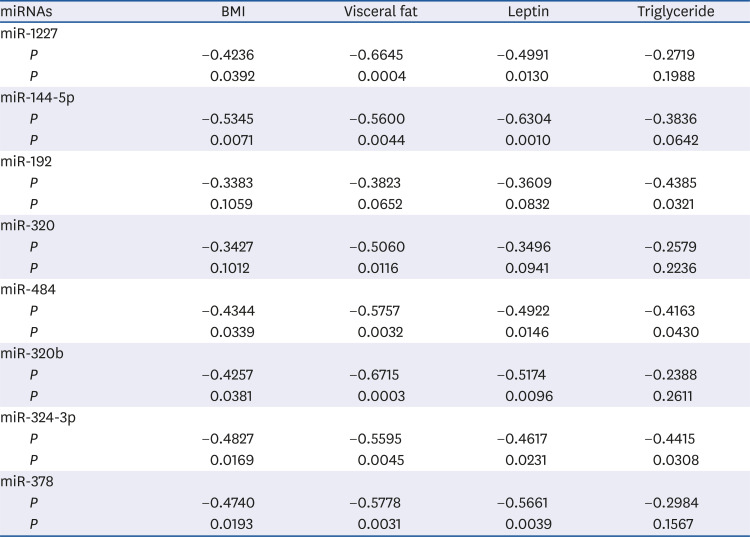
To determine whether the miRNAs were associated with obesity and obesity-related metabolic parameters, we selected 8 miRNAs (miR-1227, miR-144-5p, miR-192, miR-320, miR-320b, miR-484, miR324-3p, and miR-378) that showed > 2.0-fold decrease compared with the lean group, for further analysis. We conducted Spearman's correlation analysis of each selected miRNA and metabolic parameters (Table 2). The results indicated that the 8 circulating miRNAs were significantly associated with visceral fat content. Circulating miR-484 and miR-324-3p showed significant negative correlation in all metabolic parameters. For BMI, miR-144-5p showed strongest negative correlation (P = −0.5315, P = 0.0071). Serum leptin level is the most crucial biomarkers for obesity-induced type 2 diabetes, and was significantly inversely correlated with the expression profiles of miR-1227 (P = −0.4991, P = 0.0013), miR-144-5p (P = −0.6304, P = 0.0010), miR-484 (P = −0.4922, P = 0.0146), miR-320b (P = −0.5174, P=0.0096), miR-324-3p (P = −0.4617, P = 0.0231), and miR-378 (P = −0.5661, P = 0.0039). However, none of the tested circulating miRNAs were significantly correlated with insulin levels (data not shown). Triglyceride concentrations in obese subjects were significantly correlated with miR-192 (P = −0.4385, P = 0.0321), miR-484 (P = −0.4163, P = 0.0430), and miR-324-3p (P = −0.4415, P = 0.0308). These results suggest that decreased levels of the 8 circulating miRNAs are strongly correlated with obesity.
Table 2
Correlation between circulating miRNAs and metabolic variables
Analysis of miRNA target genes and biological functions
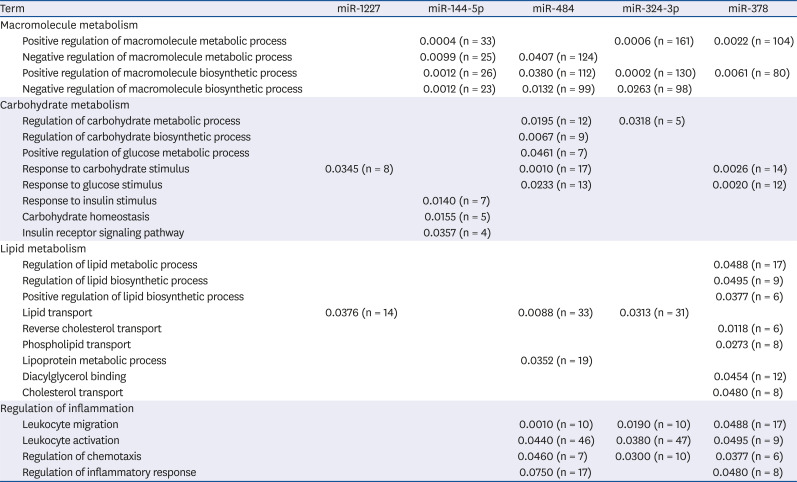
We utilized miRWalk, a database for predicting and validating miRNA targets, to screen the selected circulating miRNAs. The results predicted 1,020 target genes for miR-1227, 399 target genes for miR-144-5p, 2,950 target genes for miR-484, 3,000 target genes for miR324-3p, and 1,921 target genes for miR-378. The target genes were processed to map metabolic functions using DAVID functional annotation tools (Table 3). The potential biological roles of these 5 miRNAs were assessed by performing GO analyses of their potential gene targets using computational algorithms. The annotated genes were classified according to the following GO categories: macromolecule metabolism (n = 4), carbohydrate metabolism (n = 8), lipid metabolism (n = 9), and regulation of inflammation (n = 4) (P < 0.05). Essentially, all of the annotated genes were involved in carbohydrate and lipid metabolism. The predicted target genes of miR-484 have major roles in carbohydrate metabolism, whereas those of miR-378 have major roles in lipid metabolism. The chronic low-grade inflammation in adipose tissue affects the pathogenesis of obesity [24]. We also observed the target genes of miR-484, miR-324-3p and miR-378 are involved in the regulation of inflammation. These results suggest that the identified circulating miRNAs, especially miR-484 and miR-378, might have important roles in regulating carbohydrate/lipid metabolism and inflammation in obese individuals.
Table 3
List of the most significant GO in the biological functions derived from interrogation of predicted target genes for the miRNAs
DISCUSSION
This study showed a significant correlation between obesity and the expression of specific circulating miRNAs in the blood, including miR-1227, miR-144-5p, miR-192, miR-320, miR-320b, miR-484, miR-324-3p, and miR-378. The levels of these miRNAs are significantly reduced in the blood of young obese Korean women compared with those in lean women; the miRNAs also displayed strong inverse correlations with BMI and visceral fat content. Analysis of the GO categories and biological functions of the predicted target genes of these miRNAs indicated that miR-484 and miR-378 targeted genes that have major roles in carbohydrate and lipid metabolism.
Differential circulating miRNA profile has been reported in individuals with obesity and metabolic diseases (reviewed in [25]). Expressions of miR-17-5p and miR-132 significantly differs between obese (BMI < 40 kg/m2) and nonobese (BMI < 25 kg/m2) omental fat and in blood [18]. Morbidly white obese male patients (mean BMI 42.9) showed marked decreased levels of miR-532-5p, miR-125b, miR-130b, miR-221, miR-15a, miR-423-5p, and miR-520c-3p [1]. Compared to these previous studies, our results are not consistent. We analyzed miRNA expressions using univariate analysis rather than multivariate analysis and suggested 8 obesity-related miRNAs whose expressions were significantly changed more than 2 folds. This discrepancy would be due to the differences in the statistical approach. Also, the participant recruitment and experimental conditions could be another cause for the inconsistency.
The circulating level of miR-378 was significantly reduced in obese subjects compared with that in lean subjects, and miR-378 expression was inversely correlated with BMI, which is consistent with the results of Ortega et al. [1]. Ortega et al. [1] reported that the levels of circulating miR-378 were markedly decreased (−3.1-fold change, P = 0.00958) in obese individuals (BMI > 30) compared with those in lean individuals and these levels were severely decreased (−5.3-fold change, P = 0.03289) in morbidly obese individuals (BMI > 40). The miR-378 functional analysis predicted that it targets the nuclear receptor subfamily 2 gene family (NR1H2, which encodes the liver X receptor beta [LXR-β]). LXR-β regulates transcription factors that induce genes controlling lipid biosynthesis, including SREBP-1c and FAS. Quinet et al. [26] reported that LXR-β activation accelerated lipogenesis even if expression of the ABCA1 gene was stimulated. We suggest that decreased expression of circulating miR-378 in obese individuals might activate NR1H2 gene expression, leading to lipogenesis and hyperlipidemia in obese individuals. Decreased expression of circulating miR-378 could be one of the characteristic hallmarks of obesity.
The levels of circulating miR-484 also were reduced in obese individuals. Tang et al. [27] reported that prolonged exposure of the pancreatic β-cell line MIN6 to high glucose significantly down-regulated miR-484 expression. Down-regulation of miR-484 may contribute to insulin resistance due to abnormal mitochondrial fission (Fis1) [28], as mitochondrial fission contributes to insulin levels [29]. The predicted target genes of miR-484 have major roles in glucose regulation and responses to glucose (Table 2), suggesting that decreased expression of circulating miR-484 could lead to obesity and obesity-induced insulin resistance. Future studies should investigate whether miR-484 modulates leptin resistance, thereby affecting the efficacy of leptin-associated anti-obesity drugs.
This study had some limitations. The number of participants enrolled in the study was relatively small and limited to females. Further studies with larger cohorts of both genders are needed to confirm our results. It also will be necessary to assess gender-specific differences in miRNA expression profiles in obese and lean individuals. However, our study reveals the differentially expressed circulating miRNAs which are related to obesity in Korean young women.
The combined results of our study suggest that modulations in the expression of specific circulating miRNAs could be important factors in controlling obesity. The miRNAs identified in this study might provide useful markers or therapeutic targets for the treatment of obesity.
 XML Download