

 PDF
PDF ePub
ePub Citation
 Print
Print


INTRODUCTION
Conventional two-dimensional (2D) echocardiography is the most useful method for evaluating cardiac dimension and function, but the right ventricle (RV) has been less investigated than the left ventricle (LV). RV function is related to the morbidity and mortality associated with many heart diseases, and thus the importance of the RV has been under increasing scrutiny.1)2)3) Many echocardiographic parameters have been developed to evaluate exact RV geometry; however, the RV has some unique properties, and the measurement of RV volume and function by conventional echocardiography has inevitable limitations.
Recently, cardiac magnetic resonance imaging (CMR), which is known as a gold standard for measuring RV volume and function, has been demonstrated to overcome the limitations of RV location and structure.4)5) However, factors such as cost, portability, time consumption, and contraindications of MRI make it difficult to use in real clinical practice.
Real-time three-dimensional (3D) echocardiography is now regarded to be as accurate as CMR while being easier to perform. Real-time 3D echocardiography is superior to 2D transthoracic echocardiography (TTE) when evaluating cardiac volume and cardiac valves, especially in abnormal hearts, which have more complex structures and geometrically asymmetric morphologies.6)7)
Patients with hemodialysis (HD) often experience acute volume change as a result of ultrafiltration. Rapid saline infusion or continuous positive airway pressure might be used to evaluate acute volume change, but due to their technical or ethical problems, these methods are difficult to apply clinically. HD seems to be a suitable modality for the acute preload change, because it is easily accessible and commonly investigated as a method for evaluating cardiac function according to the preload status.8)9)
Therefore, we compared the 3D-echocardiographic parameters of RV before and after HD to evaluate the effect of patient preload changes and identify the appropriate approaches for RV function and anatomy.
METHODS
Study population
Patients who were undergoing regular HD at Bucheon St. Mary's Hospital in Bucheon, South Korea were recruited. All patients were enrolled on a prospective basis. Of the total of 98 patients who were undergoing HD regularly one month prior to enrollment in the institute, 63 subjects volunteered.
An experienced echocardiographer who was blinded to the study design performed echocardiography on all enrolled patients. The exclusion criteria were as follows: (1) history of acute coronary syndrome, (2) previous cardiac surgery or device implantation, (3) presence or previous history of significant arrhythmia, such as atrial fibrillation, (4) left ventricular ejection fraction (LVEF) less than 50%, (5) evidence of major valvular heart diseases (i.e., any degree of mitral or aortic stenosis; more than mild regurgitation of the aortic, mitral, or tricuspid valves; or presence of a prosthetic valve), and (6) a poor echocardiographic window that was not appropriate for interpretation.
Five of the 63 subjects were excluded due to either significant valve dysfunction (n = 2), arrhythmia detected during the echocardiographic examination (n = 1), LV regional wall motion abnormalities (n = 1), or a poor echocardiographic window (n = 1). Therefore, 58 subjects were finally enrolled, and their echocardiographic images were analyzed. The study protocol was approved by the Ethics Committee at the hospital, and informed consent was obtained from all study participants.
Echocardiography
Standard 2D transthoracic echocardiogram
Echocardiographic evaluations were performed using a commercially available ultrasound machine (Vivid E9; General Electric Health Care, Milwaukee, WI, USA) equipped with a phased array transducer (M5S-D). Echocardiographic images were taken immediately before and less than 30 minutes after a single HD session. The M-mode measurements included the LV dimension, as well as the diastolic septal and posterior thickness determined in the parasternal long-axis view. The LV mass was calculated using the area-length method and was corrected for the body surface area. The LV volumes and EF were calculated with the modified Simpson's method from apical four- and two-chamber views. From the pulse Doppler echocardiography of transmitral velocities, the peak E velocity, peak A velocity, ratio between the peak E and A velocities (E/A ratio), deceleration time, and isovolumic relaxation time were measured. The LV systolic S′ velocity, LV early diastolic E′ velocity, and LV late diastolic A′ velocity were measured by Doppler tissue imaging. These measurements were acquired by placing the sample volume at the septal and lateral annulus and recording at a sweep of 100 mm/s. The width and length of the region of interest were 1.6 and 3.1 mm, respectively. All examinations were performed according to the recommendation of the American Society of Echocardiography.10)11)
3D echocardiography and speckle-tracking echocardiography
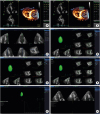
Four-beat to six-beat full-volume 3D data sets (32 ± 9 vol/s, range 20-55) were acquired during a 5-7-second breath-hold using the same Vivid E9 scanner equipped with a matrix-array transducer (4V-D). The 12-slice display was used during acquisition to ensure complete inclusion of the RV in the data set. The image quality of 3D data sets was judged subjectively. The image quality was considered poor if ultrasound loss was present in more than one-half of the RV free wall in the coronal view. Selected data sets were exported and analyzed using commercial software dedicated to the RV (4D RV-Function Version 2.0; TomTec Imaging Systems, Unterschleissheim, Germany). The step-by-step process used to acquire the real-time 3D echocardiographic data is summarized in Figure 1.
Figure 1
Example of RV 3D analysis using the TomTec 4D function. (A) Select the RV focused 4-chamber view, including LV apex and MV. (B) Click on the right mouse button on the image and click the “4D RV function”. (C) When the multi-planar images are shown, put a dot on the LV apex, MV, RV apex, tricuspid valve, aortic valve, and anterior and posterior junctions of RV-LV. Then, click ‘beutel revision’. (D) Observe the diastolic RV image, adjust the RV borders, and click the ‘tracking revision’ button. (E) Observe the modified RV data that are shown. (F) Systolic RV data were also acquired using the same process. (G) After this process, RV volume curves were shown. (H) Click the “2D” button on the left side to display the parameters of 2D. LV: left ventricle, MV: mitral valve, RV: right ventricle.
Reproducibility analysis
To evaluate intra-observer variability in the offline analysis, 10 subjects were randomly selected and analyzed by the same operator with at least a 1-week interval between the two analyses. To assess the effect of inter-observer variability, the same 10 patients were analyzed in a random order at different times using the same software by a second investigator who was blinded to the results from the first investigator.
Statistical analyses
All data are expressed as the mean ± standard deviation. The difference in continuous variables, between the before and after HD states was assessed using the paired t-test. The χ2 and Fisher's exact tests were used to evaluate the differences between categorical variables. After subtracting the post-HD values of the tissue velocity and strain from the pre-HD data, we also performed either one-way analysis of variance (ANOVA) or the independent t-test to differentiate according to the causes of end-stage renal disease (ESRD) or other preexisting clinical conditions. The correlation between the 3D image-based analysis and conventional 2D image analysis was determined using Pearson's correlation coefficient and linear regression analysis. The measurement variability (intra- and inter-observer) was assessed using Bland-Altman analysis. All data analyses were performed using the statistical analysis software package R version 3.6.0. Differences among variables were considered significant at p < 0.05.
RESULTS
The clinical characteristics of the subjects are described in Table 1. The mean age of the subjects was 59 ± 12 years, and 50% of the subjects were male (n = 29). The mean ultrafiltration rate was 11.5 ± 4.6 mL/kg/h. The most common cause of ESRD was diabetes mellitus (n = 36, 62%), the second was hypertension (n = 17, 29%), and the third was chronic glomerulonephritis (n = 3, 5%) (Table 1).
Table 1
Baseline characteristics of the patients
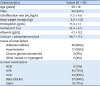
Table 2 demonstrates the changes in blood pressure and heart rate after acute preload change caused by HD. Systolic, diastolic, and mean blood pressure were significantly decreased after HD. The difference in heart rate before and after HD was not statistically significant.
Table 2
Vital signs before and after hemodialysis

The conventional 2D echocardiographic parameters of the LV are shown in Table 3. Many echocardiographic parameters of LV systolic and diastolic function were changed after HD. The LV volume (including the end-diastolic volume, end-systolic volume, and stroke volume [SV]) decreased after HD, and the LVEF was also reduced by preload reduction. Diastolic parameters were evaluated by pulse-wave Doppler, including the peak E wave velocity, E/A ratio, E wave deceleration time, and isovolumetric relaxation time, which showed significant changes based on HD status. The left atrial volume index, peak early diastolic tissue velocity (e′), and the ratio between the peak early diastolic mitral inflow velocity and peak early diastolic tissue velocity (E/e′) were changed as the diastolic function of the LV improved. Structural parameters, such as interventricular septal thickness and posterior wall thickness, did not change; however, the LV mass index was significantly reduced after HD.
Table 3
Conventional echocardiographic parameters of the LV
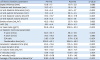
Table 4 demonstrates the RV end-systolic and diastolic volumes, RV SV, and RVEF by 3D TTE. All parameters were easily obtained from a one-cut image of the 3D LV full-volume, and these parameters were also affected by acute preload reduction. All of the RV volume parameters were reduced after HD, similarly to the 2D LV, and the RVEF measured by RV volume changes was also reduced by preload reduction (Figure 2). The 3D image-based RV longitudinal strains were also changed after HD. The values of the RV volumes were larger than the normal RV volume parameters, regardless of whether the patient was undergoing HD.12)
Table 4
Right ventricular volume and strain changes before and after hemodialysis measured by 3-dimensional echocardiography
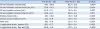
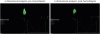
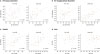
Table 5 compares the RV dimensional and functional parameters measured by 2D and 3D echocardiography. RV dimensions measured by 3D echocardiography were significantly larger than those measured by 2D echocardiography. Linear analyses showed that values of conventional 2D images were well correlated with those of 3D images, except fractional area change (FAC) (Figure 3).
Table 5
Differences in right ventricular dimensions and functional parameters measured by 2-dimensional and 3-dimensional echocardiography
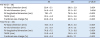
Figure 3
Correlation between 3D and 2D echocardiographic parameters: RV basal diameter (A), RV longitudinal diameter (B), TAPSE (C), FAC (D). FAC: fractional area change, RV: right ventricle, TAPSE: tricuspid annular plane systolic excursion.
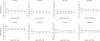
All the measurements showed good agreement, and the Bland-Altman plots are presented in Figure 4.
Figure 4
Reliability test for the fractional area change and ejection fraction of the right ventricle, Bland-Altman analyses of pre-hemodialysis and post-hemodialysis patients (top: intra-observer, bottom: inter-observer). FAC: fractional area change, HD: hemodialysis, RVEF: right ventricular ejection fraction.
DISCUSSION
Conventional 2D TTE is the most widely used method to assess cardiac function and structure. It is easier to access and has relatively more accurate information about the heart than any other cardiac imaging modalities.
The right heart, in particular the RV, is no longer a neglected structure, and assessment of the RV has gained considerable importance in recent years. As mentioned above, conventional 2D TTE is considered the most reliable method for assessing the RV. Similar to LVEF, which is a representative indicator of the LV systolic function, there are some parameters suitable for the echocardiographic assessment of RV function in adults. Tricuspid annular plane systolic excursion (TAPSE) is the most commonly used parameter for RV functional assessment. A lower TAPSE is related to a lower cardiac index and worse survival.13)14) FAC is measured using the same method as that of LVEF and is also considered a representative marker for RVEF. FAC has a good correlation with the MRI-derived RVEF15) and the prediction of mortality and morbidity in many cardiac diseases.16)17) Many studies have shown that RV strain is a powerful value for assessing RV function.18)19)
However, the RV has its own complex anatomy and physiology, and accurate RV measurement remains a challenge. The location of the RV is immediately posterior to the sternum, directly behind the bony structures, and it is therefore difficult to obtain adequate echocardiographic windows for clear visualization. In addition, the normal RV has an unusual crescent shape, with heavy endocardial trabeculation. This characteristic makes it difficult to achieve a precise RV endocardial evaluation. With the intersection of echocardiographic skills and limitations, it is difficult to obtain a “true RV-focused” apical four-chamber view, which can result in significant variability in the measurement of RV size depending on the imaging window. For example, a common pitfall of FAC is undertracing of the cavity inside the trabeculation or the moderate band.20) In our study, this tendency was also maintained. RV dimensions and FAC in 3D parameters are always larger than 2D parameters. The correlation of 2D FAC and 3D FAC is not statistically significant, whereas other parameters are well correlated. As this measurement is incorrect in 2D TTE, there tends to be greater variability between and within observers, making the quantitative results produced by this method less reproducible.
For these reasons, it is necessary to quantify RV function using novel imaging modalities that differ from those used before. Recent advances in cardiac imaging modalities have made it possible to assess cardiac geometry more closely. CMR is regarded as the “gold standard” method for assessing RV function and anatomy.19) However, considering its accessibility, contrast medium toxicity, and cost, as well as its restricted use for patients with claustrophobia, it is difficult for CMR to completely replace conventional echocardiography.
Real-time 3D TTE, first introduced in 1991, is known to have advantages for the measurement of LV volume, with good correlation with cardiac MRI. 3D TTE is considered a good option to measure LV volumes, especially in cases of cardiomyopathy or aneurysmal changes that distort the geometry of the LV, which make it difficult to measure exact values with 2D TTE.6)21) With the development of hardware and imaging-related programs for RV, we used this method to measure the RV size and function. Recent studies have demonstrated the accuracy of 3D TTE-measured RV volume and function against CMR22)23) and have determined the reference values of the RV volumes and RVEF in healthy subjects.12)24)
The subjects of our study were ESRD patients who were undergoing regular HD, and such patients have been used as a model for acute preload change in many studies. These studies showed that LV function is significantly decreased following preload reduction with HD.25) 3D TTE has also been used on HD patients to evaluate dynamic LV volume changes with HD.26) Additionally, several previous studies have compared changes in TTE parameters with changes in preload and afterload in a healthy RV.27)28) RV systolic dysfunction is relatively common in HD patients. Compared with healthy subjects, nondiabetic normotensive HD patients show both RV systolic and diastolic dysfunctions.29) The pathogenesis of RV dysfunction in ESRD patients is explained by uremia, fluid retention, anemia, hyperparathyroidism, and arteriovenous fistula.29)30) In our study, the RV volume values were larger than the established normal range. Our study subjects had ESRD and underwent HD, indicating that they may have had RV dysfunction with morphologic abnormalities. The effects of volume changes on RV measurements were compared by echocardiographic parameters before and after HD, which regulated the effective volume of the patients in this study. Usually, the ultrafiltration volumes varied from 500 mL to 4 L at one session of conventional HD, considering the mean ultrafiltration rate and body weight of this study, which was suitable for comparing pre- and post-HD cardiac parameters depending on preload changes.
Our study has several characteristics distinct from previous studies that have investigated changes in echocardiographic parameters based on preload changes. Using a relatively new method for assessing cardiac chambers, namely, 3D echocardiographic images with the commercial vendor-program, we measured geometric and functional parameters of the RV, for which clinical significance is emerging. This vendor-program has already been used and is expected to be widely employed clinically. To compare the effect of preload changes on cardiac volumes and functions, we studied patients undergoing HD, and this method made it easier to regulate the preload than did other known methods.
Conclusion
The primary purpose of this study was to compare the differences between 2D- and 3D-transthoracic RV parameters following a reduction in the patient's preload. The 3D structural and functional parameters of the RV are affected by acute preload changes derived from HD. Conventional parameters and strain derived from 3D echocardiographic images are also affected by acute preload changes. Moreover, parameters representing RV structure and function derived from novel 3D TTE should be interpreted with caution considering the preload status.
Limitations
Several limitations of this study are noted. The major limitation was that the study was performed at a single center with a relatively small study population. Second, there was a risk of selection bias when 3D TTE acquisition was performed with relatively good image quality. Third, the method for measuring the RV volume, dimension, and function was dependent on the imaging quality and not based on the volume or dimension; furthermore, RV catheterization and cardiac MRI for accurate assessment were not performed. Finally, we studied ESRD patients with cardiac dysfunction and anatomical abnormalities; therefore, the results cannot be universally applied. Moreover, the heterogeneity of the subjects was not fully described.
 XML Download