

 PDF
PDF ePub
ePub Citation
 Print
Print


Abstract
Purpose
To investigate correlations between macular retinal ganglion cell (RGC) layer thickness and best-corrected visual acuity (BCVA) and visual field parameters in patients with bilateral temporal optic atrophy.
Methods
Thirty eyes of 15 patients with bilateral temporal optic atrophy and 30 eyes of 15 normal subjects that were age- and sex-matched were included in the study. We measured the thicknesses of the RGC layers of posterior poles using optical coherence tomography volume scanning. The RGC layer was divided into nine zones based on the Early Treatment of Diabetic Retinopathy Study baseline. Possible correlations of the RGC layer with the BCVA and visual field parameters were determined.
Results
The RGC layer thickness was significantly thinner in all patients compared to those in the control group (p = 0.001). The RGC layer thicknesses in the inner superior, inner temporal, inner inferior, and inner nasal areas were significantly correlated with the BCVA (r = −0.650, r = −0.626, r = −0.616, and r = −0.636, respectively; p = 0.000). The RGC layer thicknesses in the outer superior, outer temporal, outer inferior, and outer nasal areas were significantly correlated with the mean deviation of the visual field test (r = 0.470, r = 0.349, r = 0.496, and r = 0.469, respectively; p < 0.05).
Figures and Tables
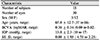
Figure 1
Representative figure of a 40-year-old female with visual acuity of 0.30 logarithm of minimal angle of resolution (logMAR) in the right eye and 0.30 logMAR in the left eye, showing a severe decrease in the retinal ganglion cell layer thickness.
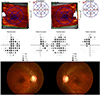
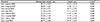
Figure 2
Graphs showing retinal ganglion cell layer thicknesss of patient group and control group. In the patient group, the average thickness is thin in all areas.
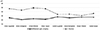
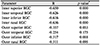
Figure 3
Scatterplots showing each linear regression analysis model. (A) Relationship between inner superior retinal ganglion cell (RGC) layer thickness and best-corrected visual acuity (BCVA). (B) Relationship between inner temporal RGC layer thickness and BCVA. (C) Relationship between inner inferior RGC layer thickness and BCVA. (D) Relationship between inner nasal RGC layer thickness and BCVA; thinner RGC layer thicness was correlated with lower BCVA. logMAR = logarithm of minimal angle of resolution.
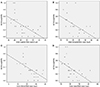
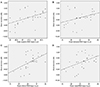
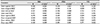
Figure 4
Scatterplots showing each linear regression analysis model. (A) Relationship between outer superior retinal ganglion cell (RGC) layer thickness and mean deviation (MD). (B) Relationship between outer temporal RGC layer thickness and MD. (C) Relationship between outer inferior RGC layer thickness and MD. (D) Relationship between outer nasal RGC layer thickness and MD; thinner RGC layer thicness was correlated with lower MD.
References
1. Oluleye TS, Ajaiyeoba AI, Fafowora OF, Olusanya BA. The aetiology of optic atrophy in Nigerians--a general hospital clinic study. Int J Clin Pract. 2005; 59:950–952.

2. Vaphiades MS, Brodsky MC. Pediatric optic atrophy. Int Ophthalmol Clin. 2012; 52:17–28. xiii

3. Soltan-Sanjari M, Parvaresh MM, Maleki A, et al. Correlation between retinal nerve fiber layer thickness by optical coherence tomography and perimetric parameters in optic atrophy. J Ophthalmic Vis Res. 2008; 3:91–94.

4. Zhang Y, Huang H, Wei S, et al. Characterization of retinal nerve fiber layer thickness changes associated with Leber's hereditary optic neuropathy by optical coherence tomography. Exp Ther Med. 2014; 7:483–487.
5. Kim TW, Hwang JM. Stratus OCT in dominant optic atrophy: features differentiating it from glaucoma. J Glaucoma. 2007; 16:655–658.
6. DeWitt CA, Johnson LN, Schoenleber DB, et al. Visual function in patients with optic nerve pallor (optic atrophy). J Natl Med Assoc. 2003; 95:394–397.
7. Park JY, Choi J, Oh WH, Kim JS. Influence of RNFL thickness on visual acuity and visual field in bilateral temporal optic atrophy. J Korean Ophthalmol Soc. 2016; 57:969–976.
8. Xu X, Xiao H, Guo X, et al. Diagnostic ability of macular ganglion cell-inner plexiform layer thickness in glaucoma suspects. Medicine (Baltimore). 2017; 96:e9182.
9. Mead B, Tomarev S. Evaluating retinal ganglion cell loss and dysfunction. Exp Eye Res. 2016; 151:96–106.
10. Corajevic N, Larsen M, Rönnbäck C. Thickness mapping of individual retinal layers and sectors by Spectralis SD-OCT in Autosomal Dominant Optic Atrophy. Acta Ophthalmol. 2018; 96:251–256.
11. Asanad S, Tian JJ, Frousiakis S, et al. Optical coherence tomography of the retinal ganglion cell complex in leber's hereditary optic neuropathy and dominant optic atrophy. Curr Eye Res. 2019; 44:638–644.
12. Cheung CY, Ikram MK, Chen C, Wong TY. Imaging retina to study dementia and stroke. Prog Retin Eye Res. 2017; 57:89–107.
13. Moster SJ, Moster ML, Scannell Bryan M, Sergott RC. Retinal ganglion cell and inner plexiform layer loss correlate with visual acuity loss in LHON: a longitudinal, segmentation OCT analysis. Invest Ophthalmol Vis Sci. 2016; 57:3872–3883.
14. Lee JY, Choi JH, Park KA, Oh SY. Ganglion cell layer and inner plexiform layer as predictors of vision recovery in ethambutolinduced optic neuropathy: a longitudinal OCT analysis. Invest Ophthalmol Vis Sci. 2018; 59:2104–2109.
15. Kobayashi W, Kunikata H, Omodaka K, et al. Correlation of papillomacular nerve fiber bundle thickness with central visual function in open-angle glaucoma. J Ophthalmol. 2015; 2015:460918.
16. Rebolleda G, Sánchez-Sánchez C, González-López JJ, et al. Papillomacular bundle and inner retinal thicknesses correlate with visual acuity in nonarteritic anterior ischemic optic neuropathy. Invest Ophthalmol Vis Sci. 2015; 56:682–692.
17. Cho KH, Ahn SJ, Jung C, et al. Ischemic injury of the papillomacular bundle is a predictive marker of poor vision in eyes with branch retinal artery occlusion. Am J Ophthalmol. 2016; 162:107–120.
18. Park SW, Hwang JM. Optical coherence tomography shows early loss of the inferior temporal quadrant retinal nerve fiber layer in autosomal dominant optic atrophy. Graefes Arch Clin Exp Ophthalmol. 2015; 253:135–141.
 XML Download