

 PDF
PDF Citation
 Print
Print


INTRODUCTION
Many fungi are ubiquitous in the environment, and can frequently colonize humans as a host. Disruption of the immune system raises the risk for subsequent fungal infection. Fungal sinusitis is relatively common, and is widely categorized by an invasive or non-invasive pathology. Fungus ball is the most frequent form of fungal sinusitis, which is defined by the absence of hyphae within the mucosa, submucosa, bone, or blood vessels of the paranasal sinuses (PNSs).12 It is an extramucosal fungal proliferation that completely fills one or more PNSs without inspissated allergic mucin.12 However it is very important to treat fungus ball because with the deterioration of host immunity, fungus ball may progress to invasive fungal sinusitis.34 Sinonasal fungus ball can be eradicated completely with surgical treatment.1567 Moreover, fungal samples obtained during surgery frequently fail to grow, which made the culture results negative and fungi do not stain well with routine stains, and special silver-impregnated fungal stains are required for identification of the fungal organism.18 Even with those special stains, it is hard to distinguish fungal organisms.910 Therefore, preoperative suspicion of fungus ball is important in selecting the appropriate treatment strategy and for obtaining appropriate samples during surgery.
Nevertheless, it is not easy to differentiate fungus ball from unilateral non-fungal sinusitis on radiologic imaging. Prior studies have reported several computed tomography (CT) findings as typical features of fungus ball, such as sinus opacification with or without associated flocculent calcifications or a hyper-attenuating fungus ball located in the central area of the sinus with mucosal thickening on enhanced CT scans.17111213 However, there have been few studies focusing on magnetic resonance imaging (MRI) findings of fungus ball. Seo et al.7 suggested a marked hypo-intensity of fungus ball with hyper-intense mucosal walls on T2-weighted images (T2WI) in 17 patients. However, these marked hypo-signal intensity lesions are usually mistaken as normal sinus air in clinical practice and hyper-intense mucosal walls with central sinus air is a typical imaging finding of chronic sinusitis. Furthermore, sinusitis is a very common finding on routine brain MRI, which usually covers PNSs. Therefore, it is important to identify MRI findings that deserve attention in order to diagnose fungal sinusitis. In addition, even though T1-weighted images (T1WI) and T2WI are the basic sequences of all magnetic resonance (MR) examinations, there have been a few reports of findings of fungus ball on T1WI. Even those reports showed variable results.7141516
The purpose of this study was to identify reliable MRI findings of fungus ball, especially focusing on imaging findings of T1WI, by comparing with T2WI and the CT findings in patients with pathologically confirmed fungus ball.
METHODS
Patient population
We retrospectively searched patients who underwent both CT and MRI studies preoperatively between January 2015 and April 2018, and then underwent sinonasal surgery for treatment of chronic sinusitis. The CT and MR examinations had to be performed within 3 months before sinonasal surgery, and covered both PNSs. The interval between CT imaging and MRI was 12.0 ± 16.2 days and that between MRI and surgery was 12.1 ± 18.1 days. Finally, we enrolled 55 patients who were histopathologically confirmed as having sinonasal fungus balls, meeting the above conditions. Sinonasal fungus balls were confirmed using hematoxylin and eosin stain, Gomori's methenamine silver stain and periodic acid schiff. Cases with allergic fungal sinusitis or invasive fungal disease were excluded. Of the patients, 18 were men and 37 were women, with the mean age of 64.4 ± 10.8 years (range, 45–86 years).
Image acquisition
Among the 55 patients, all underwent CT scans (SOMATOM Definition AS plus; Siemens Healthcare, Erlagen, Germany) for preoperative assessment of the PNSs. All CT scans obtained to visualize the PNSs included coronal and axial cross-sections (slice thickness, 3 mm).
On the other hand, only 30 patients underwent PNS MRI for the evaluation of sinusitis. The remaining 25 patients performed MR studies for the evaluation of brain rather than sinusitis. All PNS MR studies included axial spin-echo T1WI and T2WI and routine MR protocols for the brain also included axial (and/or sagittal) T1WI and axial T2WI. We evaluated these T1WI and T2WI for the evaluation of the PNSs. All PNS MR studies were performed using a 3.0-T MRI system (MAGNETOM Skyra; Siemens Healthcare) and a 16-channel head coil. Brain MR studies were performed on various MR systems since some of them were obtained at outside hospitals. Thirteen patients underwent routine brain MR examination in our institution, six underwent brain MR examination in an outside hospital, four underwent posterior fossa MRI, and two underwent pituitary fossa MRI. However, all examinations were performed on 1.5-T or 3.0-T MR system. The imaging parameters of PNS MR were repetition time (TR)/echo time (TE), 3,000/126 ms; field of view (FOV), 194 × 230 mm; matrix, 512 × 281; and slice thickness/gap, 4/1.2 mm for T2WI and TR/TE, 598/11 ms; FOV, 194 × 230 mm; matrix, 384 × 211; and slice thickness/gap, 4/1.2 mm for T1WI. The parameters of routine brain MR on 3T (MAGNETOM Skyra; Siemens Healthcare) were TR/TE, 5,190/91ms; FOV, 194 × 230 mm; matrix, 448 × 265; and slice thickness/gap, 5/2 mm for T2WI and TR/TE, 350/3 ms; FOV, 195 × 230 mm; matrix, 480 × 228; and slice thickness/gap, 5/2 mm for T1WI.
Image analysis
The images were independently reviewed by two experienced Head & Neck, neuroradiologists with consensus method. Reviewers determined 1) the location of the soft tissue mass, 2) multi-focality, 3) the presence of calcifications in the soft tissue mass, and 4) classification of calcifications on CT images. Calcifications were considered to be present when the CT attenuation of the focal high-density area was higher than that of surrounding inflammatory tissue and close to the attenuation of discrete bone density.11 When calcifications are present, the shape of the calcifications was categorized into two groups: dense calcifications, which were similar to polygon, rectangular, globular, or eggshell calcifications vs. amorphous/fine calcifications, which showed a fine punctate or irregular shape with ill-defined margins (Figs. 1 and 2). With regards to MR images, T1WI and T2WI sequences were analyzed. We tried to discriminate between the fungal mass and mucosal membrane on MR images, compared with the fungal mass on CT from the same patient. Then we evaluated signal intensity of fungus ball on T1WI and T2WI as follows: dark, similar signal intensity to signal intensity of the skull cortex; hypo, lower signal intensity compared with the gray matter of the brain; iso, similar signal intensity to that of the gray matter; and hyper, higher signal intensity compared with the signal intensity of the gray matter. When the signal intensity of the fungal mass is heterogeneous or mixed, the overall signal intensity of a fungus ball is defined by the predominant signal intensity. In addition, we recorded the presence of the dark signal intensity portion in the fungal mass on T2WI and high signal intensity portion on T1WI. Then we categorized the extent of dark signal intensity portion on T2WI and high signal intensity portion on T1WI compared with the extent of fungus ball seen on CT images into four categories: 1) category 1: there was no dark signal intensity portion on T2WI or high signal intensity portion on T1WI of the fungus ball, 2) category 2: dark signal intensity portion on T2WI or high signal intensity portion on T1WI was smaller than the extent of the whole soft tissue density fungal mass on CT, 3) category 3: the whole fungal mass showed dark signal intensity on T2WI or high signal intensity on T1WI (Fig. 2), 4) category 4: the extent of dark signal intensity on T2WI or high signal intensity on T1WI was larger than the extent of fungal mass on CT (T2WI of Fig. 1). We also evaluated whether the T1-weighted high signal intensity portion included calcifications shown on CT to figure out the relationship between T1-weighted high signal intensity and calcification.
Fig. 1
A 56-year old woman with a fungus ball in the right maxillary sinus. Air (arrows) caused a larger area of dark signal intensity portion on the T2-weighted image compared with the area of soft tissue mass on the axial CT image. (A) An axial CT image shows a soft tissue lesion with internal amorphous calcification and diffuse sinus wall thickening in right maxillary sinus. (B) An axial T2-weighted MRI shows diffuse hyper-signal mucosal thickening with central dark signal in right maxillary sinus which can be interpreted as non-fungal sinusitis. (C) An axial T1-weighted MRI shows hyper-intense signal lesion in the area of T2-weighted dark signal lesion.
CT = computed tomography, MRI = magnetic resonance imaging.
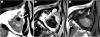
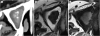
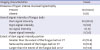
Fig. 2
An 83-year old man with a fungus ball in the right maxillary sinus. (A) An axial CT image shows a soft tissue density lesion filling the right maxillary sinus with amorphous calcifications. (B) An axial T2-weighted MRI shows central dark signal lesion with hyper-signal, hypertrophic sinus mucosal walls which can be interpreted as non-fungal sinusitis. (C) An axial T1-weighted MRI shows iso- to hyper-intense signal lesion in the right maxillary sinus, which corresponds to the soft tissue density lesion on CT and dark signal intensity lesion on T2-weighted MRI.
CT = computed tomography, MRI = magnetic resonance imaging.
Statistical analysis
The level of inter-observer agreement in the evaluation of MR signal intensities in terms of overall signal intensity and extent of dark signal intensity on T2WI or high signal intensity on T1WI was assessed with Weighted κ statistics. The relationship between the presence of calcification on CT scans and high signal intensity on T1WI was analyzed using Fischer's exact test. Also, the correlation between the shape of calcifications and overall signal intensity of the fungal mass, and the presence of high signal intensity on T1WI was evaluated using χ2 or Fischer's exact test. All statistical analyses were performed using the SPSS statistical software program (version 17.0; Chicago, IL, USA). P values less than 0.05 were considered statistically significant.
RESULTS
Forty-nine (89.1%) of 55 patients had a sinonasal fungus ball in a solitary sinus. The fungus balls were predominantly located in the maxillary sinuses (79.6%, 39/49). The remaining 10 fungus balls (20.4% of 49 patients) were in the sphenoidal sinuses. Four patients had a fungus ball involving multiple sinuses. Among these four, two patients had a fungus ball in the ethmoidal and maxillary sinuses, one patient in the sphenoidal and ethmoidal sinuses, and the other had involvement of the bilateral sphenoidal sinuses. The remaining two patients had two fungus balls, each in the bilateral maxillary sinuses (Table 1). Aspergillus species were pathologically confirmed in 53 patients and Candida species were confirmed in two.
Table 1
Involved sinuses of fungus balls on CT images (n = 55)
Forty-nine (89.1%) of the 55 patients had focal high density areas highly suggestive of sinus calcifications on CT (Figs. 1-3). The shapes of the calcifications were amorphous/fine (n = 32, 65.3%) (Figs. 1 and 2), dense (n = 9, 18.4%) (Fig. 3), and both (n = 8, 16.3%) out of 49 calcifications found on CT scans.
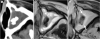
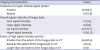
Fig. 3
A 43-year old woman with a fungus ball in the left maxillary sinus. (A) An axial CT image shows soft tissue density filling in the left maxillary sinus with internal dense calcification. (B) An axial T2-weighted MRI shows diffuse hyper-signal mucosal thickening and the calcification appeared as a dark signal lesion in the left maxillary sinus. (C) An axial T1-weighted MRI shows dark signal of calcification in the left maxillary sinus with hyper-signal portion (arrows) around the calcification.
CT = computed tomography, MRI = magnetic resonance imaging.
On T2WI, all 55 patients showed hyper-intense signal mucosal walls surrounding fungus balls (Figs. 1-4). In analysis of overall signal intensities of fungus balls, 90.1% (n = 50) showed dark signal intensity, 3.4% (n = 2) were hypo-signal, and the other 3.4% (n = 2) were hyper-signal intensities. Only one fungal mass showed iso-signal intensity. All 55 patients, even patients without calcifications on CT scan, had dark signal intensity portions in the fungus ball on T2WI (Fig. 4). The majority (n = 41, 74.5%) showed a smaller area of dark signal intensity portions than the whole extent of fungal mass (Figs. 2-4), while 14.5% (n = 8) demonstrated a larger area of dark signal intensity portions compared with the area of soft tissue mass on CT (Fig. 1 and Table 2).The level of inter-observer agreement in the evaluation of overall signal intensities and extent of dark signal intensity portions on T2WI showed substantial agreement and almost perfect agreement, respectively. (κ = 0.78 and 0.89)
Fig. 4
A 74-year old woman with a fungus ball in the right maxillary sinus. (A) An axial CT image shows a soft tissue density lesion filling the right maxillary sinus without definite internal calcifications. (B) An axial T2-weighted MRI shows dark signal lesion involving right maxillary sinus with diffuse hyper-signal mucosal thickening which can be interpreted as non-fungal sinusitis. (C) An axial T1-weighted MRI shows heterogeneous signal lesion in the maxillary sinus with hyper-intense signal portion (arrows).
CT = computed tomography, MRI = magnetic resonance imaging.
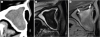
Table 2
Imaging characteristics of fungus balls on T2-weighted MR images (n = 55)
On T1WI, 72.7% (n = 40) of the fungus balls had iso-intense overall signals, 20% (n = 11) had hyper-intense overall signals, and 3.6% (n = 2) had hypo-intense overall signals. Only 3.6% (n = 2) of fungal masses showed dark signal intensity on T1WI. Forty-nine of 55 (89.1%) fungus balls had high signal intensity portions on T1WI (Figs. 1-4). Among these 49 fungus balls, 44 lesions (89.8%) presented calcifications on CT scan. However, there was no statistically significant correlation between the presence of calcifications on CT scans and the presence of high signal intensity portion on T1WI (P = 0.52). Furthermore, only calcifications in 19 (43.2%) out of 44 lesions were located within the high signal intensity portions on T1WI (Figs. 1 and 2). In terms of the extent of high signal intensity portion, the majority (83.6%, 46/49) showed a smaller area of high signal intensity portion than the whole extent of the fungal mass shown on CT, while only three lesions demonstrated the same extent of high signal intensity portion as the whole extent of the fungus ball. Six had no high signal intensity portion at all. None of 55 lesions showed a larger area of high signal intensity portion than the extent of fungal mass on CT (Table 3). The level of inter-observer agreement in the evaluation of overall signal intensities and extent of dark signal intensity portions on T1WI showed substantial agreement. (κ = 0.75 and 0.76, respectively)
Table 3
Imaging characteristics of fungus balls on T1-weighted MR images (n = 55)
There was no significant correlation between the shape of calcifications and overall signal intensity of the fungal mass or the presence of high signal intensity portion on T1WI (P = 0.91 and 0.46, respectively).
DISCUSSION
Our study demonstrated that all the fungus balls had dark signal intensity portion on T2WI and most (89.1%) had high signal intensity portion on T1WI on MRI. Prior studies have reported similar results that most fungus balls showed markedly hypo-intense signal on T2WI.37141617181920 Seo et al.7 reported that 94.1% among 17 patients showed markedly hypo-signal intensity on T2WI. Similarly, Nomura et al.19 reported 100% sensitivity (n = 32) of hypo-signal intensity on T2WI for detecting fungus balls. They suggested that the absence of free water within the fungus ball resulted in markedly hypo-intensity, as well as calcifications and paramagnetic metals such as iron, magnesium, and manganese shown on CT scans were visualized as areas of signal void on T2WI.3714 In the present study, all 55 patients, even those without calcifications on CT, showed dark signal intensity portions within fungus balls on T2WI. Therefore, we agree with the explanation that not only calcifications, but also other paramagnetic substances from fungal organisms, can contribute to T2 shortening. In addition to hypo-signal intensity of the fungal mass, the authors of previous literature reported that the inflamed mucosal lining of the PNSs showed hyper-signal intensity thickening along the sinus walls on T2WI, and that was another key feature of the fungus ball.715 However, we believe that hyper-intense mucosal thickening with a central dark signal lesion on T2WI in the PNSs can be mistaken for non-fungal chronic sinusitis with central normal sinus air. Some authors1618 also stated that intra-sinonasal desiccated secretions, air or even acute clotted hemorrhage may show hypo-intensity to signal void on T2WI and it is often assumed that the dark signal area represents normal sinus air. Similarly, in the present study, approximately 15% of fungal masses had a larger extent of dark signal intensity on T2WI than the extent of fungus ball on CT, because the dark signal intensity of the intra-sinus air and fungus ball were not clearly distinguished on T2WI. Therefore, it is not easy to suggest a fungus ball when the aforementioned findings are just observed on T2WI especially when CT images or other clinical information are not available.
On the other hand, imaging findings of the fungus ball on T1WI have not been described well in previous literatures. Czechowski et al.14 described small lesions of low signal intensity on T1WI and T2WI in 16 of 20 patients with sinonasal fungus balls, while Seo et al.7 reported that 35.3% of fungal masses were hypo-intense and 47.1% were iso-intense on T1WI among 17 patients. In addition, Som et al.16 demonstrated that fungus ball appeared as a non-enhanced, often heterogeneous nodular hypo-intensity on T1WI. However, a recent case report emphasized central T1-weighted hyper-signal intensity of a fungus ball in the sphenoidal sinus.15 The authors described the fungus ball that showed slight hyper-signal intensity on T1WI surrounded by hypertrophic mucosal walls with T2-weighted hyper-intensity. They suggested that T1-weighted hyper-intensities may be explained by the presence of tiny calcifications in the tissue matrix.1521 In our study, although overall signal intensities of fungal masses varied from hypo-intensity to hyper-intensity on T1WI as previously reported, there were hyper-intense portions within the fungus ball in most cases (89.1%). Since there was no statistically significant correlation between the presence of calcifications on CT and the presence of high signal intensity portion on T1WI, and only 38.8% (19/49) of the lesions with T1-weighted hyper-intensity contained calcifications in the high signal portions of the masses, calcification does not appear to be the main cause of T1-weighted hyper-intensity. Moreover, approximately 10% (5/49) of lesions with T1-weighted hyper-intensity even did not present any calcifications on CT. Therefore, we suggest that T1 relaxation time can be shortened not only by calcification, but also by other heavy metals (iron and manganese) within the fungal hyphae.1922232425 Furthermore these paramagnetic substances can be seen as dark signal intensity on T2WI as mentioned above.
Based on the results of this study, if a patient has dark signal intensities surrounded by high signal intensity, hypertrophic mucosal walls on T2WI, physicians should focus on T1WI to determine the presence of high signal intensity portions in dark signal areas on T2WI. Unlike the signals of sinus air, which appears as dark signal intensity on both T1WI and T2WI, fungus balls usually appear as T1-weighted high or iso signal intensities rather than dark signal intensity.
In addition to the intrinsic limitations of selection bias from any retrospective cross-sectional study, our study had some limitations. First, we did not compare the findings of chronic sinusitis which shows similar imaging findings on T2WI with those of fungus balls, directly. However, this is a kind of preliminary study to evaluate if there is any usefulness or added value of T1WI in the assessment of fungus ball. We are also preparing a next study to compare the imaging findings of chronic sinusitis and fungus balls on MR images, directly. Second, as our study did not include other kinds of fungal infections such as invasive fungal sinusitis or allergic fungal sinusitis, we could not evaluate the signal intensities of other forms of fungal sinusitis. Third, we did not match MRI findings with histopathologic findings directly. Therefore, we do not know what materials make certain signal intensities on MR images exactly. Previous reports have suggested that fungal hyphae containing calcium and paramagnetic elements such as manganese and iron which significantly influence the MR signals make unique MR signals of a fungus ball. Last, the number of cases was too small to generalize the results. Further studies with more cases are warranted.
Central dark signal intensity with high signal intensity walls of PNSs on T2WI was reported to be a characteristic imaging feature of fungus ball in previous studies. However, this finding alone can be overlooked and sometimes mistakenly interpreted as non-fungal chronic sinusitis. Based on our results, fungus ball can be suggested as one of the differential diagnoses by the presence of hyper-signal intensity portions in the fungal mass on T1WI in conjunction with a dark signal intensity surrounded by high-signal, hypertrophic mucosal walls in the PNSs on T2WI.
 XML Download