

 PDF
PDF ePub
ePub Citation
 Print
Print


INTRODUCTION
Brown adipose tissue (BAT) is characterized by multilocular lipid droplets, mitochondria-rich adipocytes, and the expression of uncoupling protein 1 (UCP1) [12]. BAT is more resistant to obesity-induced inflammation and oxidative stress than white adipose tissue (WAT) [3]. However, reductions in BAT function dramatically contribute to the development of obesity and/or diabetes [45], and BAT dysfunction has been associated with inflammation and oxidative stress in both of these conditions [67]. Therefore, BAT may be a useful target for treatments of obesity and/or diabetes [8]. However, more precise mechanisms are required for the amelioration of obesity-induced BAT dysfunction.
Lipocalin 2 (LCN2) is a critical regulator of BAT activation [910]. Its deficiency leads to an increase in body weight and impairs adaptive thermogenesis [11]. In response to cold, LCN2 upregulates the expression of UCP1, which mediates BAT thermogenic activity [910]. Notably LCN2, which was originally isolated from neutrophilic granules, has been linked to obesity and adipocyte inflammation because nuclear factor-kappa B (NF-κB) transactivates its expression [1213]. Furthermore, LCN2 is believed to be an iron-binding protein [14] that can induce oxidative stress [15]. Based on these findings, we propose that LCN2 plays an important role in the regulation of iron-mediated inflammation and oxidative stress in the BAT of obese mice.
Caloric restriction (CR) has been shown to reverse obesity-induced insulin resistance by reducing adiposity [16] and increasing mitochondrial biogenesis [17]. However, its effects on inflammation and oxidative stress in mice fed a high-fat diet (HFD) are unclear. Hence, we investigated the protective effects of CR on LCN2-mediated inflammation and oxidative stress in the BAT of HFD-fed mice.
METHODS
Animal model
Three-week-old male C57BL/6 mice were purchased from KOATECH (Pyeongtaek, Korea) and maintained in the animal facility at Gyeongsang National University (GNU). Animal experiments were performed in accordance with the National Institutes of Health guidelines on the use of laboratory animals. The GNU Animal Care Committee for Animal Research approved the study protocol (GNU-130306-M0021). The mice were individually housed under a 12-h light/dark cycle. The mice had ad libitum access to food and water. To determine the effects of CR on changes in BAT induced by a HFD, mice were divided into two groups at 4 weeks of age and fed either a HFD (n = 20, 60 kcal% fat, 5.24 kcal/g; Research Diet, Inc., New Brunswick, NJ, USA) or normal standard diet chow (n = 10, normal diet [ND], 3.1 kcal/kg; Harlan Laboratories, Inc., Indianapolis, IN, USA) for 20 weeks. HFD-fed animals were then either continued on the HFD (n = 10) or subjected to CR (n = 10, 2 g/day of the HFD) for 12 weeks, as previously described [18].
Histological analysis and iron (III) staining
For histological analyses and staining, mice (n = 4 per group) were anesthetized with tiletamine/zolazepam (Zoletil 5 mg/kg; Virbac Laboratories, Carros, France). BAT samples from the interscapular region were fixed with 4% paraformaldehyde in 0.1 M phosphate buffered saline. After 6 h, BAT was embedded in paraffin, sliced into 5-µm sections, and stained with hematoxylin and eosin (H&E) (Sigma-Aldrich, St. Louis, MO, USA). The sections were visualized under a BX51 light microscope (Olympus, Tokyo, Japan). Iron accumulation in BAT was identified using an iron (III) staining kit (Abcam, Cambridge, UK), according to the manufacturer's instructions. Deposits of iron stained blue, and nuclei stained pink. Iron-positive cells were counted under light microscopy. Three fields (500 × 500 µm2) were randomly selected from two consecutive sections (n = 4 per group).
BAT triglyceride assay
Frozen BAT samples (n = 6 per group) were homogenized, and triglyceride (TG) levels were determined using a colorimetric assay kit (Cayman, Ann Arbor, MI, USA), according to the manufacturer's protocol.
Quantitative real-time polymerase chain reaction (qRT-PCR)
Total BAT RNA (n = 6 per group) was isolated using the TRIzol reagent (Invitrogen, Carlsbad, CA, USA). Complementary DNA was then synthesized using a reverse-transcription kit (Thermo Scientific, Waltham, MA, USA), according to the manufacturer's instructions. QRT-PCR was performed using the LightCycler 480 Instrument II (Roche, Mannheim, Germany) with the TOPreal qPCR 2× PreMix (Enzynomics, Daejeon, Korea) and iQ SYBR Green Supermix (Bio-Rad, Hercules, CA, USA). The PCR primers used for this study were presented in Supplementary Table 1. Expression was normalized to the level of glyceraldehyde 3-phosphate dehydrogenase as an internal control.
Protein extraction and Western blotting
Total lysates were prepared from BAT (n = 6 per group), as previously described [19]. To obtain the nuclear fraction, we used the NE-PER Nuclear and Cytoplasmic Extraction Kit (Pierce, Rockford, IL, USA). Mitochondria from BAT was obtained using the Mitochondrial Isolation Kit (Thermo Fisher Scientific). Protein concentrations were determined using a Bio-Rad protein assay, and samples were stored at −80℃ until use. Western blot analyses were performed using standard methods [19]. Specific proteins were identified using primary antibodies (Supplementary Table 2). Alpha-tubulin was used as the reference protein for the total fraction, and p84 was used as a loading control for the nuclear fraction. Protein bands were detected by enhanced chemiluminescence (Pierce) and quantified using the Multi Gauge image analysis program (version 3.0; Fujifilm, Tokyo, Japan).
Immunofluorescence
For double immunofluorescence, deparaffinized sections were incubated with primary antibodies (Supplementary Table 2) overnight at 4℃. After washing, the sections were incubated with Alexa Fluor 488- or Alexa 594-conjugated donkey anti-rabbit or anti-mouse secondary antibodies (Invitrogen Life Technologies, Carlsbad, CA, USA). Nuclei were counter-stained with DAPI (Invitrogen). Fluorescent images were captured using a BX51-DSU microscope.
RESULTS
Effects of CR on HFD-induced white adipocyte-like phenotype in BAT
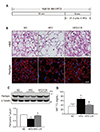
To examine the effect of CR on HFD-induced white adipocyte-like phenotype, we used our established mouse model of CR (Fig. 1A) [18]. Body weight was significantly lower in HFD+CR-treated mice (36.1 ± 0.50) than in HFD-fed mice (54.8 ± 0.93) but was similar to levels observed in ND-fed mice (40.4 ± 0.70). H&E staining showed that CR decreased the number of large unilocular adipocytes in the BAT of HFD-fed mice (Fig. 1B). Using immunofluorescence staining, we observed that the number of large perilipin-positive adipocytes in HFD-fed mice was reduced by CR (Fig. 1B). Western blot analysis also showed that CR increased the reduced expression of perilipin in the BAT of HFD-treated mice (Fig. 1C). In addition, the increase in TG storage in the BAT of HFD-fed mice was attenuated by CR (Fig. 1D).
Effects of CR on LCN2 expression and iron accumulation in the BAT of HFD-fed mice
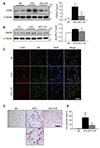
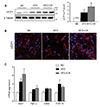
Because LCN2 is upregulated in fat cells in obese rodents and regulates BAT activation [910], we examined the effects of CR on the expression of LCN2 and its receptor (24p3R) in the BAT of HFD-fed mice. HFD induction of LCN2 and 24p3R expression was significantly attenuated by CR (Fig. 2A, B). Consistent with this finding, we found less immunostaining of LCN2-positive neutrophil elastase in the BAT of HFD+CR-fed mice compared with HFD-fed mice (Fig. 2C). Furthermore, because LCN2 is known to facilitate the transport of siderophore-iron complexes into cells [14] and induce oxidative stress [15], we assessed BAT iron accumulation using an iron staining kit. CR reduced the number of iron-positive cells in the BAT of HFD-fed mice (Fig. 2D, E).
Effects of CR on inflammation and oxidative stress in the BAT of HFD-fed mice
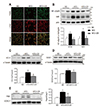
LCN2 is a known regulator of macrophage polarization and NF-κB pathway activation [20]. We observed that the number of infiltrating F4/80-positive macrophages and LCN2-positive neutrophils were higher in the BAT from HFD-fed mice than from ND-fed mice (Fig. 3A). However, there were significantly fewer co-localized LCN2-positive macrophages and neutrophils in HFD+CR-treated mice compared with HFD-fed mice (Fig. 3A). In addition, nuclear NF-κBp65 expression in HFD-fed mice was significantly reduced by CR (Fig. 3B).
Oxidative stress is an important feature of HFD-induced obesity [21]. Nuclear factor erythroid 2-related factor 2 (Nrf2) and heme oxygenase-1 (HO-1) protect against oxidative injury [22], whereas mitochondrial ferritin (FtMt), an iron-storage protein in mitochondria, protects these organelles from iron-induced oxidative stress by sequestering excess free iron [23]. Here, we found that the protein expression levels of Nrf2, HO-1, and superoxide dismutase1 (SOD1) were significantly higher in HFD-fed than ND-fed mice, and that these upregulated levels were significantly attenuated by CR (Fig. 3B–D). Additionally, the expression of FtMt was significantly higher in HFD-fed mice but was normalized by CR (Fig. 3E).
Effects of CR on mitochondrial fission in the BAT of HFD-fed mice
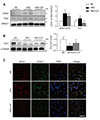
The accumulation of excess lipids in adipocytes is associated with mitochondrial fission [24], and hyperglycemia-induced ROS is associated with dramatic changes in mitochondrial morphology [2526]. CR significantly attenuated the increased expression of dynamin-related protein1 (Drp1) and phosphorylated Drp1 (pDrp1) in HFD-fed mice (Fig. 4A). In addition, decreased cytosolic Drp1 expression in the BAT of HFD-fed mice is reversed by CR (Fig. 4B). Immunofluorescence results showed that CR reduced the number of pDrp1-positive cells in the BAT of HFD-fed mice (Fig. 4C).
Effects of CR on UCP1 expression in the BAT of HFD-fed mice
Because UCP1 activity in adipocytes is associated with mitochondrial fission [24], we investigated the effects of CR on UCP1 expression in the BAT of HFD-fed mice. Unexpectedly, HFD-fed mice subjected to CR had significantly higher UCP1 protein levels than HFD-fed mice (Fig. 5A). In addition, immunofluorescence results showed that a high level of UCP1 immunoreactivity was present in the BAT of HFD+CR-treated mice compared with HFD-fed mice (Fig. 5B). Furthermore, to demonstrate the effects of CR on the browning of the white adipocyte-like phenotype in the BAT of HFD-treated mice, we determined the mRNA expression levels of browning marker genes, such as Ucp1, peroxisome proliferator-activated receptor gamma coactivator 1 alpha (Pgc1α), cell-death-inducing DFFA-like effector A (Cidea), and PR domain-containing 16 (Prdm16) (Fig. 5C). Of interest, a HFD had no effect on the expression of other BAT marker genes except for Ucp1.
DISCUSSION
Numerous studies have established that CR greatly improves insulin sensitivity and thermogenic capacity in obese subjects [2728]. In the present study, mice fed a HFD caused the BAT to exhibit a white adipocyte-like phenotype and manifest higher levels of macrophage infiltration, NF-κB expression, antioxidant enzyme activity, and pDrp1 expression. CR was shown to counter these effects, lowering HFD-induced inflammation, oxidative stress, and mitochondrial fission, but increasing UCP1 levels. Furthermore, CR attenuated HFD-induced LCN2 and 24p3R expression in the BAT of HFD-fed obese mice. Thus, our findings suggest CR prevents BAT dysfunction through multiple mechanisms by reducing inflammation, oxidative stress, and mitochondrial fission in BAT.
Obesity is characterized by ectopic fat accumulation, macrophage infiltration, apoptosis, oxidative stress, and mitochondrial dysfunction in WAT [2930]. A HFD dramatically increases TG storage in lipid droplets in both WAT and BAT. In WAT, catecholamine-stimulated lipolysis liberates fatty acids for use as fuel during HFD feeding. In contrast, lipolysis in BAT provides fatty acids for heat production by adaptive thermogenesis in response to overfeeding or a cold environment [3132]. Perilipin is the predominant lipid droplet coat protein in fat cells and plays an important role in the regulation of lipolysis and thermogenesis [33]. Perilipin-null mice are more susceptible to insulin resistance following HFD feeding [34]; it has been reported that the overexpression of perilipin causes a reduction in lipid droplet size in WAT, resembling a more BAT-like morphology [35]. Consistent with these observations, our present study showed that an increase in adiposity within the BAT of HFD-treated mice is associated with a significant reduction in perilipin expression and an increase in the size of lipid droplets [36]. However, this reduction in perilipin expression in the BAT of HFD-fed mice was largely reversed by CR. Thus, these findings suggest that perilipin may be important for lipid storage, lipolysis, and adaptive thermogenesis in BAT.
Circulating LCN2 levels positively correlate with fat mass and insulin resistance in obese humans and genetically obese mice [37]. Our previous study demonstrated that CR attenuated the increase in serum LCN2 levels in db/db mice [38]. In the present study, we found that CR reversed the HFD-induced increase in LCN2 and 24p3R expression in BAT. These data indicate that the CR-induced reduction in the fat mass of HFD-fed mice may be responsible for the low secretion of LCN2 from adipose tissues. However, other adrenergic-independent mechanisms may be involved in the observed changes in thermogenic function and oxidative stress.
LCN2 induction is activated by the proinflammatory cytokine interleukin-1β, which is induced by the NF-κB pathway [39]. In obesity, the excessive levels of lipids released by adipocytes have been known to promote the recruitment of M1-polarized macrophages in WAT [40]. In this study, we showed that CR significantly reduces the HFD induction of nuclear NF-κBp65 expression and F4/80-positive macrophage infiltration in BAT. These findings are consistent with evidences suggesting that LCN2 promotes inflammation in lipopolysaccharide (LPS)-treated microglia in the brain or tumor necrosis factor-a-induced 3T3-L1 adipocytes or in mice fed with a HFD for 18 weeks [414243]. However, several subsequent studies of Guo et al. reported that LCN2-deficient mice exhibit increased levels of M1 markers in LPS-treated adipose tissue as anti-inflammatory regulators of macrophage activation [9101120]. Thus, these disputes have been ongoing for the role of LCN2 in obesity or inflammatory conditions. We suggest that there are two possible factors to consider that could explain such widely discordant phenotypes. First, there are differences in generating LCN2 deficient mice. Guo et al. [10] used LCN2 knockout (KO) mice, in which exon 2 through 5 were deleted, whereas Law et al. [43] used LCN2 KO mice, in which exon 1 through 6 were deleted. Second, these discrepancies could result from the differences in the doses of LPS or duration of HFD used in animal studies or in the types of cells and tissues examined.
LCN2, an iron transport protein, has been shown to be involved in iron overload-mediated oxidative stress and NF-κB-dependent inflammation in various experimental models of obesity [2039]. Cardiomyocytes, pancreatic β cells, and BAT are all metabolically active tissues that can develop iron-based cellular pathologies [4445]. Specifically, obesity and diabetes are known to be associated with iron overload [45]. Here, we showed that CR is associated with reduction in LCN2 protein expression and iron accumulation in the BAT of HFD-fed obese mice. Iron overload causes oxidative stress and the induction of adaptive antioxidant responses involving Nrf2, HO-1, and SOD1 in the BAT of HFDfed mice. Consistent with the results of previous studies demonstrating that CR can ameliorate obesity-induced oxidative stress [4647], we showed that CR reduces the expression levels of Nrf2 and FtMt, which protect against iron-induced oxidative stress [47]. Iron sequestration by FtMt is likely to be important in countering the toxicity caused by the accumulation of iron associated with chronic HFD feeding. Thus, the increases in iron overload and FtMt expression in BAT may be linked to the protective role of FtMt against iron-induced oxidative stress. Based on these findings, we hypothesize that iron overload-induced oxidative stress may be a key component of the inflammation and mitochondrial dysfunction linked to obesity and diabetes.
In general, obesity is associated with increases in mitochondrial fission, leading to fragmentation, which may be an adaptive cellular response [26]. Pisani et al. [24] recently reported that mitochondrial fission is associated with UCP1 activity in beige adipocytes. The present work is consistent with HFD-induced mitochondrial fission in BAT being associated with physiological adaptive thermogenesis rather than being a deleterious outcome. During HFD feeding, increases in mitochondrial fission provide a greater capacity for oxidation and thermogenesis in BAT, whose activation requires high expression levels of UCP1. These findings are also consistent with previous findings that HFD-induced adaptive thermogenesis in BAT involves the upregulation of UCP1 [3]. Although CR significantly attenuated HFD-induced Drp1 phosphorylation in BAT, HFD-induced upregulation of UCP1 expression was further increased by CR. This finding suggests that this overall decrease in total fat during CR is due, at least in part, to the increased browning of white fat depots in HFD-fed mice [27]. Despite CR resulting in higher UCP1 mRNA and protein levels, the transcriptional levels of other brown fat-specific genes (i.e., Pgc1α, Cidea, and Prdm16) were all unchanged in the BAT of HFD-fed mice, suggesting there were defects in BAT functions. Maybe, these findings indicate that CR could not completely reverse BAT function for metabolic thermogenesis from white adipocyte-like BAT to browning BAT.
In conclusion, this study demonstrated that BAT activation responds to a HFD by regulating metabolic thermogenesis. Furthermore, CR attenuates NF-κB-dependent inflammation, iron overload-mediated oxidative stress, and mitochondrial fission in the BAT of HFD-fed mice. These findings suggest that CR can prevent obesity-associated metabolic disturbances by regulating LCN2-associated inflammation and oxidative stress in BAT.
 XML Download