Journal List > Anat Cell Biol > v.52(2) > 1128959

Praneatpolgrang, Prasitwattanaseree, and Mahakkanukrauh: Age estimation equations using vertebral osteophyte formation in a Thai population: comparison and modified osteophyte scoring method

Abstract

Age estimation from skeletal remains is an important step in forensic biological identification. The main objective of this study is to develop an age estimation equation for the Thai population from vertebral osteophytes. Each vertebra in the cervical, thoracic and lumbar segments was scored for degree of osteophyte formation. Classification was carried out in accordance with the criteria established by Snodgrass and Watanabe, and used a new modified score of the length of vertebral osteophyte for age estimation. The sample included 400 individuals (262 males, 138 females) ranging in age from 22 to 97 years. A sample of Thai vertebral columns was used, the columns being divided into the following groups of vertebrae: cervical (C2–C7), thoracic (T1–T12), and lumbar (L1–L5). Each vertebra was scored for the degree of osteophyte formation and the accumulated data was analyzed statistically. Correlation coefficients and R-squared from mean in lumbar vertebrae for females of criteria established by the method of Snodgrass and Watanabe, the new modified score by length of vertebral osteophytes were 0.801 and 0.642 (P<0.01); 0.755 and 0.57 (P<0.01); 0.786 and 0.618 (P<0.01), respectively. This study presents all 23 subcategories (C2–L5) of the vertebrae to apply in real situations, showing all age estimation equations for males, females and combined sexes of unknown sex. One application of this study is age estimation when dealing with forensic cases in the Thai population.

Introduction

Age estimation from skeletal remains is an important step in forensic biological identification. Biological identification is an important screening process to provide information to prove identity, as a narrowing of estimation of age range in age estimation is crucial. It can save time and is a key factor in cases involving accidents or homicide.
For an estimation of age at death from skeletal remains, methods can be categorized into two main groups: sub-adult and adult. The estimation of adult age mostly relies on the skeletal degenerative processes [1]. Various skeletal parts can be utilized as adult age indicators. These include: cranial sutures of the skull [2], dental wear [3], the sternal end of the first rib [4], and fourth rib [56], the pubic symphysis [7] and auricular surfaces [8] of the pelvis, and histomorphometry of the cortical bone [91011]. In this study the focus of interest is on the vertebral osteophytes. Osteophyte formation on the vertebral column occurs and increases with age, and the development of vertebral osteophytes has been shown to be a general indicator of age [121314], but the use of vertebral osteophytes for age estimation has not been investigated in Thai people. To address this issue, a study of age estimation from vertebral osteophytes in a Thai population was conducted with the main objective of developing an age estimation equation by using vertebral osteophytes for age-at-death estimation of Thais.
A great deal of research has been conducted into adult age estimation, and several methods can be applied using various parts of the human skeleton [234567891011]. Key morphological changes included in these studies were those involving cranial sutures, the pubic symphysis, auricular surface, and the sternal ends of first and fourth ribs [245678]. However, in real situations some bones that are found are barely intact, although some researchers report that in many cases the vertebral column was found to survive even if the limbs and skull had been destroyed by intense burning or by animals [15]. The presence and development of vertebral osteophytes can also be used as an age determination method [15], but reliability of the findings are still in doubt and need additional study.
The degenerative process is a crucial factor in most methods developed for estimating adult age [1]. Vertebral osteophytes have been focused on for their age-related characteristics and can be useful as an age predicting tool [15].
Degenerative change in the intervertebral discs between the vertebral bodies occur as a natural part of aging. This is an important component of osteoarthritis. Joint movement increases with age, as does reduction of such things as cell proteoglycan, collagen fibers and fluid in the intervertebral discs [121617]. The degeneration process begins at the nucleus pulposus with cell loss and matrix alteration [16,17,18]. The most significant biochemical change to occur in disc degeneration is loss of proteoglycan [1617].
Shapiro and Risbud's study is cited [16]:
This loss is responsible for a fall in osmotic pressure and a loss of hydration. The loss of proteoglycan thus has a major effect on the disc's load-bearing behavior due to damage caused by the collapse of the intervertebral disc and surface cartilage of the joint. The instability of the joint responds by increasing bone formation [12]. When calcium mask becomes bone regeneration, osteoarthritis produces vertebral osteophytes. These osteophytes arise from proliferating inner annular fibers which undergo metaplasia into cartilage, which calcify and proceed through an endochondral ossification sequence [16]. Degeneration in the end plate is associated with cell proliferation, cartilage disorganization, and new bone formation [16]. Thus, vertebral osteophytes can be used to estimate the age. With increasing age an increasing prevalence and severity of disc degeneration has been observed. However, an understanding of what constitutes normal progression remains unclear, as many factors can participate and modify the degenerative process. Genetics is one of the components that can alter this normality by accelerating or decelerating the degenerative process. This change is reviewed elsewhere and includes changes in cell function such as expression levels of genes, the stability of mRNA transcripts or proteins, or the binding affinity of protein interacting partners, caused by genetic variations in or near participating genes. In establishing a cohort for genetic study of disc degeneration, the effect of age must be taken into consideration in terms of subject recruitment and data analyses [16].
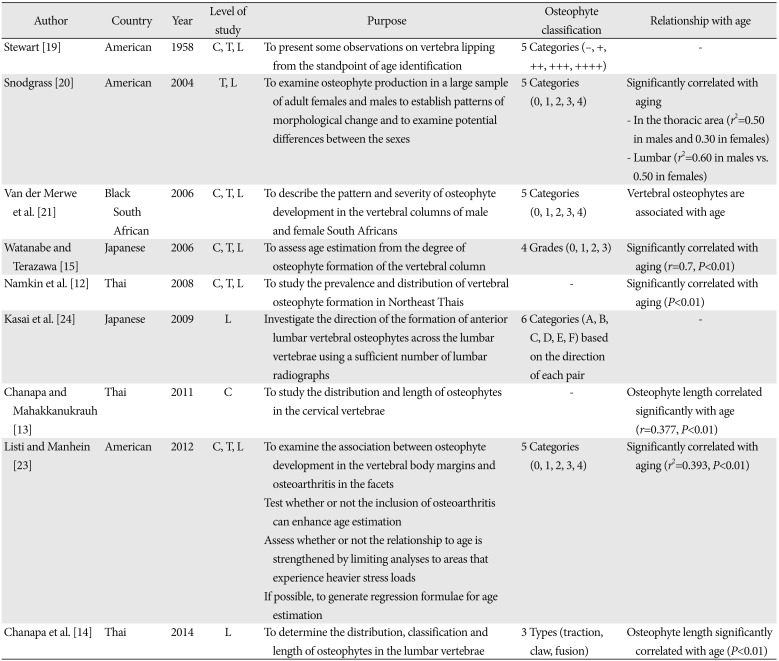
In 1958, Stewart [19] published a paper which presented some observations on vertebra osteophytosis from the standpoint of age identification. The condition of the superior and inferior borders of each vertebral centrum was rated subjectively on a five-point scale running from 0 (no lipping) to 4 (maximum lipping) [19]. Later, researchers such as Snodgrass [20], Van Der Merwe et al. [21], Kim et al. [22], and Listi and Manhein [23] applied this concept to the study of the osteophyte formation. Later studies in Thailand, on the prevalence of vertebral osteophyte formation were conducted by researchers such as Namking et al. [12] and Chanapa and collegues [1314]. All of the above mentioned corresponding findings, specifically those related to the formation of osteophytes and age showed a correlation that was statistically significant, but there was still no relationship available for use in age estimation. However, in 2006 Watanabe and Terazawa [15] defined new grading scores for osteophyte formation. These included four grades, 0, 1, 2, and 3, based on the height of spur, lipping, and bridging at the superior and inferior margins of the cervical, thoracic, and lumbar vertebral bodies. The grading was obtained from the inspection and palpation of 225 bodies during autopsy. The average maximum values of the cervical, thoracic, and lumbar parts, respectively, were defined as the “osteophyte formation index” in each individual and statistical analysis of the integrated data was used to estimate age [15]. This method was thus accepted as a useful tool in estimating age at death [15].
The current study is based on the scoring method concept only from Snodgrass [20] and Watanabe and Terazawa [15], but different methods for data collection and data analysis include the following:
The Snodgrass study (2004) is cited [20]:
Each vertebra in the thoracic and lumbar segments of the vertebral column was scored for osteophytosis. This five-stage classification system assesses the stage of osteophytosis separately for each of the superior and inferior surface margins of the vertebral centra. Osteophytes were scored when located on the anterior or lateral regions of the vertebral centra. For each vertebral region a mean score was calculated and a total osteophyte score was calculated by combining the scores of the thoracic and lumbar regions. These scores were calculated by summing the degree of lipping for the superior and inferior margins of the vertebral centra and dividing by the number of vertebral surfaces present in each region (i.e., 24 for the thoracic region and 10 for the lumbar region) [20].
The Watanabe and Terazawa's study (2006) is cited [15]:
Evaluated it by inspection and palpation of front surfaces of the cervical, thoracic, and lumbar parts of vertebrae, and bilateral surfaces of the thoracic part, using the previously measured finger's width as a standard indicator. The largest value in each part was used for analysis. And the average of the maximum values, respectively, at cervical, thoracic, and lumbar parts was defined as ‘osteophyte formation index’ in each individual. The degree of osteophyte formation was based on the height of the process of the vertebral column, which represents spur, lipping, and bridging of osteophyte formation at the superior and inferior margins of the vertebral bodies [15].
Watanabe and Terazawa's study (2006) [15] used the length of the osteophyte at 0.8 cm as a cut-off point, using a finger-width measurement; the current study could not determine why Watanabe decided on this, but in this study (2019) the length was recorded by digital vernier caliper and measuring tape.
In the current study, all vertebrae (C2–L5) were evaluated for the presence and stage of formation of osteophytes, and the maximum expression was recorded. This staged classification system was used to assess the stage of osteophyte formation of the superior and inferior margins of the vertebral body based on Snodgrass (five-stage classification), Watanabe (four-stage classification), and a new modified score by the length of the vertebral osteophyte (six-stage classification). All scoring methods in all 3 methods have been collected and analyzed according to this study, which is different from previous studies (Snodgrass [20] and Watanabe and Terazawa [15]). Mean osteophyte scores were recorded for the entire column and also for each subcategory of vertebrae using a digital vernier caliper and measuring tape. The scores were calculated by dividing the sum of the scores by the total number of vertebrae examined. For example, the mean lumbar osteophyte score was the sum score of all vertebrae divided by 5 (i.e., 6 for the cervical region, 12 for the thoracic region, and 5 for the lumbar region).
This study used a scoring method based on Snodgrass [20] and Watanabe and Terazawa [15]. The two previous scoring methods are used because both of these methods have been published and used for estimating age. As well, they're easy, fast and inexpensive. Earlier studies have provided a wide variety of scoring methods, but there are no studies that can be used to estimate an age equation. Previously, Stewart [19] invented a pattern for the scoring of osteophytes. There are many references to Stewart [20212223] including Snodgrass; however, the reason why this study makes reference to Snodgrass is because they included clearer descriptions and more pictures than the other studies. Additionally, Watanabe's method is a study that was able to produce equations of age and newly defined grading scores in osteophyte formation.

Materials and Methods

This study used vertebral columns from a Thai sample which included cervical (C2–C7), thoracic (T1–T12), and lumbar (L1–L5) vertebrae from 400 individuals (262 males, 138 females) of known sex and age at death from the Forensic Osteology Research Center (FORC), Faculty of Medicine, Chiang Mai University. Ages ranged between 22 and 97 years. The reference sample consisted of Thai individuals who were born between 1913 and 1995.
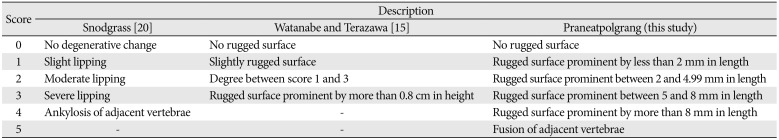
Individuals with atypical numbers of vertebrae and evidence of vertebral damage were excluded from the study. Each vertebra in the cervical, thoracic and lumbar segments were scored for degree of osteophyte formation according to criteria established by Snodgrass [20] (five-stage classification), Watanabe and Terazawa [15] (four-stage classification), and the new modified score by length of vertebral osteophyte (six-stage classification) (Table 1).
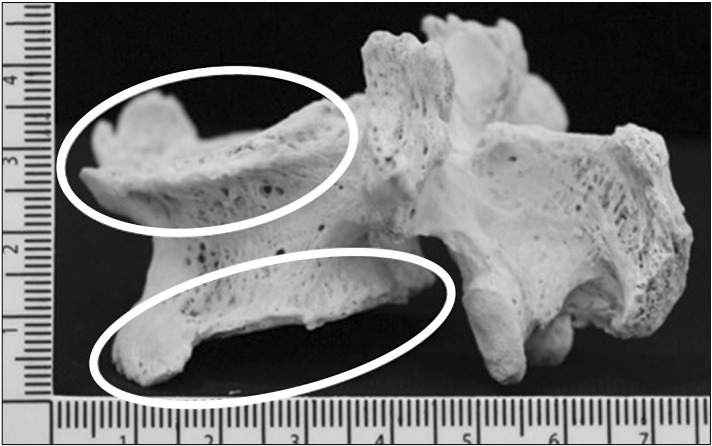
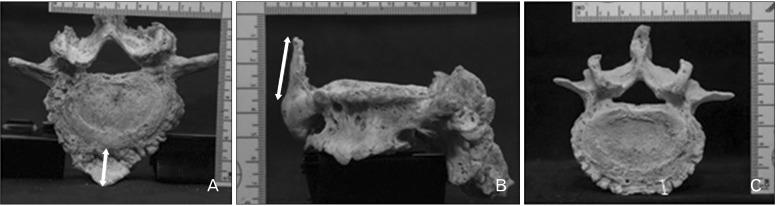
From each individual, all vertebrae were evaluated for presence and stage of osteophyte formation; however, the atlas was not considered in the assessment of osteophytes due to the lack of body in the atlas. This staged classification system was used to assess the stage of osteophyte formation of the superior and inferior margins of the vertebral body (Fig. 1) by evaluating the scores, ranging from no osteophyte to maximum osteophyte. Osteophyte expression can vary considerably within each vertebra, the maximum expression was the one recorded (Fig. 2). Mean osteophyte scores were recorded for the entire column and also for each subcategory of vertebrae. These scores were calculated by dividing the sum of the scores by the total number of vertebrae examined. For example, the mean lumbar osteophyte score was the sum score of all vertebrae divided by 5 (i.e., 6 for the cervical region, 12 for the thoracic region, and 5 for the lumbar region).
In the statistical tests using descriptive statistics including medians, means, standard deviations, Pearson's correlation test, and Linear regression analysis, we defined P<0.05 significant. All statistical analyses were performed using the SPSS software package (SPSS for Windows, version 20, IBM Corp., Armonk, NY, USA). Statistical analysis was carried out to discover the correlation between the degree of osteophyte formation and age. The following were statistically obtained for each sex: correlation coefficient, regression equation, standard error of estimate between age and degree of osteophyte formation in each vertebra and vertebral column segment.

Results

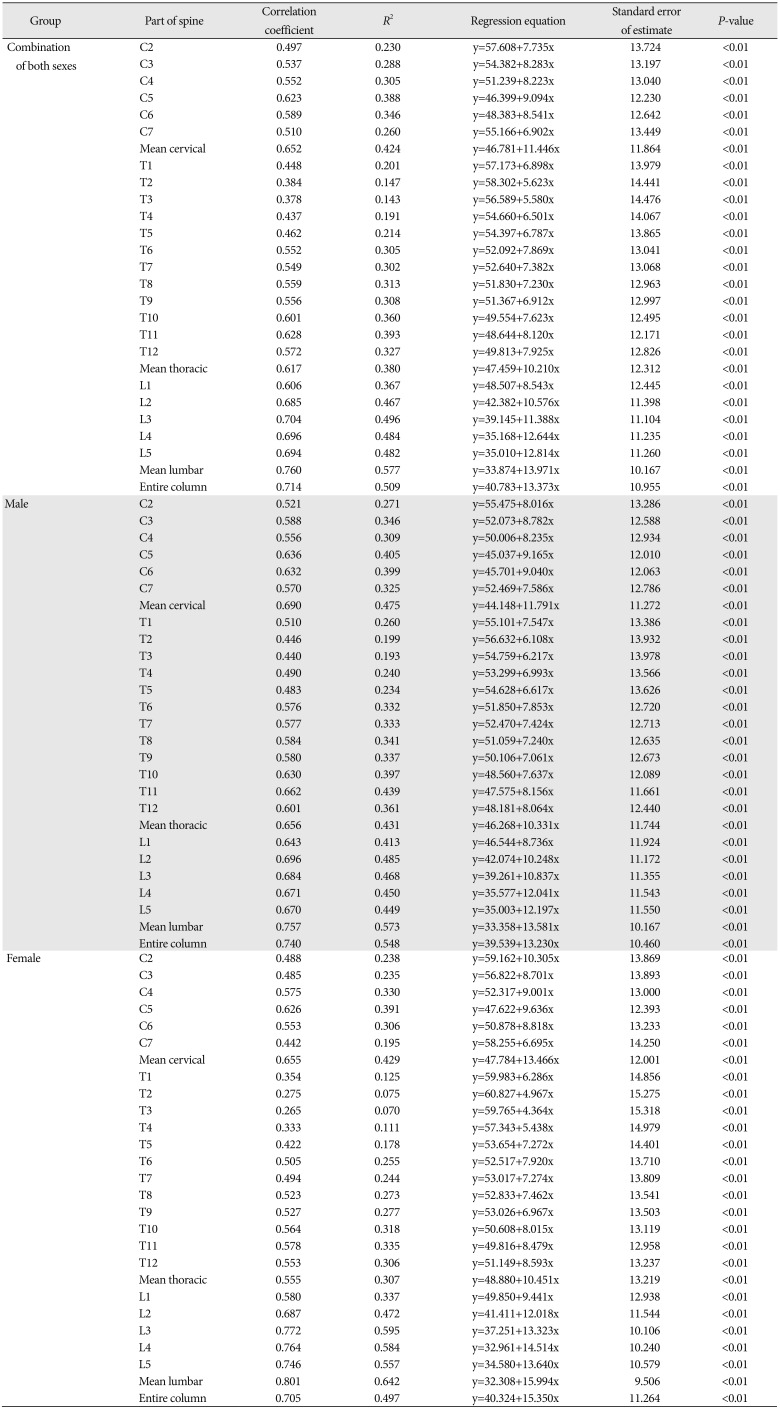
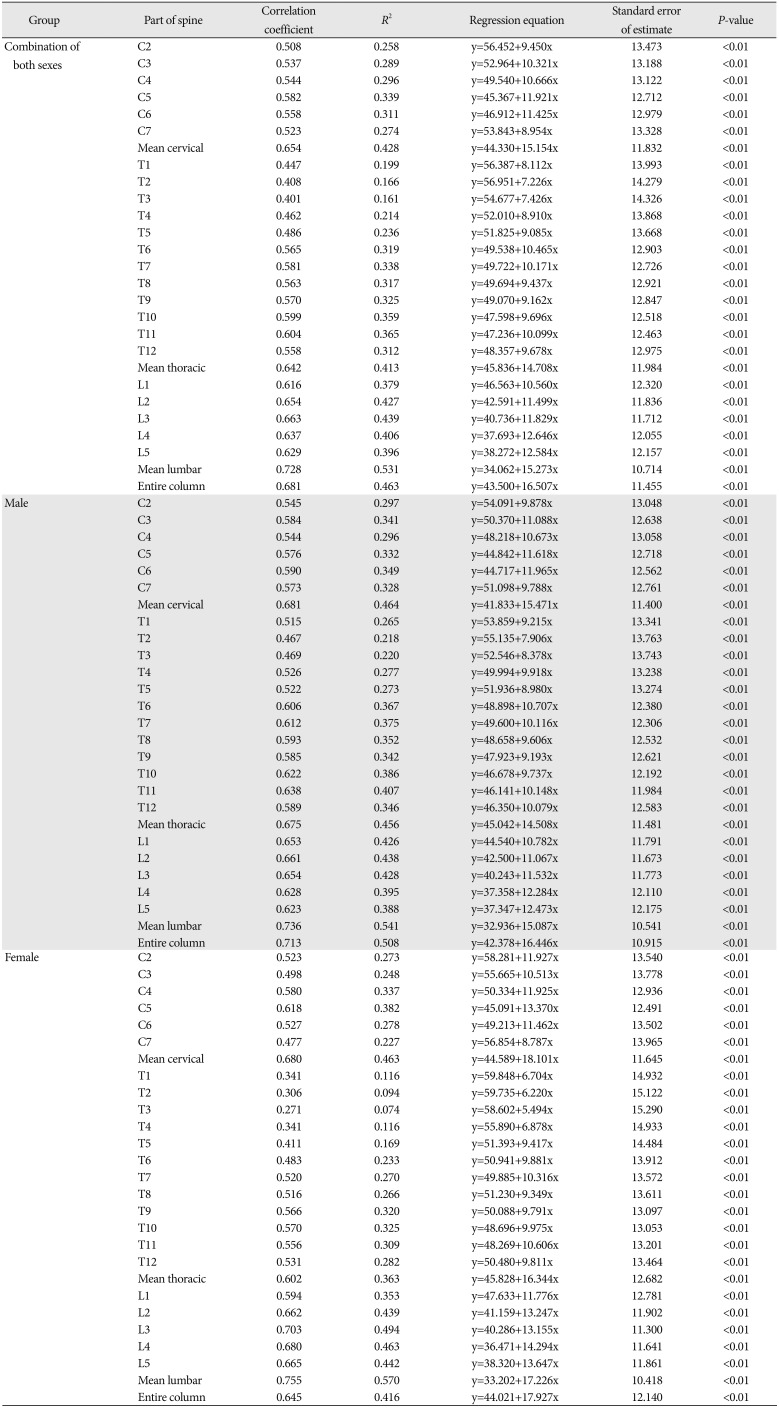
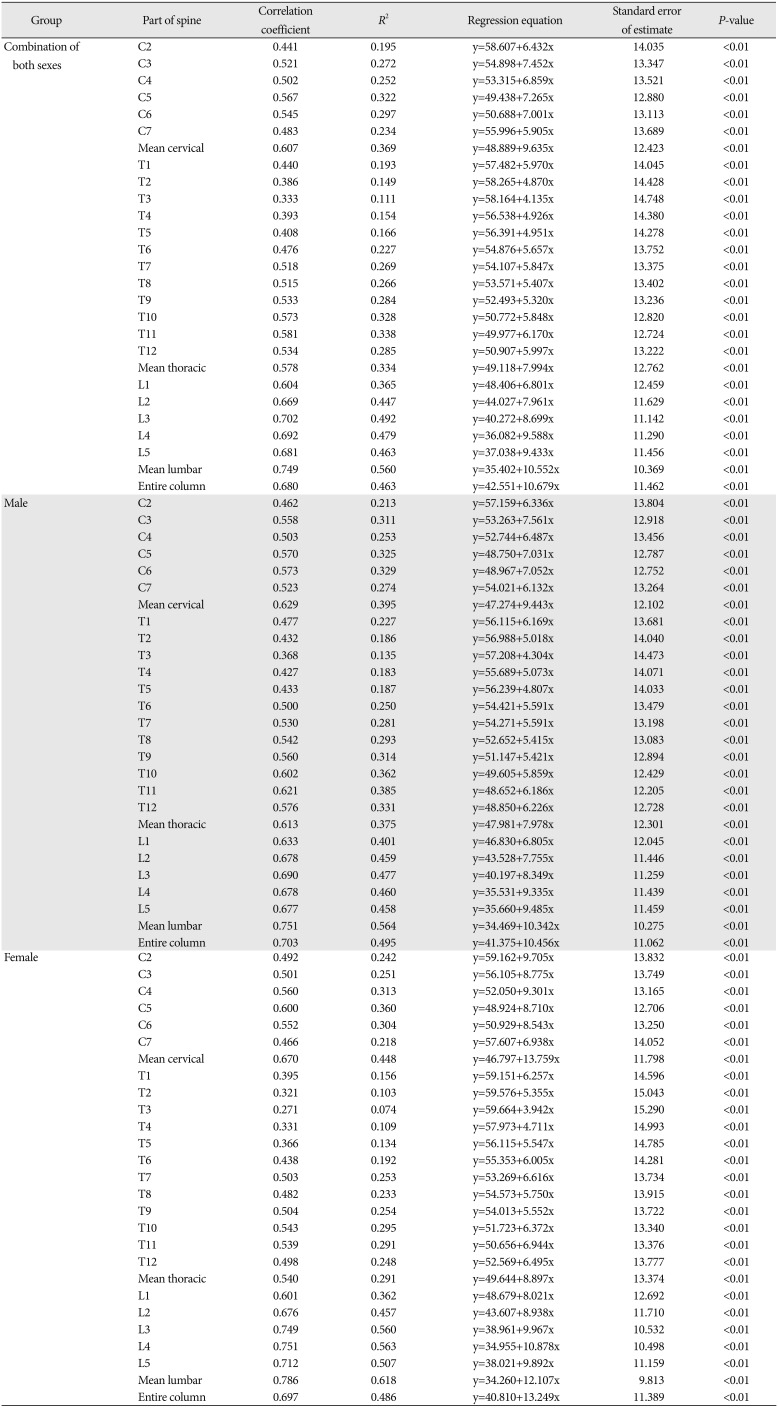
For a combination of both sexes, the mean age and standard deviation were 66.02 and 15.619 years, respectively. There were no significant differences in the mean age of the subjects between males (mean±SD, 65.82±15.534 years) and females (66.41±15.827 years) (P>0.05, Student's t-test). In all parts of the vertebral column, there was a significant correlation between the score value and the age. The following were statistically obtained for the sexes combined and each sex separately: correlation coefficient, regression equation, standard error of estimate (SE) between the score at each segment of the vertebral column and age, and between the mean in each segment of vertebrae and age. Regression lines of criteria established by Snodgrass (five-stage classification) were y=33.874+13.971x (SE, 10.167), y=33.358+13.581x (SE, 10.167), and y=32.308+15.994x (SE, 9.506) in mean lumbar area for combined sexes, males, and females, respectively (Table 2). Regression lines of criteria established by Watanabe and Terazawa (four-stage classification) were y=34.062+15.273x (SE, 10.714), y=32.936+15.087x (SE, 10.541), and y=33.202+17.226x (SE, 10.418) in mean lumbar are for combined sexes, males, and females, respectively (Table 3). Regression lines of criteria established by new modified score by length of vertebral osteophyte (this stydy) (six-stage classification) were y=35.402+10.552x (SE, 10.369), y=34.469+10.342x (SE, 10.275), and y=34.260+12.107x (SE, 9.813) in mean lumbar area for combined sexes, males, and females, respectively (Table 4).
Correlation coefficients of criteria established by the method of Snodgrass [14] were as follows: 0.378<r<0.76, P<0.01; 0.44<r<0.757, P<0.01; and 0.265<r<0.801, P<0.01 for a combination of the sexes, males, and females, respectively. Correlation coefficients of criteria established by the method of Watanabe and colleagues were as follows: 0.401<r<0.728, P<0.01; 0.467<r<0.736, P<0.01; and 0.271<r<0.755, P<0.01 for a combination of the sexes, males, and females, respectively. Correlation coefficients of criteria established by the method of Praneatpolgrang and colleagues were as follows: 0.333<r<0.749, P<0.01; 0.368<r<0.751, P<0.01; and 0.271<r<0.786, P<0.01 for a combination of the sexes, males, and females, respectively.

Discussion

In the past there have been several studies into vertebral osteophyte formation (Table 5). Many researchers have reported many corresponding findings [121314151920212324] on osteophyte formation and age, showing statistically significant correlations. But no relationship had been published for its use in age estimation until Watanabe and Terazawa [15] and Listi and Manhein [23] tried to conduct research into age estimation in relation to osteophyte formation. Watanabe went on to create an equation to estimate the age [15].
The current study used a scoring method based on Snodgrass [20] and Watanabe and Terazawa [15]. The two previous scoring methods are used because both of these methods have been published for use in estimating age. Earlier studies have provided a wide variety of scoring methods. But there are no studies that can be used to estimate an age equation.
Watanabe was a study that could produce an equations for age. It was a new method of scoring based on the height of the osteophyte, but the range is still wide.
This study presents all 23 subcategories (C2–L5) of the vertebrae and shows all three scoring methods of the different processes from previous studies for age estimation equations for males, females and combined sexes of unknown sex, in order to be useful to readers and be applied in real situations. Also, these findings need to be used in accordance with the situations that occur around skeletal remains in order to help identity them.
In this study, analysis of the scoring for the degree of osteophyte formation using the three different criteria (Snodgrass, Watanabe, and Praneatpolgrang [this study]) resulted in no difference between the correlation coefficients. In comparing the correlation coefficient and R2 values of the three scoring methods (Snodgrass, Watanabe, and Praneatpolgrang), we attempted to find out which of the three ways was best. The results indicate that all three ways are similar, showing that the three scores for degree of osteophyte formation in females was not significantly different and had a correlation coefficient of 0.801 (Table 2) using the Snodgrass [20] (five-stage classification) criteria. Snodgrass' scoring criteria was better than the other two scoring criteria (correlation coefficients of Snodgrass criteria were 0.76, 0.757, and 0.801 for a combination of the sexes, males, and females, respectively). This study used a new modified score by the length of vertebral osteophyte (Tables 1, 4). The new modified score measurement is more objective than the others because it provides a more frequent scoring range, which is clearer by the length of the osteophyte and makes the scoring faster by using a digital vernier caliper and measuring tape, which can be seen clearly and more objectively. Correlation coefficients of the Praneatpolgrang criteria were as follows: 0.749, 0.751, and 0.786 for a combination of the sexes, males, and females, respectively, and correlation coefficients of Praneatpolgrang's scoring criteria were considered to have high correlation [25]. All three scoring methods could be practically used because they had relatively high correlation with age [25].
The advantage of this research is that all three scoring criteria of different processes from previous studies for age estimation equations for males, females, and combined sexes are simple, easy to use, inexpensive and fast methods for estimating the age of a skeleton. Snodgrass' study (2004) [20] cannot create an age estimation equation, possibly due to a different process. The current study's preliminary results show the possibility of using vertebral osteophytes for age-at-death estimation in the Thai population.
The entire spinal columns and each subcategory of vertebrae were scored for the degree of osteophyte formation according to criteria established by Snodgrass [20] (five-stage classification), Watanabe and Terazawa [15] (four-stage classification), and the new modified score using the length of vertebral osteophyte method (this study) (six-stage classification). The report includes all age equations for an entire column and each subcategory of vertebrae (Tables 2, 3, 4) for three criteria of scores to determine the degree of osteophyte formation. Some sections showed a low correlation but the authors see that as a useful finding for further investigation. Also these findings need to be used in accordance with the situation that occurs around each skeletal remains in order to help identity them. This includes cases where all vertebrae are found, in which case the highest correlation coefficient and R2 values should be sought. If only a few vertebrae are discovered this method should probably not be used.
The current study has been developed for three scoring methods and providesa more frequent scoring range using Praneatpolgrang's scoring. The new modified score measurement is clearer by the length of the osteophyte. It uses a larger reference sample from 400 individuals. This study can add weight to the findings from investigations of age estimation in the Thai population and can be useful in the field when dealing with forensic cases.

Acknowledgements

The authors wish to express their gratitude to the Faculty of Medicine, Chiang Mai University (Grant number: PHD/125/2561) for their support of this project, and to the Forensic Osteology Research Center for granting access to their human skeleton collection. The author would like to express my sincere appreciation to Assoc. Prof. Karnda Mekjaidee, MD for her advice and guidance on forensic context. She is a physician and a forensic expert at the Department of Forensic Medicine, Faculty of Medicine, Chiang Mai University.

References

1. Uhl NM. Age-at-death estimation. In : DiGangi EA, Moore MK, editors. Research Methods in Human Skeletal Biology. Waltham, MA: Academic Press;2013. p. 63–90.
2. Meindl RS, Lovejoy CO. Ectocranial suture closure: a revised method for the determination of skeletal age at death based on the lateral-anterior sutures. Am J Phys Anthropol. 1985; 68:57–66. PMID: 4061602.
3. İşcan MY. Age markers in the human skeleton. Springfield, IL: Charles C Thomas;1989.
4. DiGangi EA, Bethard JD, Kimmerle EH, Konigsberg LW. A new method for estimating age-at-death from the first rib. Am J Phys Anthropol. 2009; 138:164–176. PMID: 18711740.
5. Işcan MY, Loth SR, Wright RK. Metamorphosis at the sternal rib end: a new method to estimate age at death in white males. Am J Phys Anthropol. 1984; 65:147–156. PMID: 6507605.
6. Işcan MY, Loth SR, Wright RK. Age estimation from the rib by phase analysis: white females. J Forensic Sci. 1985; 30:853–863. PMID: 4031812.
7. Brooks S, Suchey JM. Skeletal age determination based on the os pubis: a comparison of the Acsádi-Nemeskéri and Suchey-Brooks methods. Hum Evol. 1990; 5:227–238.
8. Lovejoy CO, Meindl RS, Pryzbeck TR, Mensforth RP. Chronological metamorphosis of the auricular surface of the ilium: a new method for the determination of adult skeletal age at death. Am J Phys Anthropol. 1985; 68:15–28. PMID: 4061599.
9. Yoshino M, Imaizumi K, Miyasaka S, Seta S. Histological estimation of age at death using microradiographs of humeral compact bone. Forensic Sci Int. 1994; 64:191–198. PMID: 8175091.
10. Keough N, L'Abbé EN, Steyn M. The evaluation of age-related histomorphometric variables in a cadaver sample of lower socioeconomic status: implications for estimating age at death. Forensic Sci Int. 2009; 191:114.e1–114.e6. PMID: 19679414.
11. Castillo RF, Ubelaker DH, Djorojevic M. Age estimation through histological study of trabecular volume and cortical bone width of the iliac crest. Sci Justice. 2012; 52:177–180. PMID: 22841141.
12. Namking M, Buranarugsa M, Jeeravipoolvarn P, Deesart M. The prevalence of vertebral osteophyte formation in Northeast Thais. Srinagarind Med J. 2008; 23:81–92.
13. Chanapa P, Mahakkanukrauh P. Locations and lengths of osteophytes in the cervical vertebrae. Rev Arg Anat Clin. 2011; 3:15–21.
14. Chanapa P, Yoshiyuki T, Mahakkanukrauh P. Distribution and length of osteophytes in the lumbar vertebrae and risk of rupture of abdominal aortic aneurysms: a study of dry bones from Chiang Mai, Thailand. Anat Cell Biol. 2014; 47:157–161. PMID: 25276474.
15. Watanabe S, Terazawa K. Age estimation from the degree of osteophyte formation of vertebral columns in Japanese. Leg Med (Tokyo). 2006; 8:156–160. PMID: 16621650.
16. Shapiro IM, Risbud MV. The intervertebral disc: molecular and structural studies of the disc in health and disease. Wien: Springer-Verlag;2014.
17. Belavy DL, Bansmann PM, Bohme G, Frings-Meuthen P, Heer M, Rittweger J, Zange J, Felsenberg D. Changes in intervertebral disc morphology persist 5 mo after 21-day bed rest. J Appl Physiol (1985). 2011; 111:1304–1314. PMID: 21799122.
18. Naderi S, Acar F, Mertol T, Arda MN. Functional anatomy of the spine by Avicenna in his eleventh century treatise Al-Qanun fi al-Tibb (The Canons of Medicine). Neurosurgery. 2003; 52:1449–1453. PMID: 12762890.
19. Stewart TD. Rate of development of vertebral osteoarthritis in American whites and its significance in skeletal age identification. Leech. 1958; 28:144–151.
20. Snodgrass JJ. Sex differences and aging of the vertebral column. J Forensic Sci. 2004; 49:458–463. PMID: 15171159.
21. Van Der Merwe AE, Işcan MY, L'Abbè EN. The pattern of vertebral osteophyte development in a South African population. Int J Osteoarchaeol. 2006; 16:459–464.
22. Kim DK, Kim MJ, Kim YS, Oh CS, Shin DH. Vertebral osteophyte of pre-modern Korean skeletons from Joseon tombs. Anat Cell Biol. 2012; 45:274–281. PMID: 23301195.
23. Listi GA, Manhein MH. The use of vertebral osteoarthritis and osteophytosis in age estimation. J Forensic Sci. 2012; 57:1537–1540. PMID: 22486633.
24. Kasai Y, Kawakita E, Sakakibara T, Akeda K, Uchida A. Direction of the formation of anterior lumbar vertebral osteophytes. BMC Musculoskelet Disord. 2009; 10:4. PMID: 19144120.
25. Mukaka MM. Statistics corner: a guide to appropriate use of correlation coefficient in medical research. Malawi Med J. 2012; 24:69–71. PMID: 23638278.
Fig. 1

Position of osteophyte formation at the superior and inferior margins of the vertebral body.

acb-52-149-g001
Fig. 2

Praneatpolgrang scoring method. Osteophyte expression can vary considerably within each vertebra, the maximum expression was recorded. Measurement of the length (mm) in the maximum expression by the new modified score by length of vertebral osteophytes: 0, no rugged surface; 1, rugged surface prominent by less than 2 mm in length; 2, rugged surface prominent between 2 and 4.99 mm in length; 3, rugged surface prominent between 5 and 8 mm in length; 4, rugged surface prominent by more than 8 mm in length; and 5, fusion of adjacent vertebrae. Images represent maximum length in the oblique direction (A), vertical direction (B), and horizontal direction (C), respectively.

acb-52-149-g002
Table 1

Degree of osteophyte formation based on Snodgrass, Watanabe, and Praneatpolgrang

acb-52-149-i001
Score Description
Snodgrass [20] Watanabe and Terazawa [15] Praneatpolgrang (this study)
0 No degenerative change No rugged surface No rugged surface
1 Slight lipping Slightly rugged surface Rugged surface prominent by less than 2 mm in length
2 Moderate lipping Degree between score 1 and 3 Rugged surface prominent between 2 and 4.99 mm in length
3 Severe lipping Rugged surface prominent by more than 0.8 cm in height Rugged surface prominent between 5 and 8 mm in length
4 Ankylosis of adjacent vertebrae - Rugged surface prominent by more than 8 mm in length
5 - - Fusion of adjacent vertebrae
Table 2

Statistical data for age (y) estimation equation from vertebral osteophytes (x) using criteria established by Snodgrass (five-stage classification) [20]

acb-52-149-i002
Group Part of spine Correlation coefficient R2 Regression equation Standard error of estimate P-value
Combination of both sexes C2 0.497 0.230 y=57.608+7.735x 13.724 <0.01
C3 0.537 0.288 y=54.382+8.283x 13.197 <0.01
C4 0.552 0.305 y=51.239+8.223x 13.040 <0.01
C5 0.623 0.388 y=46.399+9.094x 12.230 <0.01
C6 0.589 0.346 y=48.383+8.541x 12.642 <0.01
C7 0.510 0.260 y=55.166+6.902x 13.449 <0.01
Mean cervical 0.652 0.424 y=46.781+11.446x 11.864 <0.01
T1 0.448 0.201 y=57.173+6.898x 13.979 <0.01
T2 0.384 0.147 y=58.302+5.623x 14.441 <0.01
T3 0.378 0.143 y=56.589+5.580x 14.476 <0.01
T4 0.437 0.191 y=54.660+6.501x 14.067 <0.01
T5 0.462 0.214 y=54.397+6.787x 13.865 <0.01
T6 0.552 0.305 y=52.092+7.869x 13.041 <0.01
T7 0.549 0.302 y=52.640+7.382x 13.068 <0.01
T8 0.559 0.313 y=51.830+7.230x 12.963 <0.01
T9 0.556 0.308 y=51.367+6.912x 12.997 <0.01
T10 0.601 0.360 y=49.554+7.623x 12.495 <0.01
T11 0.628 0.393 y=48.644+8.120x 12.171 <0.01
T12 0.572 0.327 y=49.813+7.925x 12.826 <0.01
Mean thoracic 0.617 0.380 y=47.459+10.210x 12.312 <0.01
L1 0.606 0.367 y=48.507+8.543x 12.445 <0.01
L2 0.685 0.467 y=42.382+10.576x 11.398 <0.01
L3 0.704 0.496 y=39.145+11.388x 11.104 <0.01
L4 0.696 0.484 y=35.168+12.644x 11.235 <0.01
L5 0.694 0.482 y=35.010+12.814x 11.260 <0.01
Mean lumbar 0.760 0.577 y=33.874+13.971x 10.167 <0.01
Entire column 0.714 0.509 y=40.783+13.373x 10.955 <0.01
Male C2 0.521 0.271 y=55.475+8.016x 13.286 <0.01
C3 0.588 0.346 y=52.073+8.782x 12.588 <0.01
C4 0.556 0.309 y=50.006+8.235x 12.934 <0.01
C5 0.636 0.405 y=45.037+9.165x 12.010 <0.01
C6 0.632 0.399 y=45.701+9.040x 12.063 <0.01
C7 0.570 0.325 y=52.469+7.586x 12.786 <0.01
Mean cervical 0.690 0.475 y=44.148+11.791x 11.272 <0.01
T1 0.510 0.260 y=55.101+7.547x 13.386 <0.01
T2 0.446 0.199 y=56.632+6.108x 13.932 <0.01
T3 0.440 0.193 y=54.759+6.217x 13.978 <0.01
T4 0.490 0.240 y=53.299+6.993x 13.566 <0.01
T5 0.483 0.234 y=54.628+6.617x 13.626 <0.01
T6 0.576 0.332 y=51.850+7.853x 12.720 <0.01
T7 0.577 0.333 y=52.470+7.424x 12.713 <0.01
T8 0.584 0.341 y=51.059+7.240x 12.635 <0.01
T9 0.580 0.337 y=50.106+7.061x 12.673 <0.01
T10 0.630 0.397 y=48.560+7.637x 12.089 <0.01
T11 0.662 0.439 y=47.575+8.156x 11.661 <0.01
T12 0.601 0.361 y=48.181+8.064x 12.440 <0.01
Mean thoracic 0.656 0.431 y=46.268+10.331x 11.744 <0.01
L1 0.643 0.413 y=46.544+8.736x 11.924 <0.01
L2 0.696 0.485 y=42.074+10.248x 11.172 <0.01
L3 0.684 0.468 y=39.261+10.837x 11.355 <0.01
L4 0.671 0.450 y=35.577+12.041x 11.543 <0.01
L5 0.670 0.449 y=35.003+12.197x 11.550 <0.01
Mean lumbar 0.757 0.573 y=33.358+13.581x 10.167 <0.01
Entire column 0.740 0.548 y=39.539+13.230x 10.460 <0.01
Female C2 0.488 0.238 y=59.162+10.305x 13.869 <0.01
C3 0.485 0.235 y=56.822+8.701x 13.893 <0.01
C4 0.575 0.330 y=52.317+9.001x 13.000 <0.01
C5 0.626 0.391 y=47.622+9.636x 12.393 <0.01
C6 0.553 0.306 y=50.878+8.818x 13.233 <0.01
C7 0.442 0.195 y=58.255+6.695x 14.250 <0.01
Mean cervical 0.655 0.429 y=47.784+13.466x 12.001 <0.01
T1 0.354 0.125 y=59.983+6.286x 14.856 <0.01
T2 0.275 0.075 y=60.827+4.967x 15.275 <0.01
T3 0.265 0.070 y=59.765+4.364x 15.318 <0.01
T4 0.333 0.111 y=57.343+5.438x 14.979 <0.01
T5 0.422 0.178 y=53.654+7.272x 14.401 <0.01
T6 0.505 0.255 y=52.517+7.920x 13.710 <0.01
T7 0.494 0.244 y=53.017+7.274x 13.809 <0.01
T8 0.523 0.273 y=52.833+7.462x 13.541 <0.01
T9 0.527 0.277 y=53.026+6.967x 13.503 <0.01
T10 0.564 0.318 y=50.608+8.015x 13.119 <0.01
T11 0.578 0.335 y=49.816+8.479x 12.958 <0.01
T12 0.553 0.306 y=51.149+8.593x 13.237 <0.01
Mean thoracic 0.555 0.307 y=48.880+10.451x 13.219 <0.01
L1 0.580 0.337 y=49.850+9.441x 12.938 <0.01
L2 0.687 0.472 y=41.411+12.018x 11.544 <0.01
L3 0.772 0.595 y=37.251+13.323x 10.106 <0.01
L4 0.764 0.584 y=32.961+14.514x 10.240 <0.01
L5 0.746 0.557 y=34.580+13.640x 10.579 <0.01
Mean lumbar 0.801 0.642 y=32.308+15.994x 9.506 <0.01
Entire column 0.705 0.497 y=40.324+15.350x 11.264 <0.01
Table 3

Statistical data for age (y) estimation equation from vertebral osteophytes (x) using criteria established by Watanabe and Terazawa (four-stage classification) [15]

acb-52-149-i003
Group Part of spine Correlation coefficient R2 Regression equation Standard error of estimate P-value
Combination of both sexes C2 0.508 0.258 y=56.452+9.450x 13.473 <0.01
C3 0.537 0.289 y=52.964+10.321x 13.188 <0.01
C4 0.544 0.296 y=49.540+10.666x 13.122 <0.01
C5 0.582 0.339 y=45.367+11.921x 12.712 <0.01
C6 0.558 0.311 y=46.912+11.425x 12.979 <0.01
C7 0.523 0.274 y=53.843+8.954x 13.328 <0.01
Mean cervical 0.654 0.428 y=44.330+15.154x 11.832 <0.01
T1 0.447 0.199 y=56.387+8.112x 13.993 <0.01
T2 0.408 0.166 y=56.951+7.226x 14.279 <0.01
T3 0.401 0.161 y=54.677+7.426x 14.326 <0.01
T4 0.462 0.214 y=52.010+8.910x 13.868 <0.01
T5 0.486 0.236 y=51.825+9.085x 13.668 <0.01
T6 0.565 0.319 y=49.538+10.465x 12.903 <0.01
T7 0.581 0.338 y=49.722+10.171x 12.726 <0.01
T8 0.563 0.317 y=49.694+9.437x 12.921 <0.01
T9 0.570 0.325 y=49.070+9.162x 12.847 <0.01
T10 0.599 0.359 y=47.598+9.696x 12.518 <0.01
T11 0.604 0.365 y=47.236+10.099x 12.463 <0.01
T12 0.558 0.312 y=48.357+9.678x 12.975 <0.01
Mean thoracic 0.642 0.413 y=45.836+14.708x 11.984 <0.01
L1 0.616 0.379 y=46.563+10.560x 12.320 <0.01
L2 0.654 0.427 y=42.591+11.499x 11.836 <0.01
L3 0.663 0.439 y=40.736+11.829x 11.712 <0.01
L4 0.637 0.406 y=37.693+12.646x 12.055 <0.01
L5 0.629 0.396 y=38.272+12.584x 12.157 <0.01
Mean lumbar 0.728 0.531 y=34.062+15.273x 10.714 <0.01
Entire column 0.681 0.463 y=43.500+16.507x 11.455 <0.01
Male C2 0.545 0.297 y=54.091+9.878x 13.048 <0.01
C3 0.584 0.341 y=50.370+11.088x 12.638 <0.01
C4 0.544 0.296 y=48.218+10.673x 13.058 <0.01
C5 0.576 0.332 y=44.842+11.618x 12.718 <0.01
C6 0.590 0.349 y=44.717+11.965x 12.562 <0.01
C7 0.573 0.328 y=51.098+9.788x 12.761 <0.01
Mean cervical 0.681 0.464 y=41.833+15.471x 11.400 <0.01
T1 0.515 0.265 y=53.859+9.215x 13.341 <0.01
T2 0.467 0.218 y=55.135+7.906x 13.763 <0.01
T3 0.469 0.220 y=52.546+8.378x 13.743 <0.01
T4 0.526 0.277 y=49.994+9.918x 13.238 <0.01
T5 0.522 0.273 y=51.936+8.980x 13.274 <0.01
T6 0.606 0.367 y=48.898+10.707x 12.380 <0.01
T7 0.612 0.375 y=49.600+10.116x 12.306 <0.01
T8 0.593 0.352 y=48.658+9.606x 12.532 <0.01
T9 0.585 0.342 y=47.923+9.193x 12.621 <0.01
T10 0.622 0.386 y=46.678+9.737x 12.192 <0.01
T11 0.638 0.407 y=46.141+10.148x 11.984 <0.01
T12 0.589 0.346 y=46.350+10.079x 12.583 <0.01
Mean thoracic 0.675 0.456 y=45.042+14.508x 11.481 <0.01
L1 0.653 0.426 y=44.540+10.782x 11.791 <0.01
L2 0.661 0.438 y=42.500+11.067x 11.673 <0.01
L3 0.654 0.428 y=40.243+11.532x 11.773 <0.01
L4 0.628 0.395 y=37.358+12.284x 12.110 <0.01
L5 0.623 0.388 y=37.347+12.473x 12.175 <0.01
Mean lumbar 0.736 0.541 y=32.936+15.087x 10.541 <0.01
Entire column 0.713 0.508 y=42.378+16.446x 10.915 <0.01
Female C2 0.523 0.273 y=58.281+11.927x 13.540 <0.01
C3 0.498 0.248 y=55.665+10.513x 13.778 <0.01
C4 0.580 0.337 y=50.334+11.925x 12.936 <0.01
C5 0.618 0.382 y=45.091+13.370x 12.491 <0.01
C6 0.527 0.278 y=49.213+11.462x 13.502 <0.01
C7 0.477 0.227 y=56.854+8.787x 13.965 <0.01
Mean cervical 0.680 0.463 y=44.589+18.101x 11.645 <0.01
T1 0.341 0.116 y=59.848+6.704x 14.932 <0.01
T2 0.306 0.094 y=59.735+6.220x 15.122 <0.01
T3 0.271 0.074 y=58.602+5.494x 15.290 <0.01
T4 0.341 0.116 y=55.890+6.878x 14.933 <0.01
T5 0.411 0.169 y=51.393+9.417x 14.484 <0.01
T6 0.483 0.233 y=50.941+9.881x 13.912 <0.01
T7 0.520 0.270 y=49.885+10.316x 13.572 <0.01
T8 0.516 0.266 y=51.230+9.349x 13.611 <0.01
T9 0.566 0.320 y=50.088+9.791x 13.097 <0.01
T10 0.570 0.325 y=48.696+9.975x 13.053 <0.01
T11 0.556 0.309 y=48.269+10.606x 13.201 <0.01
T12 0.531 0.282 y=50.480+9.811x 13.464 <0.01
Mean thoracic 0.602 0.363 y=45.828+16.344x 12.682 <0.01
L1 0.594 0.353 y=47.633+11.776x 12.781 <0.01
L2 0.662 0.439 y=41.159+13.247x 11.902 <0.01
L3 0.703 0.494 y=40.286+13.155x 11.300 <0.01
L4 0.680 0.463 y=36.471+14.294x 11.641 <0.01
L5 0.665 0.442 y=38.320+13.647x 11.861 <0.01
Mean lumbar 0.755 0.570 y=33.202+17.226x 10.418 <0.01
Entire column 0.645 0.416 y=44.021+17.927x 12.14 <0.01
Table 4

Statistical data for age (y) estimation equation from vertebral osteophytes (x) using criteria established by new modified score by length of vertebral osteophyte (this study) (six-stage classification)

acb-52-149-i004
Group Part of spine Correlation coefficient R2 Regression equation Standard error of estimate P-value
Combination of both sexes C2 0.441 0.195 y=58.607+6.432x 14.035 <0.01
C3 0.521 0.272 y=54.898+7.452x 13.347 <0.01
C4 0.502 0.252 y=53.315+6.859x 13.521 <0.01
C5 0.567 0.322 y=49.438+7.265x 12.880 <0.01
C6 0.545 0.297 y=50.688+7.001x 13.113 <0.01
C7 0.483 0.234 y=55.996+5.905x 13.689 <0.01
Mean cervical 0.607 0.369 y=48.889+9.635x 12.423 <0.01
T1 0.440 0.193 y=57.482+5.970x 14.045 <0.01
T2 0.386 0.149 y=58.265+4.870x 14.428 <0.01
T3 0.333 0.111 y=58.164+4.135x 14.748 <0.01
T4 0.393 0.154 y=56.538+4.926x 14.380 <0.01
T5 0.408 0.166 y=56.391+4.951x 14.278 <0.01
T6 0.476 0.227 y=54.876+5.657x 13.752 <0.01
T7 0.518 0.269 y=54.107+5.847x 13.375 <0.01
T8 0.515 0.266 y=53.571+5.407x 13.402 <0.01
T9 0.533 0.284 y=52.493+5.320x 13.236 <0.01
T10 0.573 0.328 y=50.772+5.848x 12.820 <0.01
T11 0.581 0.338 y=49.977+6.170x 12.724 <0.01
T12 0.534 0.285 y=50.907+5.997x 13.222 <0.01
Mean thoracic 0.578 0.334 y=49.118+7.994x 12.762 <0.01
L1 0.604 0.365 y=48.406+6.801x 12.459 <0.01
L2 0.669 0.447 y=44.027+7.961x 11.629 <0.01
L3 0.702 0.492 y=40.272+8.699x 11.142 <0.01
L4 0.692 0.479 y=36.082+9.588x 11.290 <0.01
L5 0.681 0.463 y=37.038+9.433x 11.456 <0.01
Mean lumbar 0.749 0.560 y=35.402+10.552x 10.369 <0.01
Entire column 0.680 0.463 y=42.551+10.679x 11.462 <0.01
Male C2 0.462 0.213 y=57.159+6.336x 13.804 <0.01
C3 0.558 0.311 y=53.263+7.561x 12.918 <0.01
C4 0.503 0.253 y=52.744+6.487x 13.456 <0.01
C5 0.570 0.325 y=48.750+7.031x 12.787 <0.01
C6 0.573 0.329 y=48.967+7.052x 12.752 <0.01
C7 0.523 0.274 y=54.021+6.132x 13.264 <0.01
Mean cervical 0.629 0.395 y=47.274+9.443x 12.102 <0.01
T1 0.477 0.227 y=56.115+6.169x 13.681 <0.01
T2 0.432 0.186 y=56.988+5.018x 14.040 <0.01
T3 0.368 0.135 y=57.208+4.304x 14.473 <0.01
T4 0.427 0.183 y=55.689+5.073x 14.071 <0.01
T5 0.433 0.187 y=56.239+4.807x 14.033 <0.01
T6 0.500 0.250 y=54.421+5.591x 13.479 <0.01
T7 0.530 0.281 y=54.271+5.591x 13.198 <0.01
T8 0.542 0.293 y=52.652+5.415x 13.083 <0.01
T9 0.560 0.314 y=51.147+5.421x 12.894 <0.01
T10 0.602 0.362 y=49.605+5.859x 12.429 <0.01
T11 0.621 0.385 y=48.652+6.186x 12.205 <0.01
T12 0.576 0.331 y=48.850+6.226x 12.728 <0.01
Mean thoracic 0.613 0.375 y=47.981+7.978x 12.301 <0.01
L1 0.633 0.401 y=46.830+6.805x 12.045 <0.01
L2 0.678 0.459 y=43.528+7.755x 11.446 <0.01
L3 0.690 0.477 y=40.197+8.349x 11.259 <0.01
L4 0.678 0.460 y=35.531+9.335x 11.439 <0.01
L5 0.677 0.458 y=35.660+9.485x 11.459 <0.01
Mean lumbar 0.751 0.564 y=34.469+10.342x 10.275 <0.01
Entire column 0.703 0.495 y=41.375+10.456x 11.062 <0.01
Female C2 0.492 0.242 y=59.162+9.705x 13.832 <0.01
C3 0.501 0.251 y=56.105+8.775x 13.749 <0.01
C4 0.560 0.313 y=52.050+9.301x 13.165 <0.01
C5 0.600 0.360 y=48.924+8.710x 12.706 <0.01
C6 0.552 0.304 y=50.929+8.543x 13.250 <0.01
C7 0.466 0.218 y=57.607+6.938x 14.052 <0.01
Mean cervical 0.670 0.448 y=46.797+13.759x 11.798 <0.01
T1 0.395 0.156 y=59.151+6.257x 14.596 <0.01
T2 0.321 0.103 y=59.576+5.355x 15.043 <0.01
T3 0.271 0.074 y=59.664+3.942x 15.290 <0.01
T4 0.331 0.109 y=57.973+4.711x 14.993 <0.01
T5 0.366 0.134 y=56.115+5.547x 14.785 <0.01
T6 0.438 0.192 y=55.353+6.005x 14.281 <0.01
T7 0.503 0.253 y=53.269+6.616x 13.734 <0.01
T8 0.482 0.233 y=54.573+5.750x 13.915 <0.01
T9 0.504 0.254 y=54.013+5.552x 13.722 <0.01
T10 0.543 0.295 y=51.723+6.372x 13.340 <0.01
T11 0.539 0.291 y=50.656+6.944x 13.376 <0.01
T12 0.498 0.248 y=52.569+6.495x 13.777 <0.01
Mean thoracic 0.540 0.291 y=49.644+8.897x 13.374 <0.01
L1 0.601 0.362 y=48.679+8.021x 12.692 <0.01
L2 0.676 0.457 y=43.607+8.938x 11.710 <0.01
L3 0.749 0.560 y=38.961+9.967x 10.532 <0.01
L4 0.751 0.563 y=34.955+10.878x 10.498 <0.01
L5 0.712 0.507 y=38.021+9.892x 11.159 <0.01
Mean lumbar 0.786 0.618 y=34.260+12.107x 9.813 <0.01
Entire column 0.697 0.486 y=40.810+13.249x 11.389 <0.01
Table 5

A summary of studies into vertebral osteophyte formation

acb-52-149-i005
Author Country Year Level of study Purpose Osteophyte classification Relationship with age
Stewart [19] American 1958 C, T, L To present some observations on vertebra lipping from the standpoint of age identification 5 Categories (−, +, ++, +++, ++++) -
Snodgrass [20] American 2004 T, L To examine osteophyte production in a large sample of adult females and males to establish patterns of morphological change and to examine potential differences between the sexes 5 Categories (0, 1, 2, 3, 4) Significantly correlated with aging
- In the thoracic area (r2=0.50 in males and 0.30 in females)
- Lumbar (r2=0.60 in males vs. 0.50 in females)
Van der Merwe et al. [21] Black South African 2006 C, T, L To describe the pattern and severity of osteophyte development in the vertebral columns of male and female South Africans 5 Categories (0, 1, 2, 3, 4) Vertebral osteophytes are associated with age
Watanabe and Terazawa [15] Japanese 2006 C, T, L To assess age estimation from the degree of osteophyte formation of the vertebral column 4 Grades (0, 1, 2, 3) Significantly correlated with aging (r=0.7, P<0.01)
Namkin et al. [12] Thai 2008 C, T, L To study the prevalence and distribution of vertebral osteophyte formation in Northeast Thais - Significantly correlated with aging (P<0.01)
Kasai et al. [24] Japanese 2009 L Investigate the direction of the formation of anterior lumbar vertebral osteophytes across the lumbar vertebrae using a sufficient number of lumbar radiographs 6 Categories (A, B, C, D, E, F) based on the direction of each pair -
Chanapa and Mahakkanukrauh [13] Thai 2011 C To study the distribution and length of osteophytes in the cervical vertebrae - Osteophyte length correlated significantly with age (r=0.377, P<0.01)
Listi and Manhein [23] American 2012 C, T, L To examine the association between osteophyte development in the vertebral body margins and osteoarthritis in the facets Test whether or not the inclusion of osteoarthritis can enhance age estimation Assess whether or not the relationship to age is strengthened by limiting analyses to areas that experience heavier stress loads If possible, to generate regression formulae for age estimation 5 Categories (0, 1, 2, 3, 4) Significantly correlated with aging (r2=0.393, P<0.01)
Chanapa et al. [14] Thai 2014 L To determine the distribution, classification and length of osteophytes in the lumbar vertebrae 3 Types (traction, claw, fusion) Osteophyte length significantly correlated with age (P<0.01)
TOOLS
Similar articles