

 PDF
PDF ePub
ePub Citation
 Print
Print


INTRODUCTION
Hypoxia is defined as a lack of suitable oxygenation of cells, with low oxygen concentration within the tissues secondary to a discrepancy between oxygen supply and consumption. When this condition is physiological and usually transient, tissues are capable of regulating oxygen levels through vasodilation, reduction in oxygen consumption, and cellular triggering of alternative metabolic pathways. However, when the insult is long-lasting and homeostatic response mechanisms are not satisfactory, hypoxia becomes pathological. Thus, it is involved in the development and progression of certain diseases, such as cardiovascular disease, chronic kidney disease, and diabetic retinopathy, or inflammatory conditions like rheumatoid arthritis [12345].
Several efforts to determine numerical cut-off values for hypoxia status have been made [6]. In breast tumors, partial pressure of oxygen (PaO2) below 10 mmHg have been related to increased risk of mortality and metastasis [7]. Nevertheless, assigning cut-off values turns out to be challenging due to the presence of certain gaseous mediators such as nitric oxide. This is synthesized in a hypoxic environment to counteract the effects of the tissue oxygen deprivation changing the threshold, at which hypoxia might be considered pathological. Also, breast tissue has a complex architecture and a variable oxygen demand due to background physiological fluctuations secondary to menstrual cycle changes [8].
The study of hypoxia in oncology has implications in many types of cancers, including breast cancer (BC). It is crucial to understand the molecular mechanisms underlying hypoxia leading to tumor growth, so molecular imaging strategies can be developed, thus providing the oncology community with several options to choose from when assessing hypoxia.
Firstly, oxygen deprivation in breast tumors has implications for diagnosis and prognosis. Hypoxia is known as a key mediator process in cancer development and a tumor microenvironment stressor leading to dysregulated metabolism (metabolic switch). This results in aggressive tumor phenotypes that are characterized by increased risk of invasion and metastasis and a poor prognosis for survival and local control, independent of the clinical stage at diagnosis [910].
When tumors start to grow, there is a decreased delivery of oxygenated blood to meet the increased metabolic demands of the rapidly proliferating tumor cells. In response to the new situation, angiogenesis turns on through the activation of a sheer number of angiogenic factors such as interleukin-8, platelet derived growth factor, cyclooxygenase-2, endothelin-1 and -2, fibroblast growth factor-3, or nitric oxide synthase. Probably, members of the vascular endothelial growth factor (VEGF) family are the most relevant ones. These mediators trigger cellular responses by binding to membrane tyrosine kinase receptors, conforming dimers and becoming activated through transphosphorylation [11]. Overexpression of VEGF-A has been associated with decreased overall survival and disease-free survival in BC [12]. Likewise, this so called “angiogenic switch” has been implicated in tumor metastasis [13]. VEGF, in collaboration with other factors, is responsible for a network of microvasculature, which exhibit functional and structural abnormalities posing limitations to oxygen diffusion, and therefore aggravating tumor deprivation [1415]. This forces the tumor cells to develop adaptive responses by changing gene expression that will contribute to their survival in a hostile hypoxic environment. A cornerstone in these adaptive responses is the hypoxia-inducible transcription factor (HIF) family [12].
HIF-1 is the best characterized member of the HIF family and plays a critical role in tumor adjustment to hypoxia. HIF-1 is a heterodimeric transcription factor consisting of an inducible α unit and a constitutively expressed β unit. When oxygen is present, HIF-1α is hydroxylated at several proline residues, leading to its ubiquitination and proteasomal degradation. However, under hypoxic conditions, HIF-1α evades degradation and assembles with HIF-1β, creating a transcription factor (HIF-1) that can bind to target genes in the nucleus through its 5′-TACGTG-3′ recognition sequence. Thus, there is an upregulation of genes involved in glucose metabolism, pH regulation, cellular proliferation and apoptosis, nitric oxide metabolism, intracellular reduction–oxidation homeostasis, angiogenesis, and erythropoiesis [16171819202122].
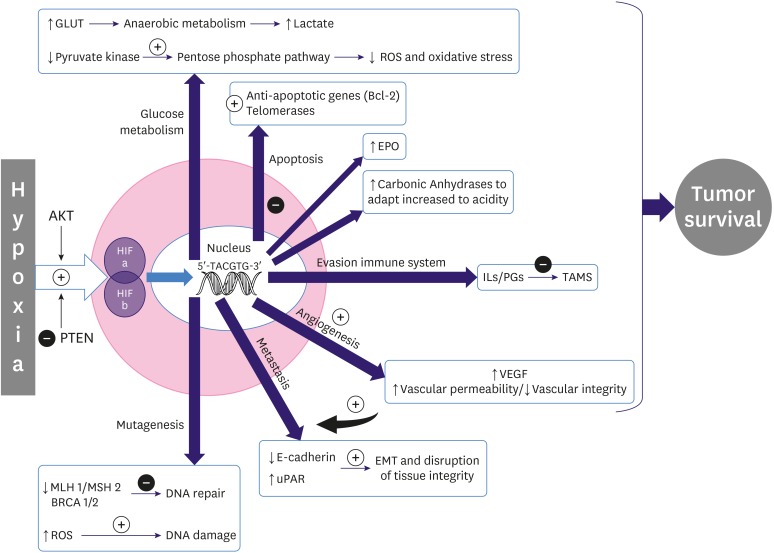
Although hypoxia is the most powerful stimulus for inducing HIFs, oxygen deprivation is not the only determinant of HIF production. Products of oncogenes, such as protein kinase B, can also activate HIFs. Likewise, the inhibition of tumor suppressors, such as phosphatase and tensin homolog, promyelocytic leukemia protein, or tuberous sclerosis complex, can stimulate the HIF response in normoxia, which increases the complexity of this molecular machinery [23] (Figure 1).
Figure 1
Diagram of the effects of hypoxia in tumor cells.
GLUT = glucose transporter; ROS = teactive oxygen species; Bcl-2 = B-cell lymphoma 2; EPO = erythropoietin; IL = interleukin; PG = prostaglandin; TAMS = tumor-associated macrophages; VEGF = vascular endotelial growth factor; uPAR = urokinase plasminogen activator receptor; HIF = hypoxia-inducible factor; BRCA 1/2 = breast cancer genes; PTEN = phosphatase and tensin homolog; AKT = protein kinase B; MSH 2 = mutS protein homolog 2; MLH 1 = mutL homolog 1.
Secondly, hypoxia has implications for BC treatment. Notably, hypoxia can directly attenuate chemotherapeutic-agent action by reducing the generation of intracellular free radicals and, therefore, limiting the damage induced on DNA. It has been proposed as the mechanism of chemoresistance to agents used in BC treatment, such as anthracyclines [2024]. The molecular changes mentioned, especially those that lead to genomic instability, extracellular acidification, resistance to apoptosis, evasion of immune system surveillance, and metastasis, seem to be deeply related to chemotherapy resistance [25].
One of the first reported molecular mechanisms explaining this contribution was the activation of the multidrug resistance 1 (MDR1) gene by HIF-1α in response to hypoxia. MDR1 is responsible for the genesis of several membrane glycoproteins, finally clearing some chemotherapeutic drugs used in BC, such as vinca alkaloids, anthracyclines, and paclitaxel [26].
VEGF induced by HIF also helps to decrease functional concentrations of chemotherapeutic agents by inducing the formation of aberrant tumor blood vessels, which result in diminished and uneven distribution of the drugs. Increased glycolysis with extracellular acidosis may also affect the transport of drugs across the cell membrane, conditioning the therapeutic efficacy of a wide variety of agents used in BC, such as anthracyclines, cyclophosphamide, or carboplatin [24].
Recently, the importance of cancer stem cells (CSCs) and their contribution to therapeutic resistance and disease recurrence have been highlighted. These pluripotent cells within solid tumors have the ability of epithelial-mesenchymal transition, auto self-renewability, and drug resistibility. Hypoxia has been involved in the transformation and growth of these cellular pools [2327]. The expansion of the CSC marker CD133+ has been shown to be involved in the transition from in situ to invasive BC [21].
The deleterious role of hypoxia in radiotherapy is based on its own mechanism of action that is enhanced in the presence of oxygen. The radiation causes tissue damage through the formation of free radicals, directly on the target or indirectly through water tissue ionization. These free radicals will react rapidly with oxygen to become more stable, producing chemical changes in the composition of the cells and causing damage to DNA in the presence of oxygen. This is known as “oxygen enhancing effect.” Conversely, under hypoxic conditions, the cell is unable to follow the sequence of reactions that prevent the tissue from being damaged, thus resulting in radiation resistance and local recurrence of the disease [2829]. In addition, hypoxia may indirectly promote radioresistance through gene modification, decreasing apoptotic potential and diminishing proliferation, thereby reducing radiosensitivity of the tumor [20].
NON-INVASIVE IMAGING APPROACHES TO HYPOXIA
The ability to identify hypoxia would have implications in a wide range of oncological settings. On one hand, it would allow stratification of patients for more accurate prognostic information. On the other hand, identifying hypoxic tumors would improve patient outcomes by helping to adjust irradiation dose, selecting individuals for personalized treatment with anti-hypoxia-directed therapies, and finding new strategies to increase the efficacy of drugs by increasing oxygen supply to the tumor (e.g., the administration of recombinant human erythropoietin) [2430].
To date, patient risk stratification and treatment decisions in BC are mainly based on the molecular profile of the tumor. Despite the importance of hypoxia, this parameter is not yet included in the decision-making flowchart in BC treatment. Non-invasive approaches for detecting and monitoring changes in tissue oxygenation will spearhead this change, since they are not conditioned by tumor location and can be repeated prior and during treatment, without causing any harm to the subject. Nevertheless, most non-invasive oximetry methods are not widely available in imaging centers and are still in a preclinical setting in need for further research for validation. Positron emission tomography (PET) and blood oxygen level dependent magnetic resonance imaging (BOLD MRI) are the leading candidate methods for visualizing tissue hypoxia in human tumors.
The non-invasive imaging methods for oximetry can detect the presence of oxygen directly within the tissue or indirectly by the administration of tracers that accumulate or activate within the hypoxic cells or endogenous oxygen-dependent markers, such as hypoxia-related proteins [631] (Table 1).
Table 1
Non-invasive imaging methods to measure hypoxia
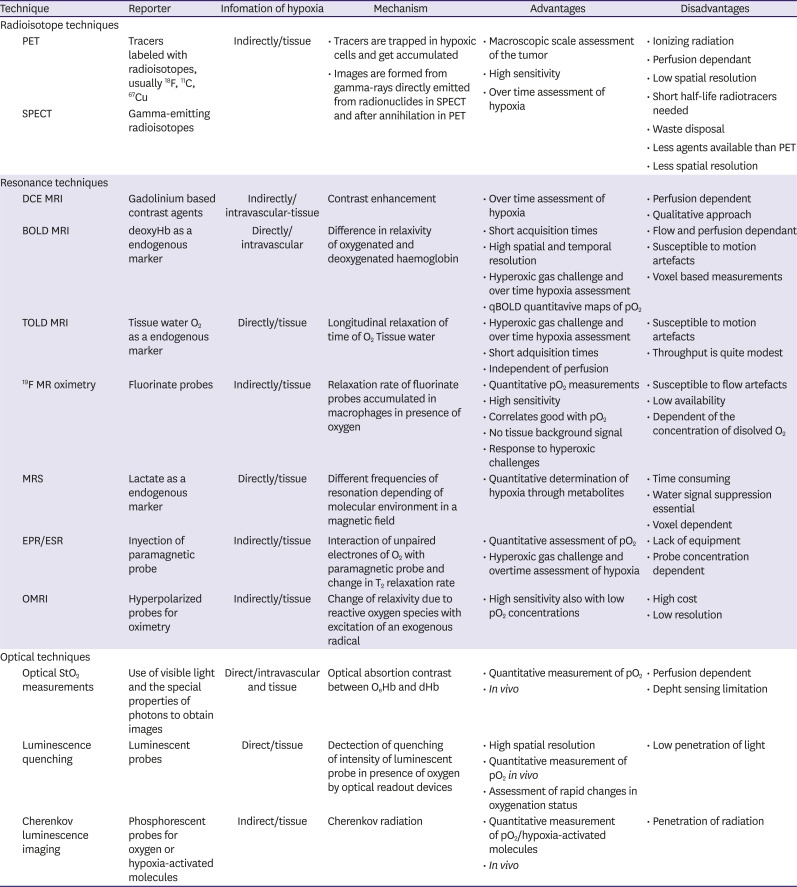
PET = positron emission tomography; 18F = fluorine-18; 11C = carbon-11; 67Cu = copper-67; SPECT = single photon emission computed tomography; DCE = Dynamic contrast-enhanced; MRI = magnetic resonance imaging; BOLD = blood oxygen level dependent; deoxyHb = deoxyhemoglobin; qBOLD = quantitative blood oxygen level dependent; MRS = magnetic resonance spectroscopy; EPR = electron paramagnetic resonance; ESR = electron spin resonance; OMRI = Overhauser-enhanced magnetic resonance imaging.
RADIOISOTOPE TECHNIQUES
PET and single photon emission computed tomography (SPECT) rely on the detection of gamma ray photons. SPECT requires gamma-emitting radioisotopes, such as technetium-99m, while PET uses radiopharmaceuticals, usually labeled with fluorine-18 (18F) or carbon-11. These molecules are generally delivered into the cells by the bloodstream. Emissions from the radioisotopes are detected by a gamma camera in SPECT, depicting areas with more blood supply and therefore more biological activity. PET images are obtained with scanners after radionuclides are incorporated into molecules used by the body (e.g., fludeoxyglucose as a glucose analogue), following positron–electron annihilation. Although SPECT images are easier to acquire, PET is the preferred method for imaging tumor hypoxia due to its high specificity and sensitivity to show physiological processes in vivo and better spatial resolution.
Nitroimidazoles are hypoxic selective compounds used as radiosensitizers and are now widely used for PET imaging of hypoxia. These substances are delivered to the cells through the blood supply and once inside, they follow a redox reaction by the action of xanthine oxidase. This process is reversible in normoxia; however, under hypoxic conditions, the reduced molecules cannot be oxidized again. These highly reactive reduced intermediates tend to bind to other macromolecules, permanently remaining trapped inside viable hypoxic cells and thus, permitting radioisotopic imaging of hypoxia [32].
18F fluoromisoinidazole
18F fluoromisoinidazole (18F FMISO) is the PET tracer used most frequently to detect hypoxia with several studies conducted in BC [33343536]. 18F FMISO-PET has a low resolution due to the tracer's slow pharmacokinetic profile. Its slow uptake and wash-out kinetics require approximately a 2 hours delay time between injection and imaging to permit clearance of 18F FMISO from normoxic tissue that would potentially limit visual detection of hypoxic regions [29]. Despite these limitations, 18F FMISO could be useful for planning intensity modulated radiation therapy [37].
18F-fluoroazomycin arabinoside, 18F-flortanidazole, and 18F-labeled fluoroerythronitroimidazole
18F-fluoroazomycin arabinoside (18F FAZA) and 18F-flortanidazole are more hydrophilic nitroimidazoles, improving imaging of tumor hypoxia contrast by a faster clearance from the blood and normal tissues [38].
18F-labeled fluoroerythronitroimidazole has been used in mammary tumors in a preclinical setting, showing similar distribution features as 18F FAZA [39].
Thiosemicarbazones
Thiosemicarbazones belong to a chemically different group, labelled with a positron-emitting isotope of copper (Cu). Cu2+ is reduced to Cu1+ within the cytoplasm, and this reaction is reversible in the presence of oxygen. In this group, the specificity of hypoxia occurs when, under low oxygen conditions, the Cu1+ in the thiosemicarbazone complex cannot be converted to Cu2+ again. Then, following protonation, Cu1+ separates from the complex and is entrapped within the cells. They have high membrane permeability and fast uptake kinetics, which allow for rapid imaging after injection. Among its disadvantages, they exhibit cell-type specificity and reduced accumulation in mildly hypoxic tissues [6414243].
Though highly promising, radioisotope techniques do not directly provide PaO2 values and should be performed in perfused tissues. Besides, the complexity of measurements, the low spatial resolution, the exposure of patients to ionizing radiation, and the difficulty to obtain tracers make clinical translation challenging [33].
RESONANCE TECHNIQUES
Conventional contrast-enhanced MRI is the standard technique for the diagnosis of BC, with high sensitivity and specificity. However, this method is quite limited in its ability to characterize the complex biology of breast tumors [44]. Dynamic contrast-enhanced (DCE) MRI has been suggested as useful for detecting tumor hypoxia [4546]. MRI signals are produced through the administration of a bolus of gadolinium-based contrast agent after its distribution within the tissue. This provides information on perfusion and permeability with several limitations, since perfusion is not the only feature influencing PaO2; thus, the estimates may not be accurate [29].
To overcome the limitations of DCE MRI when assessing hypoxia, this technique can be combined with other oximetric methods such as BOLD MRI, 19F-oximetry, and magnetic resonance (MR) spectroscopy (MRS) [6].
Blood oxygen level dependent and tissue oxygen level dependent
MRI relies on a large external magnetic field and coils to detect the relaxation of atoms with magnetic moments, after the delivery of radiofrequency pulses. BOLD MRI uses the paramagnetic properties of deoxyhemoglobin (deoxyHb), exploiting the difference in relaxivity of oxygenated and deoxygenated hemoglobin to generate a signal. Although hydrogen-1 (1H) MRI cannot directly visualize molecular oxygen, the paramagnetic properties of deoxyHb allow an inference of molecular oxygen by its relaxation time (changes in longitudinal relaxation time T1 and transverse relaxation T2*).
BOLD MRI signals are related to vascular oxygenation and may allow direct estimates of PaO2. The presence of deoxyHb in blood vessels causes a decrease in T2*, leading to darkening in tissues containing the vessel in a T2*-weighted imaging protocol. BOLD MRI has the advantage of both high spatial and temporal resolution and can detect spontaneous oxygen fluctuations, permitting the study of different areas of functional vasculature within a tumor [2947].
Among its disadvantages, measurements can only be determined within a measured voxel that can include blood vessels and surrounding tissue, which in tumors is likely to contain tortuous microcapillaries, making BOLD MRI interpretation harder. A second limitation of BOLD MRI is that it reflects vascular oxygenation, which may be unrelated to tissue PaO2, because of wall permeability and flow and oxygen content in the blood [48].
The use of BOLD MRI, in combination with other approaches derived from 1H relaxation, may be able to overcome blood volume and flow limitations. These techniques are flow- and oxygen level-dependent in contrast to tissue oxygen level dependent (TOLD)/oxygen-enhanced MRI, which yields information on tissue PaO2 [49]. Combining BOLD and TOLD MRI could provide a robust insight into tumor hypoxia [5051]. TOLD MRI is a widely available method that uses a T1-weighted protocol. It does not need any contrast agent and has short acquisition times that allow the monitoring of PaO2 changes. TOLD MRI relies on oxygen as an endogenous contrast agent, using its paramagnetic properties that shorten T1 of the surrounding protons, establishing a correlation between PaO2 and relaxation rates. However, this correlation can be difficult to establish since T1 is influenced by temperature, tumor features, and basal blood oxygen saturation [5253].
Artifacts may represent another limitation for these techniques based on 1H relaxation contrast. BOLD MRI is highly susceptible to motion artefacts. Specifically, the contrast of the image of the breast tissue in high fields can be affected by field distortions due to the complex breast geometry [54]. To improve signal contrast, protocols with T2*-weighted fast spin echo images, rather than T2*-weighted gradient-recalled echo imaging, has been proposed [55].
BOLD MRI only provides qualitative or semi-quantitative information on PaO2. A newly developed technique known as multiparametric quantitative BOLD (qBOLD) has achieved quantitative mapping of tumor hypoxia. It combines the possibility of monitoring changes in tumor oxygenation [48]. In breasts, several studies correlating relaxation rate R2* values with tumoral phenotype and HIF have been conducted, highlighting BOLD MRI as a useful tool with encouraging results [5657].
MR oximetry based on perfluorocarbon [19F MR]
The use of F-labeled contrast agents represents an alternate imaging approach to proton 1H MRI, for depicting hypoxia. It allows us to map tumor hypoxia quantitatively and responds to hyperoxic challenges by displaying heterogeneity within each tumor [5859].
19F MR oximetry uses T1 of fluorine agents, with the advantage of absolute determination of oxygenation in vivo. Also, acquisition times are short with few background signals.
Although promising, fluorine MR is expensive and the toxicity of perfluorocarbons (PFCs) chosen must be considered. PFCs like (19F)-hexafluorobenzene also depend on the concentration of dissolved oxygen to be able to accumulate inside macrophages [6061]. The way in which the fluorinated compounds reflect the oxygenation of different compartments requires additional investigation [29].
In addition to its use for evaluating hypoxia, 19F MRI has been used in breast tumors to target cancer cells with nanoparticles for diagnosis or to assess the burden of tumor-associated macrophages within a tumor, to evaluate cancer progression and metastatic spread [6263]. Also, images through F-labeled agents have demonstrated the ability to represent the oxygenation status according to hormonal levels [64].
MR spectroscopy
MRS exploits the nuclear spin properties of 1H in a magnetic field, to absorb and emit radiofrequency. This technique obtains a spectrum of the concentration of metabolites resonating at different frequencies when placed in a magnetic field, because of their immediate molecular environment. Water signal suppression is essential for MRS image acquisition because the water proton signal is much stronger, due to its high concentration. Some products derived from hypoxia, such as lactate, can be determined with MRS imaging [43]. However, the study of hypoxia with MRS is time consuming and requires special analysis software.
Other atoms with unpaired protons, such as 31P and 23Na, have similar spin properties as 1H. They can emit spatially localized signals in a spectrum. 31P and 23Na spectroscopic imaging and the determination of choline can be used for BC diagnosis, to increase specificity and monitor chemotherapy [4465].
Electron paramagnetic resonance or electron spin resonance
This MR technique provides a quantitative assessment of the PaO2 in the tissue. The principle of electron paramagnetic resonance (EPR) oximetry is that oxygen undergoes spin exchange interaction with paramagnetic species (molecules presenting unpaired electrons). EPR oximetry requires the injection of a paramagnetic probe into the tumors; thus, the unpaired oxygen electrons interact with the paramagnetic probe and cause a change in T2*. This can be observed by a change in the linewidth of the spectrum, with an increase in line-broadening of peak to peak widths, which can be used to infer oxygen concentration [66].
Measurements are non-invasive and dynamic oximetry and it is possible to show regional response of the tumor to hyperoxic gas challenge, reflecting differences in PaO2 within the tumor [67]. The probe concentration and the fast relaxation of paramagnetic species can condition the evaluation. Coils enabling EPR imaging and MRI have been developed to correlate the PaO2 maps with anatomical information and perfusion measurements [68].
For improving the sensitivity of this technique, a combined EPR/MR approach, Overhauser-enhanced MRI (OMRI) has been developed. This uses a low-field MR scanner and a paramagnetic contrast agent. The method exploits the Overhauser enhancement in the tissue water protons that is generated when a paramagnetic agent is hyperpolarized through electromagnetic irradiation; then, a transfer of electron polarization occurs toward the surrounding water's protons. Tumor perfusion and oxygenation can be analyzed using probes for oximetry like Oxo63. Image contrast is proportional to agent concentration in tumor perfusion, while it is inversely proportional to oxygen concentration [29].
Two types of paramagnetic materials can be used as probes: soluble materials (e.g., nitroxides and triaryl methyl radicals) and insoluble particulate materials (e.g., coals, chars, and inks). Insoluble agents have higher sensitivities for oxygen [69].
Although EPR oximetry is a promising technique for monitoring treatment through hypoxia, it is not yet utilized in BC, probably due to lack of sufficient development and adequate instrumentation.
OPTICAL IMAGING FOR MEASURING HYPOXIA
Some of the optical imaging methods to evaluate hypoxia, such as those used in histology, are invasive. They need tumor specimens to detect targeted hypoxia-inducible factors, such as HIF-1 or VEGF [67]. These endogenous biomarkers are frequently used to test the validity of other biomarkers of hypoxia.
A non-invasive optical approach to quantitatively determine the activity of hypoxia genes is by introducing transgenes with hypoxic response elements as promoter sequences coupled to reporter genes, which produce in vivo bioluminescent imaging such as luciferase or green fluorescent protein [707172]. These imaging tools are useful for studying the biology of hypoxia and mechanisms of response to experimental therapy in vivo but are unlikely to have a role in humans.
Other optical imaging methods looking inside the body rely on the use of visible light and the special properties of photons to obtain detailed images of tissues and smaller structures, including cells and molecules. As light is used, ionizing radiation is not involved in generating images, and many different properties of a tissue can be measured at the same time with various colors of light.
Most of these optical techniques can measure oxygen in tissues using the absorption contrast from hemoglobin–oxygen binding and luminescence quenching by oxygen.
Absorption contrast imaging methods are based on the property of oxyhemoglobin and deoxyHb to absorb light across a different spectral range; thus, it is possible to calculate oxygen saturation. Several techniques have been developed using this physical property [69].
Pulse oximetry is probably the most familiar and the simplest one. It works by transmitting two wavelengths of light in which either one will be more absorbed by either oxyhemoglobin or deoxyHb. By measuring the differential absorption in the blood vessels, blood PaO2 can be determined.
Diffuse optical spectroscopy and tomography (DOS/T) irradiate tissues with light of different wavelengths. Some photons are absorbed, whereas others are scattered. The latter ones can be redirected toward detectors generating attenuation spectra that can in turn generate three-dimensional tomograms of tissue parameters, including oxygen saturation, since light absorption can be measured at different distances and positions from the light source. DOS/T has been used in humans to determine breast density [73].
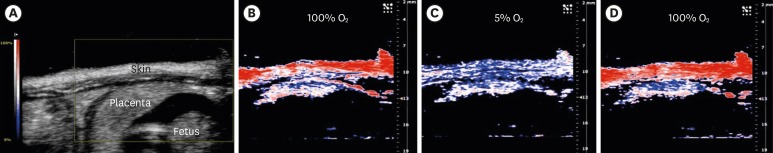
Also, imaging techniques based on optical contrast between oxyhemoglobin and deoxyHb can be combined with ultrasound detectors in a method called photoacoustic tomography. When a molecule absorbs light, the energy can be redistributed into the environment, creating a thermally induced pressure jump that emits detectable ultrasonic waves. This is called the photothermal effect. And it is why this technique overcomes the resolution limitations imposed by the two other methods—by being able to visualize the three-dimensional position of molecules in tissue [74]. Although its role in humans has not been evaluated, some early studies in intracranial tumors and placenta in animals show considerable promise [7576] (Figure 2).
Figure 2
PA imaging of placental oxygenation on day 14 of gestation. (A) The placenta in a sagittal plane (obtained by a B-mode ultrasound scan) and parametric images created with the PA oxyhemo mode making possible the evaluation of blood oxygen saturation during variations in the oxygen levels supplied to the mother (5%–100%). PA imaging sequences during hyperoxygenation (B), hypoxia (C) and hyperoxygenation (D). Reprinted with permission from reference 76: Arthuis CJ, Novell A, Raes F, Escoffre JM, Lerondel S, et al. Real-time monitoring of placental oxygenation during maternal hypoxia and hyperoxygenation using photoacoustic imaging. PLoS One 2017;12:e0169850.
PA = photoacoustic.
Optical coherence tomography (OCT) is a noninvasive imaging technique that provides high resolution images of detailed structures of the tissues that are almost close to what histology may provide. OCT employs light from a broadband light source, creating cross-sectional images. It does this by measuring the echo time delay and intensity of the reflected and backscattered light, through the depth of the tissue along a point in vivo [77]. It has been used to detect skin and retinal cancer [7879]. In breast, OCT has been demonstrated useful for the surgical margin assessment [8081]. A newer OCT variant called spectral-domain OCT uses spectral detectors, allowing the inference of oxygen saturation through the absorption information encoded in the spectra [82].
Another technique in development is luminescence quenching, in which luminescent probes are used to report absolute oxygen concentration. These compounds transfer energy to nearby molecular oxygen and therefore no longer emit radiation. The oxygen-quenching effect is rapidly reversible, making this useful for observing rapid changes in oxygenation status, including reoxygenation. The search for newer luminescent probes will allow the assessment of hypoxia-induced factors, as well as a decrease in toxicity, providing new windows for hypoxia detection [6883].
The demonstration of visible light emission during the radioactive decay of positron-emitting radionuclides represents a new method of molecular imaging called Cherenkov luminescence imaging. As PET radiotracers labeled with high-energy positron-emitters are used, some physical principles underlying this technique are shared with the ones in PET. The nucleus emits a high-energy positron, which, as a result of subsequent interactions with the tissue, loses its energy and decays, eventually producing a pair of photons (gamma rays) in a phenomenon known as annihilation. These photons will ultimately reach the detector of the PET scanner to generate an image.
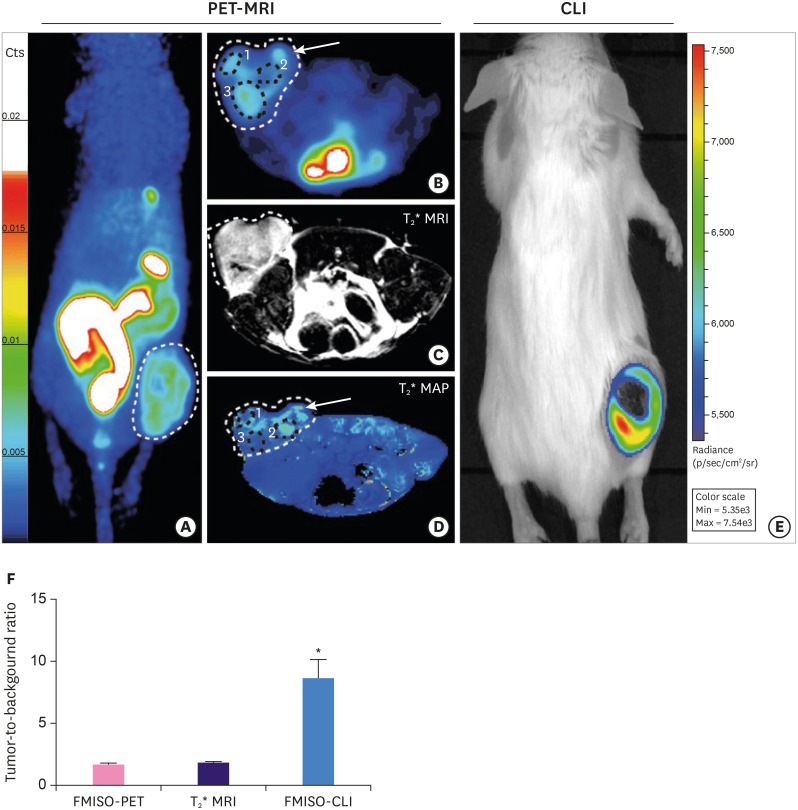
The initial velocity of these positrons often momentarily exceeds the speed of light (in the tissue) satisfying the requirements for the production of Cherenkov radiation. This is produced when a charged particle travels with a velocity that exceeds the speed of light through an insulating medium, producing a local polarization along its way. When returning to equilibrium, Cherenkov radiation is emitted and thus can be detected by an optical imager equipped with a charged coupled device camera. Using selective probes for oxygen or hypoxia-activated molecules, Cherenkov luminescence imaging may represent an invaluable technique to measure hypoxia in vivo and monitor tumor response to hypoxia-targeted drugs [8485] (Figure 3).
Figure 3
Imaging of hypoxia within CT26 tumour bearing mice (n = 13), PET-MRI: (A-D) Representative PET-MRI images showing the global co-localisation of FMISO uptake and BOLD MRI signal. Images were acquired 120 minutes post-injection of 10 MBq of 18F FMISO PET. (A) Representative maximum-intensity-projection FMISO PET Image; (B) Transversal slice showing FMISO uptake within the tumour; (C) T2*-weighted MRI and (D) BOLD image derived from T2* mapping. White dashed lines: tumour limits, white arrows: oxygenated tumour area (increased BOLD signal), black circle: hypoxic tumour areas (decreased BOLD signal). CLI: (E) Representative FMISO CLI image of the same mouse as for (A) to (D) acquired just after the PET-MRI scan. (F) Tumour-to-background ratio for PET, MRI and CLI following the injection of FMISO determined by the ratio of the signal from the tumour and a contralateral irrelevant region of interest (muscle). Reprinted with permission from reference 85: Desvaux E, Courteau A, Bellaye P-S, Guillemin M, Drouet C, Walker P, et al. Cherenkov luminescence imaging is a fast and relevant preclinical tool to assess tumour hypoxia in vivo. EJNMMI Res 2018;8:111.
PET = positron emission tomography; MRI = magnetic resonance imaging; FMISO = fluoromisoinidazole; BOLD = blood oxygen level dependent; CLI = Cherenkov luminescence imaging.
*p < 0.001.
CONCLUSION
There is increasing evidence of the impact of hypoxia as a key inducer of metabolic and architectural changes within the tumor, which makes it more aggressive and resistant to drugs. The ability to non-invasively assess tumor oxygenation opens a new window to characterize the molecular profile of BC, to determine patient prognosis and personalize treatments as well as evaluate tumor response to treatment. Further development of techniques to measure hypoxia within tissues will allow new breakthroughs in BC treatment.
 XML Download