

 PDF
PDF Citation
 Print
Print


INTRODUCTION
Disability-adjusted life years (DALYs), as a single measure of health status, is measured as the sum of the years of life lost (YLLs) and years lived with disability (YLDs). YLL refers to years lost due to premature death at a particular age compared to the number of years that one should have lived. Therefore, YLL indicates the impact of a disease leading premature death on a population, whereas crude mortality rate only describes the amount of death.1 It allows us to determine the health status of the population and provides essential information for decision makers to consider the prevention of premature death as a goal.
When considering the application of the results of disease burden on policymaking, the unit of estimation needs to be divided into various population groups. One of the basic variables is the regional level; however, to the best of our knowledge, cause-specific YLLs or YLDs by regional level has not been yet investigated in Korea. Several studies have analyzed regional differences in mortality234 or a specific disease burden.5678 Given that with the National Health Plan 2020, reducing the gaps in health disparities at a subnational level and improving health equity have been emphasized in Korea, it is essential to accurately measure the burden of disease by region. A comparison of YLLs in different regions across a span of several years might provide helpful information to estimate health inequalities.
This study aimed to estimate YLLs in 17 administrative regions of Korea from 1997 to 2015 and determine the trends of regional differences in health status and disease structure.
METHODS
Estimation of YLLs
YLL was calculated by subtracting the age at death from the longest possible life expectancy for a person at that age. Data on the region, gender, and age-stratified cause-specific death were obtained from the Korean Statistical Information Service (KOSIS) of Statistics Korea. Disease classification was developed by the Korean National Burden of Disease Study by modifying the recently published Global Burden of Disease cause list. A total of 242 causes were included in the analysis. When the garbage code—which cannot be the cause of death—was input, the code was distributed according to the rate of the algorithm developed in a previous research9 to ensure validity. To determine the possible life expectancy, we applied standard life expectancy at each age by year and gender based on life tables, which are also available from the KOSIS. Data sources and methodology are described in detail elsewhere.910
To standardize YLLs by the regional population structure, we used the direct age standardization method with the mid-year population of Korea in 2005. The cause-specific YLLs were aggregated to obtain the regional estimation by gender and age-standardized YLLs per 100,000 population and were used to rank the leading causes of burden of premature death by regions.
Variables representing the regional characteristics
We estimated YLLs by metropolitan cities and provinces, which are the biggest administrative units in Korea. In 2015, the Korean administrative district was composed of eight metropolitan cities (‘Si’ in Korean) and nine provinces (‘Do’ in Korean). The only change that occurred between 1997 and 2015 was that Sejong-si was separated into a new administrative Si from Do (Chungbuk and Chungnam) in 2012.
As variables representing the regional characteristics, we considered individual income, regional income, and deprivation index. Data on the individual and regional income of the 17 Si and Do were obtained from the KOSIS. We used the gross regional national income (GRNI) as a regional income indicator, and income per capita excluding the government and corporate income from the GRNI was used as the individual income.
We used the regional deprivation index developed in a previous study,11 which is composed of eight socioeconomic indicators: the proportion of poor residential areas, elderly population, low level of education, low socioeconomic level, households with no car, single-family households, and women householder. The deprivation index is one of the measures for the socioeconomic status of the region, and higher index values represent higher levels of deprivation.
RESULTS
Table 1 shows the trends in age-standardized YLLs per 100,000 population by gender and 17 regions from 1997 to 2015. There was a decline in YLLs by year in all regions with different patterns of changes across the country (Fig. 1). The average annual changes and rate of YLLs was –257.5 (–3.19%) for men and –144.7 (–0.03%) for women. The region with the greatest annual changes was Jeonnam for both genders (Men, –411.8; Women, –200.2), and the region with the greatest annual change rate was Chungnam for men (–3.39%) and Gangwon for women (–0.03%).
Table 1
Age-standardized YLLs per 100,000 population by region from 1997 to 2015
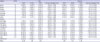
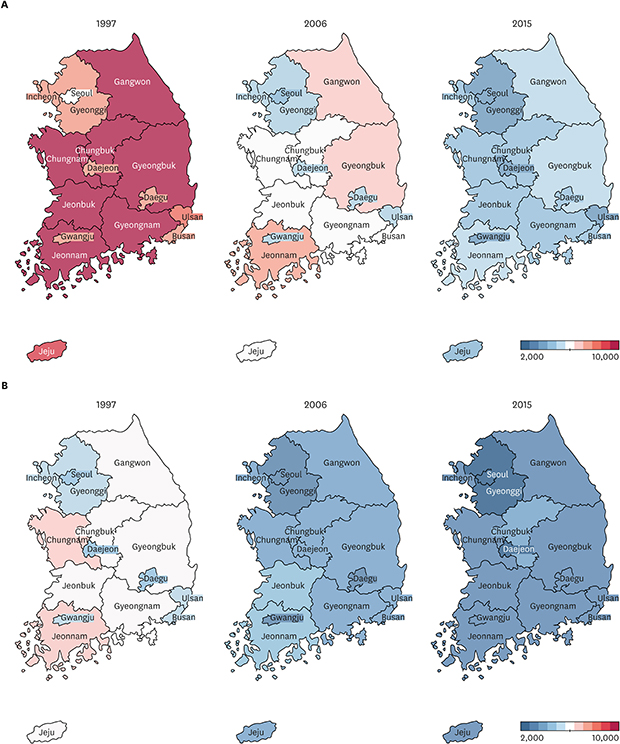
Fig. 1
Regional trends in age-standardized YLLs per 100,000 population from 1997 to 2015. (A) Men, (B) Women.
YLLs = years of life lost.

The differences in the YLLs between the regions with the highest and lowest value of YLLs declined. In men, the difference in YLLs per 100,000 population between Jeonnam and Seoul—the regions with the highest and lowest values of YLLs, respectively—decreased from 6,405.2 in 1997 to 1,863.3 in 2015, and the ratio of the two regions decreased from 2.06 to 1.52. In women, the difference in YLLs per 100,000 population between regions with the highest and lowest values of YLLs was decreased from 2384.9 in 1997 (Chungnam and Seoul) to 1096.7 in 2015 (Chungbuk and Seoul). The ratio of the two regions changed from 1.56 to 1.46.
The cause of premature death with respect to regional differences changed every year. Table 2 shows the 10 leading causes of YLLs, which represented the greatest differences between regions in 1997, 2006, and 2015 for men (Table 2A) and women (Table 2B). In men, the leading causes of YLLs in 1997 were accidents of motor vehicles with three or more wheels (Jeonnam, 1,443.1; Daejeon, 256.0), followed by cirrhosis of the liver (Jeonnam, 1,231.0; Seoul, 526.7) and ischemic heart disease (Busan, 831.1; Incheon, 365.4). In 2015, self-harm (Gangwon, 803.0; Sejong, 377.9) showed the greatest regional difference, followed by overexertion and strenuous movements (Sejong, 287.5; Daejeon, 32.9) and hemorrhagic and other non-ischemic strokes (Sejong, 352.1; Daejeon, 137.3). In women, acute bronchitis was the leading cause of YLLs and showed the greatest regional difference in 1997 (Chungnam, 721.3; Busan, 15.4) and 2006 (Jeonbuk, 452.9; Gwangju, 11.4). In 2015, overexertion and strenuous movements (Chungbuk: 214.7; Gangwon: 26.5) showed the greatest regional difference.
Table 2
Top 10 causes with the largest difference between the regions with the highest YLL and the region with the lowest YLL
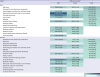
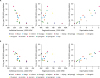
Fig. 2 illustrates the YLLs per 100,000 population in 17 Si and Do by regional characteristics. YLLs per 100,000 was significantly correlated with the deprivation index for both genders: the correlation coefficient (r) was 0.91 in men and 0.94 in women (P < 0.001). The higher the deprivation index, the higher the YLL, and the most vulnerable regions were Jeonnam and Gyeongbuk. There were no statistically significant correlations with the individual and regional income.
DISCUSSION
We estimated age-standardized YLLs and its differences in 17 Si and Do of Korean using the KOSIS data. YLLs decreased by year in all regions from 1997 to 2015. The YLLs per 100,000 population decreased from 1997 to 2015 by 27.4% (27.5% for men; 27.2% for women), and the proportion of YLLs in DALYs also decreased from 24.8% in 2007 to 17.0% in 2015. The favorable trends in YLLs are due to not only a decline in crude death rates over the last three decades12 but also an increase in life expectancy and an improvement in the prognosis of diseases owing to the advances in medical care. However, Jeonnam and Seoul were the highest and lowest regions between 1997 and 2015. Identifying regional health status allows us to understand the needs for health policies. In particular, if the goal is to reduce health inequalities, monitoring changes in health status over time with a reliable and valid method is essential. However, there is a lack of studies on the burden of disease by region in Korea. Given the geographic differences in health financing and performance13 and the challenges faced by the Korean healthcare system, a detailed understanding of the regional variations in the causes of premature death is crucial.
Of the 242 causes of YLLs, epilepsy showed the greatest differences in YLLs between the highest and the lowest region in 2015 (difference and ratio: 150.1, 20.2 for men; 105.7, 34.15 for women), and assault by bodily force (difference and ratio: 93.2, 15.46 for men; 132.6, 57.89 for women) was one of the leading causes of YLLs. The diseases which showed geographical differences were caused by injury and often classified as avoidable mortality (or amenable mortality), which might have been preventable if timely and effective health services were provided.14 A study conducted in Korea reported that metropolitan regions including Seoul and Gyeonggi have shown lower avoidable mortality compared to non-metropolitan regions, including Jeonnam and the bordering regions between Gyeongnam and Gyeongbuk over the last 20 years.15 Therefore, the central government should develop policies at a national level to prevent such diseases and thereby reduce the gaps in health status, and cause-specific policies need to be developed by local governments of regions with a higher burden of disease.
We also confirmed that YLLs were higher in the regions with a higher deprivation index. The association between the regional deprivation index and health gaps is consistent with the findings of previous studies, which have shown that the higher the deprivation index, the worse the health status.2151617 The studies on the association between regional variables and health outcomes were mainly based on two models with an assumption that the socioeconomic characteristics of a region may affect the health of the residents, even after controlling for individual health risk factors.18 The first model, known as the collective resource model, assumes that individuals in wealthy areas are more likely to have access to resources. The second model, known as the local social inequality model, assumes that the socioeconomic level of the individual and the community affect health status. In other words, the health of a poor person who lives in a wealthy region will be worse than that of a poor person who lives in a poor region. This study and most of the previous studies were based on the collective resource model with an assumption that the amount of available resources in the community is measured by an integrated deprivation index and that the better the indicator, the better the health status of the community. Despite the importance of capturing the health inequalities by the region, the estimation of the differences in the burden of disease by the region has not been conducted in Korea. The findings of the present study indicate the importance of a valid and reliable deprivation index that reflects the regional socioeconomic characteristics and the health outcomes.
There are some limitations to this study. First, we considered the Korean regional composition according to the administrative district Si and Do, due to limited data availability. Most of the health policies for a population are planned and implemented at a more specific administrative level, such as Si, Gun, and Gu. Thus, specific regional levels need to be assessed in future studies, which would be more meaningful to decision makers and policy-makers of regional health. Secondly, the study applied the life expectancy of the whole Korean at each age and gender. However, the application of the life expectancy by region could provide more accurate information. Thirdly, this study used the deprivation index developed in a previous study. In Korea, various indicators have been developed and used to measure inequalities within the community; however, studies on the deprivation index of the community have not yet been explored, and there is no social consensus on the index. When developing an indicator, there is a need to consider whether it is based on the fundamental principles of index development and limitations of available data. Researchers have applied different variables and methods of calculation in the development of an index to measure the degree of community deprivation. In other words, the practical and arbitrary choice of variables in the development of indicators provides a range of arguments, but if the variables that can reflect the local characteristics are not included, the indicator might not measure what it intends to. Therefore, it is important to develop indicators based on the fundamental principles of index development, considering the range of available data. Based on the theoretical basis of the social exclusion, this study investigated the common areas of social exclusion, substance depletion index, and adjusted developed index. However, the index used in this study was designed to assess disparities in mortality, and therefore, developing an indicator that reflects the outcomes of the burden of disease including YLL, YLD, DALY is necessary.
In conclusion, the present study found that YLLs—the index of premature death—differed by regions in Korea with specific causes. The findings of this study can be used by decision-makers to prioritize the reduction of regional gaps in premature deaths.
 XML Download