

 PDF
PDF Citation
 Print
Print


INTRODUCTION
Type 2 diabetes is a kind of metabolic disorder characterized by high blood sugar levels over a prolonged period.1 It occurs when the pancreas cannot produce enough insulin or when the human cannot appropriately utilize the insulin it produces. It is important because this is a disease itself but it causes many complications such as acute myocardial infarction,2 stroke,3 and chronic kidney disease.4 In addition, type 2 diabetes is a high burden disease. Prevalence is estimated at about 8.0% in Korea.5 The recent Korean National Burden of Disease study reported diabetes is the highest among 313 diseases using disability-adjusted life years (DALYs).6 Especially, years lost due to disability (YLD) contributed more than 93% of total DALYs.
Duration of type 2 diabetes is important. Morbid duration is an independent and critical predictor of developing complications.7 Many complications due to diabetes occur after 20 years of morbid duration of diabetes. In addition, in order to estimate incidence-based DALY, morbid duration should be obtained.8 This was calculated using the DisMod II software which was developed to estimate morbid duration on gender and age group.910 This software uses various parameters such as prevalence, incidence, morbid duration, mortality, remission rate, etc.
A Markov model is a mathematical health state transitional model which is used for economic evaluation in healthcare sectors and useful for decision analysis, especially for economic evaluation modeling.11 Using this methodology, in economic evaluations, we can estimate life years or quality-adjusted life years to input health state transitional probabilities and utility on each health state. Therefore, a Markov model has been used for identifying natural history or epidemiologic characteristics of various diseases including cancer, diabetic retinopathy, depression, HIV, sepsis, and clinically isolated syndrome.12131415 Especially, when information is limited, this approach could be helpful.
This study aims to explore an applicability of a Markov model to estimate the duration of diabetes in the Korea population.
METHODS
Markov model structure and assumptions
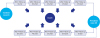
Primarily, we constructed the Markov models for diabetic patient cohorts with Markov states such as a diabetes state (gray color) and a death state (black color) for the estimation of duration of diabetes using the Microsoft Excel program 2010 (Fig. 1). It assumed that an incident case should stay in a diabetes state for one year, and after that, the case could still stay in a diabetes state or move to a death state. We also assumed that there was no cure for diabetes in the basic model so the probability to stay in a diabetic state depended on survival rates of type 2 diabetic patients. In this case (i.e., in the no cure assumption), duration of disease is exactly the same with life expectancy. A death state did not move anymore because the state was an absorbing state. In order to estimate the pure duration of diabetes, a discount rate was not applied in this model. Each diabetes onset by 5 years was considered from 30 to 85 years old or above and the median in each age group was used for the estimation of duration of diabetes in each group. The endpoint of the Markov was 100 years old.
Data resource and epidemiologic parameters of type 2 diabetes
We used the National Health Insurance Services-National Sample cohort (NHIS-NSC) that is a population-based cohort developed using NHIS claims data in Korea.16 Because Korea has adopted a social insurance system which covered all of the Korean population together with Medicaid of Korea, all diabetic patients' utilization data could be identified. The NHIS-NSC had about 1 million Korean people that were followed from 2002 until 2013.
Type 2 diabetes was operationally defined using the 10th revision of International Statistical Classification of Diseases (ICD-10) and prescriptions of anti-diabetic drugs according to the definition of previous epidemiology study of type 2 diabetes in this cohort data.17 From this cohort data, we obtained the survival probability for 5 years of the incident (I group) and existing prevalent cases (P group) in 2008, respectively. Existing prevalent cases meant prevalent ones excluding incident ones. For this, firstly, we identified classic prevalent cases (including both I and P group) in each year from 2005 to 2008. Because we assumed that type 2 diabetes was not cured, the prevalence of type 2 diabetes in 2008 was accumulated from 2005. Secondly, I group in 2008 was confirmed 3 years of wash-out period from 2005 to 2007. Thirdly, P group was defined by excluding I group.
Hypothetical diabetic patient cohorts on age and gender were construed and survival rates from both I and P group were applied to the hypothetical cohort. For survival data, both I and P group were followed up for 5 years for alive patients or until their death date for those who died. In I group, the index date was the first utilization date while the index date of P group was the first day of 2008. Each one-year survival probability was estimated from those 5 years accumulated survival probability using a probability to rate and the reverse formula follows as:
Lastly, recalculations and substitutions were done for some inappropriate data. In the women group, survival probabilities were reversed in the 50s of I group and 40s of P group. For example, the survival probability of the early 40s was lower than the probability of late 40s in the women I group. In those cases, values from 10 years data were used rather than 5 years of data. In addition, in the age group about the 90s, the survivals of diabetic patients were higher than those of the general public of Korea from the standard lifetable provided by Statistics Korea18 because of data limitation such as sample size. Therefore, in those cases, the survival probabilities of the general public were substituted (90 years or above in women and 89 years or above in men in P group, respectively).
Statistical and sensitivity analyses
Mainly descriptive analyses were conducted for this study. Initially, survival probabilities for 5 years on age and gender were obtained in I and P group, respectively, and those were displayed as survival curves. Then, durations of diabetic patients for a lifetime were estimated on incident age and gender using the Markov model. These durations were compared with those from the DisMod II program. Also, we compared these durations with life expectancies from the general public18 to explore the reductions of life expectancies due to type 2 diabetes. For model validation, in general public, life expectancy from the Markov model has compared life expectancy from the Life table.
In addition, sensitivity analyses were done in order to impact on the result by the no cure assumption and variation of parameters. Among various age groups, sensitivity analyses were conducted in the late 50s (55–59 years old group) because the average incident age of type 2 diabetes might be the late 50s. We considered several variables such as 95% confidence interval (CI) of survival probability (from lower limit of 95% CI to upper limit of 95% CI) and cure probability (0%–3%) for one-way sensitivity analyses. Especially, for sensitivity analyses using different cure probability, the Markov state for the cured was added to the initial Markov model.
RESULTS
The 5-year survival probabilities were obtained according to the age and gender group of the incident and existing prevalent cases (Fig. 2 and Table 1). The probabilities of 5-year survival on age group decreased substantially with age. For example, in the group of 30–34 years, the probability of incident cases was 98.5% and 97.7% in women and men, respectively. However, the probability in the group of 85 years old or above was 41.3% and 21.4%, respectively. In terms of gender, women diabetic patients were more likely to survive (from 0.4% to 20.0%) except for in the existing prevalent cases of the early 30s (−0.3%). For comparisons of the probabilities on the incident and existing prevalent cases, those of incident cases were mostly lower than those of existing prevalent cases in both genders of men and women.
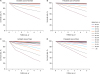
Table 1
Number of incident and existing prevalent cases
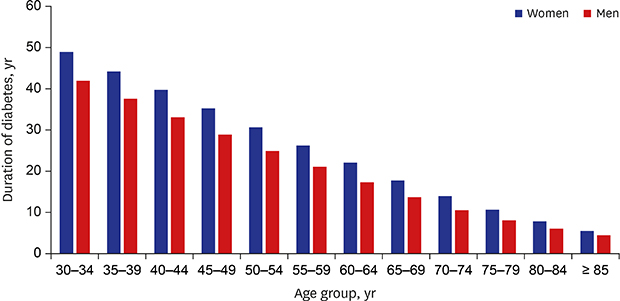
Duration of diabetes on incident age and gender were presented in Fig. 3. The duration of diabetes gradually decreased with incident age in both genders. In the early 30s, the duration was 48.9 and 41.9 years in women and men, respectively. It was estimated that diabetic patients who were treated for the first time at 85 years old or above might survive for 5.8 and 4.4 years in women and men, respectively.
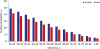
Table 2 shows the results of comparisons duration of diabetes from the Markov model with those from the DisMod II. In all age groups in both genders, durations from the DisMod II were smaller than those from the Markov model. Mean of difference was 0.7 year in men and 1.7 years (0.1–3.8) in women, respectively. While the difference of the early 30s was largest (1.6 years) in men, in women, the difference of the early 50s was largest (3.8 years).
Table 2
Difference in duration of diabetes between from the DisMod II and from the Markov model
In the average incident age group of type 2 diabetes (i.e., the late 50s), the reduction of life expectancy due to diabetes was estimated to be about two years in both genders (Table 3). In the early 30s, the difference was the largest at 3.2 and 3.7 years in women and men, respectively.
Table 3
Difference of life expectancy between the general public and diabetic patients
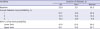
Table 4 represents the results to explore the validity of the Markov model. Differences in life expectancies of the general public between a Markov model and life table from Statistics Korea were from 0.3 to 0.5 in both women and men, respectively. All values of a Markov model on age and gender were systematically higher than those of the life table and mean of differences were 0.4 in women and 0.5 in men, respectively.
Table 4
Difference of life expectancy of general public between Markov model and life table
Sensitivity analyses on cure probability and 95% CI of survival probability were presented in Table 5. Firstly, as annual cure probabilities were increasing the durations of diabetes were reduced. While life expectancy was 26.3 and 21.1 years in the late 50s in the baseline, each duration was reduced by 8.7 and 6.2 years at 3% of cure probability in women and men, respectively. According to 95% CI of survival probability, ranges of life expectancy were 24.7 to 28.0 years and 19.5 to 23.2 years in women and men, respectively.
Table 5
Sensitivity analysis on cure probability and 95% CI of survival probability in late 50s
DISCUSSION
We have estimated durations of diabetes for lifetimes in Korea by age and gender using the Markov model with parameters from the NHIS-NSC. As my best knowledge, this is the first study to estimate the duration of diabetes for a lifetime using a Markov model. From this study, it was estimated that incident diabetic patients in their early 30s could live with diabetes for 48.9 and 41.9 years in women and men, respectively. Due to diabetes, the life expectancy reduction was estimated as 3.2 and 3.7 years in both genders, respectively. These results could be useful not only to calculate the burden of disease due to diabetes but to explore the economic efficiency of interventions on diabetes.
It is important to use the appropriate parameters for corresponding Markov states. In this study, survival probabilities of the I and P group were used. Generally, there are few data to directly follow up for a lifetime. In addition, incident cases generally were included in prevalent cases. Therefore, there could be a bias when the survival of classical prevalent group was used. Therefore, in this study, P group was defined as existing prevalent cases, that is, prevalent cases excluding incident cases. In addition, there could be some uncertainties in parameter19 although a large size of the cohort database was used for this study. In several young age groups, there were some years with 100% annual survival probability, and this could have happened by accident. Therefore, accumulated survivals for 5 years were re-calculated to determine 1-year survival probability, for the stability of the statistics. The probability of survival was reversed in some age groups. In a similar way, age groups were also pooled to obtain common statistics. In addition, in the very high elderly, the mortality of diabetes was lower than that of the general public. Therefore, survival probabilities from the general public were substituted in the model.
In this study, as expected, the earlier the diabetes mellitus occurred, the longer the duration of diabetes. In the women, the duration of diabetes in the early 30s was 48.9 years, while the duration in the late 50s was 26.2 years and 7.9 years in the early 80s. Durations of illness in men was shorter than those of women by 1.4 (85 years or older) to 7.0 years (30–34 years old) according to age group, and the differences decreased with age. The loss of life expectancy was 3.2 years for women and 3.7 years for men in the early 30s and that was 2.3 years for women and 2.4 years for men in the early 50s in this study, respectively. The losses were similar to those from previous studies.202122 These losses could mean years of life lost in the perspective of buden of disease.
With the results from DisMod II, each duration of diabetes from the Markov model were similar. In both genders, as age increased, the duration of diabetes decreased. However, duration of diabetes from the Markov model was larger in all age groups of both men and women. There could be two affecting factors for these differences. One was a difference of the parameter used, especially mortality. Among seven parameters for the DisMod II, we used incidence, prevalence, mortality, and remission rate. We used the same incidence, prevalence, and cure rate in the Markov model. However, death probability (i.e., all-cause mortality) was used from the diabetes cohort in the Markov model, while diabetes-specific mortality was used from the Statistics Korea in DisMod II.18 Conceptually, death probability in the cohort could be appropriate for estimating a duration of disease because death is the end point of morbidity. The other was overestimates in the Markov model due to the cycle assumption of 1 year. An event such as death can happen at any time, however, in this Markov model, the event was identified at the end point of the cycle. Therefore, it could make an overestimate. This could be improved by a shortening cycle or a half cycle correction.23
The life expectancy of diabetic patients was estimated in a study using national sample data.21 In diabetes alone in the study, the duration of the early 30s was 42.2 years and that of the early 50s was 25.9 years. The diabetic group had a 6.1% loss of life expectancy in the early 30s and 3.7 years in the early 50s compared to the non-diabetic group. The loss of life expectancy in each age group increased with an increasing number of cardiovascular comorbidities accompanied. In a Canadian study using the life-style method, the life expectancy of 55-year-old diabetic patients was 26 years for women and 23 years for men, and the difference in life expectancy between diabetics and the general population at this age was 4.6 years for women and 3.8 years for men.20 The life expectancy of diabetic patients was similar to that of the present study, and the difference in life expectancy of diabetic patients and the general population in Canadian studies was slightly larger than that of our study. A study that estimated life expectancy using 97 cohort studies showed that men with diabetes at 40, 50, and 60 years would lose about 6.3, 5.8, and 4.5 years of life, respectively. The corresponding loss of life expectancy lost for women with diabetes were 6.8, 6.4, and 5.4 years, respectively.22 There could be a limitation to the direct comparison of the results because there are differences in the execution time, estimation method, and the target population for each study. In several studies, the gap in life expectancy between diabetics and the general population in their 50s ranged from around 5 to 10 years.202122242526
We considered that the life expectancy gap in the general public was acceptable from the results of the model validation. The reason why the results from the general public were used for the model validation in this study was there is no true value on the duration of diabetes for a lifetime. Therefore, we used the model to estimate life expectancy by gender and age for the general public and compared with national life table data. The gap in life expectancy between the two estimates was slightly different in each age group but all were less than 5 months. The cycle of the Markov model in this study might affect the differences. Kang et al.21 also showed a similar life expectancy of diabetic patients by age group.
Considering the results from sensitivity analyses, curability could be a major factor to reduce the burden of diabetes in the perspective of YLD. The duration was shorter as the annual cure probability increased. It was in line with our expectations. However, the reduction is higher than our expectation. It could mean if diabetes could be cured the burden of diabetes would be dramatically reduced. But, it could be hard to cure diabetes.27 According to the conceptual meaning of cure in the Markov model of this study, a cure is a perfect recovery to a normal state. Although diverse approaches to cure diabetes are being investigated,28 such attempts still have a long way to go. There are some limitations in this study. Firstly, bias occurred due to characteristics of a Markov model. In the real world, an event like death could occur continuously, however, in a Markov model, event time is dependent on its cycle. Therefore, it could be a cause of bias. However, bias does not seem to be a big problem considering the difference of life expectancy between the model and life table. Also, if a cycle could be changed to be smaller such as 6 or 3 months, bias might be reduced in a future study. Secondly, a Markov model generally assumes constant transition probabilities. However, in the real world, those transitional probabilities could be varied on conditions. For example, the survival probability of a stroke patient with a prior stroke history could be lower than the ones without any prior history. Therefore, as researchers develop a Markov model, characteristics of disease should be considered. Thirdly, in the baseline analysis, we assumed no cure in diabetes. In fact, it could be hard to cure diabetes. However, nobody says it is absolutely not cured. Therefore, in this study, sensitivity analyses were done to explore this assumption. The results showed that this factor could affect the duration of diabetes. So, for a more valid study, further study would be needed on the cure of diabetes.
In conclusion, our present study estimated the duration of diabetes using a Markov model. The model seems to work well and diabetes could reduce life expectancy by about 2 years in the late 50s. This method could not only be useful to obtain the duration of illness but also to calculate DALYs directly. In addition, the estimated duration of diseases, life expectancy data using the Markov model could be used for policy makers, patients, and insurers. When all NHIS claims data can be used and the Markov model is sophisticated, we could get more accurate results.
 XML Download