

 PDF
PDF ePub
ePub Citation
 Print
Print


INTRODUCTION
Taste perception plays an important role in influencing individual food preferences and eating habits [12]. It is generally assumed that keeping a robust sense of taste is important in order to maintain good health. However, recent years have seen an increasing number of people suffering from taste disorders. According to the United States National Health and Nutrition Examination Survey between 2013 and 2014, taste disorders affected 26.3 million people (17.3%) based on a sample of 3519 men and women aged 40 years and older [3]. Similarly, approximately 20% of the general German population recognized only 3 or fewer of the 4 basic tastes of “sweet”, “sour”, “salty”, and “bitter” [4]. In Japan, the findings of a nationwide study between 2000 and 2002 reported that 240,000 people (0.2% of total population) were afflicted with a taste disorder. The data were almost 1.8-fold higher than those obtained in 1990 [5]. Although Ikeda et al. reported that the increase in number of taste disorders in Japan is influenced by aging [5], other studies reported that young women have an increasing rate of taste disorders [67].
Zinc deficiency is a known cause of taste disorders. In addition, other nutrients such as iron and vitamin B-12 are also reported to affect taste perception [8910]. Being underweight is also a risk factor for nutritional deficiency [1112], owing to insufficient zinc because of their low total nutritional intake. This is particularly a health problem amongst Japanese young women; it is reported that the proportion of underweight women (body mass index (BMI) less than 18.5) is greater than in people of other ages. In 2016, 20.7% of Japanese women in their twenties were underweight. Although this has declined slightly from 23.1% 10 years ago, the rate is still considerably high [13]. In addition, young people consume more fast foods, resulting in excess or deficiencies of some nutrients. Barnes et al. reported that frequent intake of fast food is related to high calorie intake and poor diet quality [14]. Therefore, since the dietary intake of young Japanese women is not well-balanced, there is a possibility that they may have a taste disorder caused by zinc deficiency at an early age. Moreover, taste perception is also influenced by psychological factors. Recent studies have shown a significant association between taste perception and mental health in young adults [1516]. Acute stress is associated with decreased sweet taste perception [15], whereas low anger or high fatigue levels are causative of decreased sour taste sensitivity [16]. Thus, the relationship between mental health and taste perception among young adults is inconsistent, and remains insufficiently examined. Furthermore, studies have also confirmed the association between menstrual blood loss and iron deficiency [717], and the effect of menstruation on taste perception should be regarded as a confounding factor; however, few studies have excluded the menstruation period when assessing taste perception.
The purpose of the study was to measure the 4 basic taste perceptions, nutrient intake, and mental health, and to examine the factors affecting insensitive taste perception in young Japanese women.
SUBJECTS AND METHODS
Subjects
This was a cross-sectional study conducted between June to September 2015. Subjects were young women in their late teens and twenties who were students and graduates of 2 universities in Osaka prefecture, Japan. The major exclusion criterion was subjects had no current afflictions from a psychological disorder. A total of 75 women took part in the study. This study was approved by the ethical committee at Osaka university (approval number: 326). Written informed consent was obtained from all subjects.
Procedure
Menstrual periods were avoided during measurements of the criteria. All subjects answered the self-reported questionnaires in totality concerning age, height, medical history, menstrual cycle, smoking, and taking medicines or supplements. Body weight was measured to the nearest 0.1 kg (MC-980A, Tanita Cooperation, Tokyo, Japan). BMI was calculated as body weight (kg) divided by the square of body height (m). Subjects were asked not to eat, drink, and undertake rigorous exercise 2 hours before measurements, and to urinate just before measurements.
Taste perception
Since the filter-paper disc (FPD) method is a reliable and highly reproducible method to measure taste perception [18], it was applied to measure taste perception of the 4 flavors: sweet, salty, sour, and bitter. The solutions used in the study were sucrose for sweet, sodium chloride for salty, tartaric acid for sour, and quinine hydrochloride for bitter. The concentrations of each taste were scored from disc number 1 (lowest) to number 5 (highest). The concentrations of number 1 to number 5 of each taste were as follows: sweet (sucrose: 0.3%, 2.5%, 10%, 20%, and 80%); salty (sodium chloride 0.3%, 1.25%, 5%, 10%, and 20%); sour (tartaric acid: 0.02%, 0.2%, 2%, 4%, and 8%); and bitter (quinine hydrochloride: 0.001%, 0.02%, 0.1%, 0.5%, and 4%). Number 6 indicated that the subject was unable to recognize even the highest concentration. Taste measurements were conducted by a single researcher who was trained by an otolaryngologist with taste expertise. Circular filter paper discs of 5 mm diameter (Taste Disc, Sanwa Chemical Inc., Nagoya, Japan) soaked in solutions of each flavor were placed on the area of the chorda tympani nerve of the tongue. We adopted the cutoff value used by Tomita et al. for this study [19]. That is, if the subjects were capable of “sensing” the concentration from disc number 1 to number 3, they were classified as having no problem with their taste. However, if the subjects were capable of “sensing” a concentration at higher than number 4, they were classified as having a problem with their taste. These classifications are commonly used in clinical practice in Japan. Briefly, the filter paper disc was first soaked in the lowest concentration. The examiner placed the disc on the right or left lateral part of the subject's tongue at 3 cm from the center of the tongue. The subjects reported what flavor they tasted. They selected 1 answer out of 6 options: sweet, salty, sour, bitter, I can taste something, or tasteless. If they could not recognize the correct taste, the tester applied the next concentration. Before the subject moved to the next taste, they were instructed to rinse their mouth in order to not mix the tastes. Taste perception was determined based on the correct concentration recognized.
Based on their taste perception determined from measurement using the FPD method, the subjects were divided into 2 groups: normal and abnormal taste perception. Regardless of flavor, if there is more than one abnormal taste perception among the 4 basic tastes, it is classified as an abnormal taste perception [20]. In this study, we classified subjects in the normal taste perception group if all four basic tastes (sweet, salty, sour, and bitter) were within the normal range of scores, and classified subjects in the abnormal taste perception group when more than 1 abnormal taste perception was perceived, regardless of flavor.
Dietary intake
Dietary intake of the previous month was assessed using a brief-type self-administered diet history questionnaire (BDHQ), which calculated the intake of approximately 30 nutrients and 50 foods using a dedicated calculation program based on the Dietary Reference Intakes for Japanese. The validation of the BDHQ was performed using the 16-day weighed dietary records of the Japanese adult populations [2122] and having a 7-point Likert Scale. The scales range from “more than twice per day” to “almost never”. In order to compare intake of subjects with the standard meal intake for Japanese people, we used measured values without energy adjustment. Subjects with unrealistic intake, who reported excessive or insufficient intake in the analysis (i.e., specifically, less than 600 kcal/day and/or 4000 kcal/day or more), were excluded from the study.
Mental health
The mental status of subjects was assessed using the Japanese translation of the Profile of Mood States (POMS) short version. The POMS short version is a self-administered questionnaire containing 30 items that describe 6 different moods as follows: “tension-anxiety”, “depression,” “anger-hostility,” “fatigue,” “confusion,” and “vigor”. The reliability and validity of the POMS short version has been confirmed using the POMS [2324]. Subjects were asked to describe their mood states on a 5-point scale ranging from “not at all” to “extremely”, during the previous 1-week period. The sum of the scores was calculated for each subscale, and subsequently a T-score (standardized score) was calculated using a calculation table for each subscale [24].
Statistical analysis
In all analyses, the Shapiro-Wilk normality test was used to assess normal distribution for continuous variables. The differences in basic characteristics between the 2 groups were compared using the chi-square test, Student's t test, or Mann-Whitney U test. Comparisons of nutrient intake and mental health between both groups were performed with a parametric t test or nonparametric Mann-Whitney test.
Linear regression analysis was used to identify factors related to insensitive taste perception. As each taste perception of the 4 basic tastes influences the nutritional status and nutrition-related chronic disease risk, it is important to have normal taste perception of the 4 basic tastes, regardless of flavor, for good health [2]. Therefore, we suggested a dependent variable, which was calculated by adding the 4 basic taste perception scores. Enhanced total scores of the 4 basic taste perceptions indicate insensitivity to taste. Since the data were not normally distributed, dependent variables were natural logarithm transformed. For the selection of independent variables, we selected zinc intake, tension-anxiety, and BMI, which are significantly related to taste perception in young people, according to the findings of previous researches [152526]. Statistical analyses were carried out using the SPSS software for Windows, version 24 (IBM Corp., Armork, NY, USA). A P-value of less than 0.05 is considered statistically significant.
RESULTS
Subject characteristics
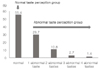
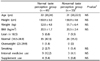
Totally, 74 subjects were included in the final analysis; 1 subject was excluded since she did not complete all question items regarding nutritional intake. All subjects were divided into 2 groups based on their taste perception as determined using the FPD method. Fig. 1 shows the distribution of subjects in the normal and abnormal taste perception groups. The percentage subjects with normal taste perception was 55.4% whereas the abnormal taste perception group accounted for 44.6% of subjects (29.7% with 1 abnormal taste, 10.8% with 2 abnormal tastes, 2.7% with 3 abnormal tastes, and 1.4% with 4 abnormal tastes). Subject characteristics are summarized in Table 1. No significant differences were observed in the basic characteristics and general health status among the two groups.
Nutrient intake
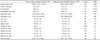
Differences in nutrient intake related to taste perception and mental health between both groups were examined. As shown in Table 2, there was no significant difference in most nutrients; however, the normal taste perception group had a higher intake of manganese as compared to the abnormal taste perception group.
Mental health
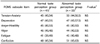
Table 3 compares the status of mental health between the normal taste perception group and the abnormal taste perception group using T-scores of the 6 subscales of POMS. No differences were perceived in the mental health among both groups.
Factors affecting insensitive taste perception
The results of liner regression analysis used to examine the factors that affect insensitive taste perceptions are presented in Table 4. It reveals that insensitive taste perception is significantly associated with lower zinc intake. The risk of insensitive taste perception was significantly decreased in women who took 5 mg to less than 7.1 mg zinc per day as compared to women who took less than 5 mg zinc per day (P < 0.05). No association was seen between insensitive taste perception and either the tension-anxiety score or BMI.
DISCUSSION
The purpose of the present study was to measure perception of the 4 basic tastes, nutrient intake, and mental health in young Japanese women, and to examine the factors that affected insensitive taste perception. Our study results suggest that insensitive taste perception is associated with lower zinc intake in young Japanese women in their late teens and twenties.
In our study, 55.4% of subjects had normal taste perception and 44.6% had abnormal taste perception. Similarly, in a study examining dysgeusia in young Japanese women, Nagai et al. reported that the ratio of abnormal taste perception was 63.2% for sweet, 50.0% for sour, 44.7% for bitter, and 42.1% for salty [7]. Additionally, 26% of the subjects were reported to have taste hyposensitivity among Japanese high school students [27]. These results indicate a high possibility that taste perception is impaired not only in the elderly, but also amongst young people.
The relationship between taste and mental health has been assessed in various studies. Several studies demonstrate altered taste perception under conditions of acute stress. Nakagawa et al. (1996) showed that sensitivity to bitter, sour, and sweet tastes decreases when people experience mental stress [28]. Meanwhile, Al'Absi et al. (2012) found that acute stress reduces sweet taste perception, but increases in cortisol concentration due to stress are related to salty and sour taste perception [15]. Another study (Ileri-Gurel et al., 2013) reported that individuals with a normal anxiety score had decreased perception for both sweet and salty taste [29]. Karita et al. (2012) examined the relationship between taste perception and mood states using POMS for Japanese female college students, and reported that high fatigue score and low anger score are associated with decreased sour taste sensitivity [16]. However, in our current study, we perceived no differences in mental health among both groups. In future research, it may be necessary to measure the blood concentrations of stress-related hormones such as adrenaline, noradrenaline, and cortisol, and to examine the relationship between taste and mental health in physiologically healthy individuals.
In this study, we conducted liner regression analysis, including variables of BMI, to examine factors that affect insensitive taste perception. Several previous studies have researched the relationship between obesity and taste [253031]. In obese adults, taste perception was reported to rise (bitter and sour), decrease (salty), or not change (sweet) [25]. Meanwhile, obese young adults had significantly higher salty taste perception than the normal-weight group [31]. Furthermore, extremely obese adolescents were reported to have higher taste sensitivity, particularly for sweet and salty, than those with a normal BMI [30]. In the current study, BMI was not identified as a factor affecting insensitive taste perception. We believe that since there was only one overweight person (BMI: 25.7 (kg/m2)), the results remained unaffected. Moreover, methods of measuring taste perception differ between studies. The FPD method used in this study has been previously validated [18].
A recent study concluded that sufficient zinc intake is important for taste perception, even in young woman [26]. In our study, the risk of insensitive taste perception significantly decreased in women who took 5 mg to less than 7.1 mg zinc per day, as compared to subjects who consumed less than 5 mg zinc per day. The reason why there was no significant difference in the group with the highest zinc intake may be due to the sample size. Zinc plays an important role in maintaining normal taste perception. Ikeda et al. reported that zinc deficiency slows the metabolic time of taste cells and can cause taste disorders [32]. In addition, gustin, an important protein related to taste, binds to zinc. Zinc deficiency may result in gustin deficiency, which in turn reduces the taste sensitivity [33].
We acknowledge there are several limitations in this study. First, as our data were cross-sectional, the causality could not be confirmed. Second, the generalizability of this study may be limiting. The subjects were not recruited using random sampling. Therefore, subjects who were interested in health may have been more enthusiastic to take part in the study. However, regardless of taste perception, the intake of most nutrients in both groups were less than the recommended amounts. Third, with regards to taste measurement, although we considered the menstrual period, we did not collect data separately for the follicular phase and luteal phase. Some studies report that taste preferences change during the menstrual period [34353637]. In future research, it is necessary to examine the relationship between nutrient intake, mental health, and taste perception in the follicular phase, luteal phase, and menstrual period. Finally, we only measured nutrient intake using a self-administered questionnaire. It has been demonstrated that there is a linear correlation (r = 0.62; P < 0.001) between dietary zinc intake and serum zinc concentrations in young female students [38]. Therefore, zinc intake by a validated questionnaire was measured in this study.

 XML Download