

 PDF
PDF ePub
ePub Citation
 Print
Print


INTRODUCTION
Susceptibility weighted imaging (SWI) is a technique which is sensitive to compounds that generate a local magnetic field and is useful for detecting deoxygenated hemoglobin, calcification, and iron content (12345). Recently, several studies have shown that SWI has the potential to detect spinal cord injury leading to hemorrhage (45) and visualize veins in tumor patients (6). In addition, SWI can be useful for assessing the structural integrity of the cervical spine, which plays an important role in many neurological disorders.
In the cervical spinal cord, the spatial and temporal field changes originating from external sources interfere with acquiring accurate SWI. Because of its anatomy, variations of the B0 field are complex, and this spatial variation causes intravoxel dephasing artifacts. This problem can potentially be handled with a careful adjustment of the shimming procedure (78). However, physiological motion due to respiration makes temporal B0 fluctuations generating artifacts such as ghosting, especially in the phase encoding direction (9). This phenomenon is apparent in the cervical spinal cord because it is close to respiratory-induced organs such as the lungs. A recent study has found that the frequency shifts occur at approximately 10 Hz in the C1 region and up to 74 Hz in the C7 region at 3T, which was measured between the inspiration and the expiration phase (10).
To overcome artifacts caused by respiratory-induced motion, several methods have been presented such as breath-holding, respiratory gating, and navigation (11121314151617181920). Although clinically useful, breathing-holding requires patient co-operation which can limit the spatial coverage or resolution (11). Respiratory gating method typically requires increased acquisition time (12). The navigator approach offers ways to overcome both of these limitations by monitoring the motion during the scan and using the information to guide data acquisition and/or reconstruction accordingly. Navigator echo approaches have widely been used in functional MRI, diffusion imaging and other imaging techniques (1314151617181920). Typical navigators are one-dimensional, but multi-dimensional navigators have also been used (1518). Normally, the navigators are able to detect B0 field changes, bulk translational or rotational motion. In the case of spine imaging, there is a severe field variation due to respiration, so the detection of B0 field variation through the navigators is highly needed (10). Also, SWI is significantly influenced by B0 variation, these factors should be mitigated (1719).
Conventional navigators have typically placed after the radio-frequency (RF) excitation and prior to the readout gradient. The sensitivity of SWI raises a question as to whether navigators should be placed either before or after the readout (21). The signal to noise ratio (SNR) of navigator signals change depending on the location of navigator echo. Also, since tissues such as spinal cord, muscle, fat, cerebrospinal fluid (CSF) have different T2* relaxation time, the contribution to the navigator signal can vary depending on the position of the navigator. In addition, since many vessels are distributed in the cervical spine, navigators can be affected by these blood vessels. For these reasons, detection of the B0 fluctuation in the spine can be sensitive to the position of the navigator echo.
In this study, the B0 fluctuations from respiration were analyzed and compensated in SWI of cervical spinal cord using a navigator echo approach. Specifically, a double navigator approach, i.e. using navigators both before and after the image readouts was implemented and tested. The influence of these navigators which acquires the center line of k-space to track effects of respiratory-induced changes was compared regionally over the cervical spine. Ultimately, our goal is to propose a compensation method which could potentially improve the quality of SWI in cervical spine imaging.
MATERIALS AND METHODS
Data Acquisition and Image Reconstruction
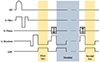
Figure 1 shows the multi-echo gradient echo pulse sequence diagram proposed in this study. A 2D acquisition was used since it is inherently motion insensitive compared to 3D acquisition under comparable scan times (22). Navigator echoes were placed at the beginning and end of the readout. A total of five echoes were acquired. The first and last echoes were used as navigator echo while the other three echoes were for imaging. The scan parameters were; imaging echo time (TE) = 13.69, 20, 26.31 ms and navigator TE = 7.38, 32.62 ms, repetition time (TR) = 968 ms, and flip angle (FA) = 68° (corresponding to the Ernst angle for T1 = 1000 ms, TR = 968 ms). The readout direction was left-right (LR) direction and, the readout bandwidth was set at 341 Hz/px. Navigator readout was also LR direction. A total of 16 slices were obtained with 0.5 × 0.5 mm2 in-plane resolution with 3 mm slice thickness. The acquisition matrix size was 384 × 384. Generalized autocalibrating partially parallel acquisition (GRAPPA) reconstruction (23) was used for the multi-echo sequence to reduce the total acquisition time (reduction factor 2). Flow compensation gradient was used in the slice-select and readout direction. Second order shimming was performed in the prescan to reduce spatial B0 inhomogeneity. A spatial saturation band was placed over the anterior part of the spine for artifact reduction coming from the surrounding structures. The total acquisition time was about 4 min. Since the acquisition used an interleaved multi-slice method, the navigator for each slice had an effective sampling frequency of approximately ~1 Hz.
Five healthy volunteers with no history of spinal cord injury and two patients (one tumor patient and one hemorrhage patient) were imaged under the approval of the local Institutional Review Board. All experimental data were acquired with a 3T clinical scanner (Siemens Tim Trio and Verio, Erlangen, Germany) with a four-channel neck coil.
The SWI was created by using both the magnitude and phase images as in reference (3). To improve the SNR, a model-based temporal domain denoising method was used in both magnitude and phase image (24). Specifically, the decaying magnitude signal of the three imaging echoes was fit to a mono-exponential model on a voxel-by-voxel basis in the temporal domain. For the phase signal, a linear fitting was applied in the temporal domain for denoising of phase images. A 120 × 120 matrix high pass filter (tukey window) was applied to remove the background static field variations. A negative phase mask was multiplied four times to the original magnitude image to create the SWI.
Compensation of Respiratory Noise
The two navigator echoes were placed before and after image readouts as previously described (Fig. 1). They were acquired at every TR to monitor the B0 field fluctuation caused by respiratory-induced motion for each slice. The signal of these navigator echoes was used to compensate respiratory induced B0 fluctuations during image reconstruction. The procedure was similar to that described in reference (17). First, a complex image projection data was produced along the readout direction by applying inverse Fourier transform to the raw data of navigator echo signal along the readout direction (x). The complex projections were low-pass filtered along the readout direction (x) in order to remove high frequency noise components. The phase difference between the N-th TR, ØN and the reference phase encoding step, Øref , which was normally picked as the first TR, was then calculated for each spatial point x. The resulting phase differences were averaged over the readout direction. Finally, the phase differences from the first and second navigator echoes were applied as an inverse value of this phase offset to the imaging data to each phase encoding step, N, according to the following equation.

where SN,cor and SN,original are the signal after and before correction, respectively. TEnav represents the echo time of the navigator echo (either 7.38 ms for the first navigator or 32.62 ms for second one). The decision to use the first echo or the second echo is determined by monitoring the quality index value as described below.
Quantitative Assessment
SNR has conventionally been used as an important index of image quality in MR images (25), but it is not a sensitive marker to respiratory-induced artifacts which often appear as signal intensity being mis-mapped to incorrect spatial locations. Also, respiratory-induced artifacts propagate over the image and into the background and corrupt the expected noise distribution in the affected regions. Thus, several groups have proposed methods to automatically quantify the level of motion artifacts in images (2627). In this study, the automatic quality index (QI) which was used as a metric associated with motion artifact was used to assess overall image quality (27). Detailed principle and algorithm of QI are described in ref (27). A brief description is as follows. The algorithm consists of extracting artifactual voxels, Xartifact, from the background. A set of artifactual voxels, Xartifact can be produced by simple thresholding method (27). The QI can be defined by the following

where i represents the signal intensity.
The QI was measured for the cases of 1) before correction, 2) after correction using the first navigator, and 3) correction using the second navigator. A student t-test was used for statistical analysis.
RESULTS
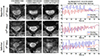
Figure 2 shows the gradient recall echo (GRE) images before and after compensation and the B0 fluctuation patterns from first and second navigator echoes in the three different slice locations. In all slices, an additional oscillation of the field at approximately 0.2–1 Hz (mean value 0.4 Hz) corresponds to respiration can be observed. Depending on the slice location, the two navigator signals have different patterns as illustrated on the right side of Figure 2. As an example, for the 10th slice (C4 level), the pattern differences between the first and second navigator echo is negligible. However, for the 5th (C6 level) and 12th (C3 level) slices, there is a quite difference between the first and second navigator signals. In the 5th slice, the pattern itself looks similar, but the value appears to be amplified for the first navigator signal compared to the second navigator signal. In the 12th slice, the patterns show distinct differences between the two navigator signals. Because of these differences between the first and second navigator signals, the quality of the corrected image is also influenced by which navigator echo is used for compensation as shown. In the superior slice, structure detail is clearer when the second navigator was used for correction. In the inferior slice, on the other hand, images with compensation using the first navigator produces visually a better quality.
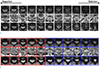
Figure 3 is magnitude images, phase images and SWI of representative 11 slices from one healthy volunteer before and after compensation for respiratory-induced artifacts. Compensation through the use of a navigator clearly demonstrates an improvement in the GRE and SWI of the cervical spine. The blue box and red box represent the compensated images using the first and second navigators respectively, selected automatically using the QI metric.
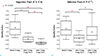
Figure 4 shows the QI values of the five volunteers in terms of the superior and inferior regions of the spine. The QI value in the inferior part (0.043) is higher than that in the superior part (0.031) indicating the inferior part has more severe motion, consistent with intuitive expectations. After correction, both navigators reduced the background noise from ghosting artifact according to the reduction of QI. In most parts of the superior regions of the cervical spinal cord (C1–4 level), the second navigator resulted in the most improved compensation performance (QI = 0.024, P < 0.005) even though the first navigator also showed statistical improvement (QI = 0.026, P < 0.005) compared to the original image. In the inferior regions of the cervical spinal cord (C5–7 level), the first navigator showed better performance (QI = 0.033, P < 0.005) compared to the correction using the second navigator (QI = 0.035, P = 0.03).
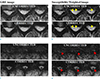
Figure 5 shows the results of a tumor patient (a, b) and a hemorrhagic patient (c, d). The GRE images (a, c) and SWI (b, d) before and after compensation of respiratory-induced artifact were provided. In the tumor patient, the tumor was located in the superior part of the patient's cervical spinal cord (C1 level). The images were compensated using a second navigator selected with QI metric. The compensated images have reduced noise and produced clearer images in both the GRE image and SWI. After compensation, the micro-hemorrhage or vascular structures containing deoxyhemoglobin (yellow arrows) can be visually detected in the SWI. In the hemorrhagic patient, the hemorrhage was located in the inferior part of the cervical spinal cord, and the first navigator led to better compensation and finally used. A hemorrhagic lesion can be seen in the corrected images (red arrows). In this case, micro-hemorrhage is difficult to diagnose because the breathing condition of this patient was significantly unstable, and the images suffered from severe motion artifacts. Compensation using the navigator has increased the utility of GRE and SWI in the cervical spinal cord.
DISCUSSION
In this study, we proposed a compensation method for respiratory motion using double navigator echoes for cervical spinal cord SWI. Respiratory-induced artifacts have a significant effect on the GRE images, thus limiting the number of studies of SWI in the cervical spinal cord (4). While much previous research (131417192829) focused on the motion correction using a single navigator echo, this work found that utilizing double navigator echoes would be better performance because the different echo time of the navigator echo leads to the different effect depending on the level of the cervical spinal cord. It was observed that in most of the inferior regions, compensation using the first navigator echo is more advantageous than the second navigator echo. Also, the second navigator echo was preferred in the superior regions.
These two navigator echoes are mutually supplementary in cervical spinal cord imaging. Hence, motion compensation using double navigator can increase the reliability of the cervical spinal cord SWI compared to using a single navigator. The optimal echo time of the navigator may vary depending on the cervical spinal cord level. While the corrections were done separately for each navigator, a phase correction from the combined signal of both navigators (e.g., weighted sum) can be done. We have tried this (work not shown), however, the results did not improve much compared to individual navigator correction.
The navigator correction improved the visual quality of SWI and GRE. A separate metric (i.e., the QI value) which can effectively evaluate image intensity corruption in the background due to motion artifact, was used to quantify these improvements and automatically select better navigator. The QI values were decreased by 50–70% after compensation in both cases. However, compensation of each navigator showed different results. The mechanism behind why these values and the image quality improvements depend on the navigator position for different regions is not clear. There seems to be a tradeoff between the ability to observe phase changes due to motion while avoiding phase wraps. For example, for the first echo (TE ≈ 8 ms), the amount of phase changes due to motion in C1 (assuming a 10 Hz field change) is approximately 0.16 π which might not be a value sensitive enough for detection. Hence the second navigator echo seems to produce more dynamic range. On the other hand, the amount of phase variation from the motion in C7 (assuming a 70 Hz field change) is approximately 4.7 π in the second navigator echo (≈ 32 ms), therefore phase wraps in the image can be present. In this case, the wrapping makes inaccurate information and then the first navigator echo would be preferred. In this perspective, the optimal echo time of the navigator will slowly shift from the earlier position to the later position as one move from inferior to the superior in the cervical spine.
Another possible explanation for the preference of the second navigator in the C1–C4 level is that diverse tissues which affect navigator signals have different T2* relaxation time. The anatomy near the cervical spinal cord is complex that includes fat, muscle, and many blood vessels. For compensating the effects in the cervical spinal cord imaging, it is important that the navigator data detect signals coming from only the spinal cord region, which is the target of the compensation. In the first navigator echo case, however, signals from fat, muscle and blood vessel are non-negligible, thus it can contaminate the purity of the navigator signal. In contrary, the most signal of the second navigator echo comes from the cervical spinal cord because muscle/fat has short T2* relaxation time.
The double navigator approach may induce scan time increase or loss of image SNR. In this study, the two navigators were implemented inside the imaging multi-echo readout thus no separate RF or module needs to be present, which minimized the scan time increase. Also, the navigator echo could be obtained at a high bandwidth condition to reduce the loss of SNR or contrast to noise ratio in imaging.
Although we focused on SWI in this study, we expect that the proposed method can be used for quantitative images like R2* mapping and quantitative susceptibility mapping (QSM). If the proposed method can be applied, it would be very helpful to diagnose iron deposition or demyelination disease in the cervical spine.
In conclusion, we proposed a double navigator method to record the phase shift and compensate for the respiratory-related changes. After compensation, quality improvement of the cervical spinal cord SWI was shown, which is a useful tool for detecting hemorrhage as well as spinal cord tumor and ultimately a valuable methodology for the diagnosis of spinal cord injury.
 XML Download