

 PDF
PDF Citation
 Print
Print


INTRODUCTION
Natural disasters present significant and increasing health risks. In addition to the direct health impacts resulting in mortality and morbidity,123 they also have indirect health impacts due to deterioration of health resources and social capital, leading to ill health2 and increased health inequality.45 According to the Centre for Research on the Epidemiology of Disasters (CRED), more than 216 million people worldwide were affected by natural disasters each year between 2003 and 2012. The United Nations Office for Disaster Risk Reduction (UNISDR) reported that the overall disaster-related economic losses were estimated between 250 billion and 300 billion USD.
In Korea, typhoon and torrential rain are the most expensive and deadliest natural disasters.6 Heavy precipitation and storms lead to mortality, injury, mental disorders, and other adverse health impacts.7891011 Over the last 20 years, weather-related disasters have accounted for 90% of disasters, which represent an increase of 14% compared to the previous decade.12 The Emergency Events Database (EM-DAT) reported that weather-related disasters have claimed 606,000 lives over the last 20 years. Floods accounted for 47% of all weather-related disasters and storms, including hurricanes, cyclones, and storm surge, and have been the second most frequent natural disaster since 1995.12 The incidence and strength of weather-related disasters are likely to be increased owing to anthropogenic climate change in particular.131415 Korea is not an exception and is expected to face increased damage from heavy precipitation and typhoon.
Along with the increased risk from climate change, an increase in adverse health effects is expected due to the upward trend of population growth in disaster-prone regions.1216 Korea has a disaster mortality of 27 per annum with an annual loss of 580 million USD over the last ten years.6 These figures and those in previous studies, however, have omitted most health effects from disaster and are unable to fully capture the social burden of health risk considering losses due to premature mortality as well as other disadvantaged health conditions associated with disasters. Consequently, a comparison of the social burden across disasters or populations is needed.
From a sociocultural perspective, the concept of the social burden of a health risk should address changes in household behaviour and decisions caused by disease or injury attributed to health risks and resulting social costs. While the social burden of disease is not quantifiable, the social burden associated with a health risk is fundamentally an economic approach, using the term social as a subset of economic.17 The World Health Organisation (WHO) therefore developed the disability-adjusted life year (DALY) method to calculate the loss due to premature mortality, illness, or its consequences. Although summarizing different health statuses into a single number may lead to an ethical debate,18 comparability across age, sex, and health risks may compensate for this weakness. The concept of DALY has been globally adopted as a tool for the comparison of the burden of disease to aid in policy priority establishment, to identify disadvantaged groups, and to target health interventions.19
Better knowledge of the causes of death and types of injuries and illnesses caused by disasters and the population most vulnerable to natural disaster is essential to determining an effective public health response.202122 Unfortunately, there have been few studies and little consensus on these issues. Although there have been numerous studies of the economic costs of different types of disasters, there have been few studies on the burden of disease from natural disasters from the perspective of social burden. Previous studies on populations vulnerable to natural disaster suggest that general notions of vulnerability during disaster are insufficient. For example, women, especially poor women in some countries, are more vulnerable to a particular type of disaster,22232425 but it remains inconclusive whether woman are more vulnerable to disasters in general.2627
Therefore, we aimed to study the health effects associated with the most significant natural disasters, typhoon and torrential rain, in Korea. First, we adopted the concept of DALYs to estimate the wider health effects associated with natural disaster within the notion of burden of disease. This encompasses the direct and indirect health effects associated with natural disaster from a social perspective. It also allowed us to describe the causes of burden of disease associated with natural disaster. Second, we estimated DALYs across the types and intensities of disasters in order to describe their variation. This allowed us to determine which populations in Korea were more vulnerable to a certain type or intensity of natural disaster. Third, we estimated DALYs by sex and age group. This described the differences in burden of disease between subpopulations and examined the most vulnerable populations in a Korean context.
METHODS
Definitions
Typhoon and torrential rain
According to the World Meteorological Organization, a typhoon is “a tropical cyclone with maximum sustained winds of 64 knots or more near the centre in the western North Pacific,” and typhoons are categorized into four different intensity groups according to the maximum core speed based on the typhoon criteria of the Korea Meteorological Administration: 17–24 m/s (weak), 25–32 m/s (moderate), 33–43 m/s (strong), and 44 m/s and higher (very strong). Torrential rain is defined as ‘heavy precipitation in a limited region and time and continuing for tens of minutes to 2 hours in a 10 to 20 km’ radius according to the definition of the Korea Meteorological Administration.28
The criteria for selecting instances of typhoon and torrential rain for the present study were established with consideration for the time span of the available health dataset, nationwide and direct impact, variety of scale, registered disaster in the Korean Statistical Yearbook of Natural Disasters, and exemption of overlapped events in order to reduce confounding effects or synergy of disasters.
Health outcomes
Natural disaster-associated health outcomes were defined in the present study as accidental death, injury and injury-related infection, and mental disorder. Accidental death in this study was defined as death from the causes coded by the International Classification of Disease 10th Revision (ICD-10) as electric shock, building collapse, fall, traffic accident, drowning, injury due to diastrophism caused by a storm, and injury due to a landslide. In this study, injury and injury-related infection are conditions coded in the ICD-10 as fractures, internal organ injuries, crush, or wound, as well as cellulitis, a proxy diagnosis of skin injury, and sickness caused by hypothermia, suffocation, lightening, and electric shock. Mental disorder patients were restricted by a principle diagnosis coded by the ICD-10 as depression, anxiety disorder, or stress disorder.
Data sources
For the incidence of disease and injury estimation, we used the claim data from the National Health Insurance Service (NHIS) of 2002–2012. Korea adopts a single national insurer system with a universal coverage of almost 100% of the population including foreigners. Being under a fee-for-service system of the health cost payment, all the claims are comprehensively collected by a central service organization, the Health Insurance Review and Assessment Service (HIRA), since its establishment in 2002. The HIRA claims dataset consists of details of individual claims for healthcare services including diagnoses in the ICD-10, age, sex, address of patients, and health insurance status. The Causes of Death Statistics 2002–2012 report published by Statistics Korea was used for the excess mortality estimation in association with heavy precipitation and typhoon. Information on the type, intensity, date, and duration of typhoon and torrential rain were obtained from the Korean Statistical Yearbook of Natural Disasters published by the Ministry of Public Safety and Security.6
Analytical approach
Study design of excess mortality and morbidity
A case-crossover design was used to estimate mortality and morbidity during disaster periods. The cases were the population exposed to an event of the natural disaster during a two-week period, including the first day of the event, and controls were the population in the same geographical region for two weeks prior to the day of the event.
Incidence rates capturing morbidity could be overestimated as a result of erroneous inclusion of prevalent cases which occurred at their true incidence prior to the period of interest.29 To improve accuracy and reduce excess incidence calculation, we identified first-ever events. We established an individual ‘episode’ of a sequelae incidence per patient and per sequelae (Fig. 1). Any patient who visited healthcare services and was diagnosed with a certain sequela were defined as a sequelae episode, and any revisit within one month from the last visit for the same sequelae was considered the same episode. For example, if a fracture patient was initially diagnosed at his/her first claim of healthcare use to the NHIS, and he/she used any medical service for the same diagnosis on the 7th, 20th, and 30th days after the first visit, then all those cases were regarded as one episode. In other words, if the patient revisited within 30 days of his/her last visit, it was considered to be one episode. However, if the patient visited healthcare services on the 35th day after the most recent visit to the health service with the same diagnosis, then this was defined as a separate episode. Finally, we counted only new episodes during the case or control periods, and any episode first diagnosed before the control or after the case period was exempted.

Duration of illness
The average duration of episode per sequelae was calculated as the average number of days of a patient's prescription plus additional days of visits to the healthcare service with the NHIS data according to the type of healthcare service use, including outpatient and inpatient. We did not consider the entire period to the end of sequelae as the duration of illness; instead, we applied a conservative estimation, counting only the days of medication or treatment (Fig. 1). This procedure was chosen because, during the episode period, patients may have recovery without treatment and this means the burden of disease in that period was not significant.
DALY calculation
The DALY method was the core approach used in this study to estimate the natural disaster-associated burden of disease. The DALYs consist of the sum of the years of life lost (YLLs) due to premature mortality in the population and years lost due to disability (YLDs) for people living with a health condition or its consequences.
YLLs basically correspond to the number of deaths multiplied by the standard life expectancy at the age at which death occurs. The YLLs in association with natural disaster were calculated as the product of the excess number of deaths and the life expectancy at a given age stage.
The YLDs can be calculated by either a prevalence-based or incidence-based method.30 While the recent global burden of disease (GBD) 2010 study based the YLD calculation on prevalence rather than incidence, we used the incidence method because plausible incidence data were available. For acute disease and the acute phase of most injuries, ‘prevalence’ has little significance, and New Zealand's burden of disease study also adopted incidence methods for injuries.29 In addition, natural disaster occurs at a certain point of time, and its impact on population health is only detectable within a short period of time as excess incidence in the NHIS data, because the immediate disaster impacts fade, and other confounding factors increase with time. For the YLDs associated with natural disasters, the number of excess incidents during a disaster period compared to the control period was multiplied by the average duration of the disease and disability weight (DW).
DW
DW is a weight factor that reflects the severity of a disease on a scale from 0 (perfect health) to 1 (death). Consistent with the GBD 2010 study, neither YLLs nor YLDs were age-weighted or discounted.
We applied the DWs of the New Zealand burden of disease study for several reasons. DWs can be affected by the social, cultural, and environmental context of a nation.31 The GBD 2010 study involved various nations in different contexts, and the global DW used in that study may have differed from the condition of Korea, which ranks higher in health and economic status than the global average. Currently, the Korean DW is not available, and New Zealand has much in common with Korea with regard to economic and population health status. It is also similar in terms of gross domestic product based on purchasing power parity per capita, healthcare provision (mix of private and public providers), and life expectancy at birth. In its practical aspects, New Zealand's DWs are more detailed in the sequelae of injuries and mental disorders and may be more suitable to Korea than the GBD 2010 new DWs.
Each sequela of injury or disease was matched according to the ICD-10 code, and weighted averages of the DWs per diagnosis or cause for inpatient and outpatient condition were calculated by the number of incidence episodes (Supplementary Table 1). If only mild/moderate/severe DWs were available, the mild and moderate DWs were applied for outpatient and inpatient cases, respectively. The DWs for long-term or severe conditions were not used because the NHIS data have no information regarding severity. When the DW for a certain sequela of injury or disease was not available, we borrowed the smallest DW of the closest sequelae of injury or disease in the ICD-10 code system in order to produce a conservative estimation. Finally, the DW for each case was the weighted average of each disease group and type of health service used.
RESULTS
Natural disaster profiles
From 2002 to 2012, 29 typhoons affected Korea, and 22 typhoons landed above 33 degrees of latitude, about 3 typhoons annually during this period. Of these, 11 typhoons met our study criteria, 4 typhoons (36.4%) were classified as strong or moderate, and 3 typhoons (27.3%) were classified as weak (Table 1). There were no typhoons included in 2005, 2009, and 2011 either because of their absence or complication of weather events. The average maximum typhoon wind speed was 31.1 km/s, and the average maximum typhoon speed was 39.5 m/s, 30.5 m/s, and 21.0 m/s for strong, moderate, and weak typhoons, respectively. Strong typhoons were mostly concentrated at the end of August and beginning of September in Korea.
Table 1
Characteristics of analysed typhoons from 2002–2012
There were five torrential rain events fitting our criteria, varying from weak to strong, from 2002 to 2012 (Table 2). Nationwide torrential rain, often leading to flooding and serious effects,32 is a more common event than typhoons, and the average number of torrential rain events was about six per annum in Korea from 2002 through 2012. According to Cheong et al.,33 strong, moderate, and weak torrential rains accounted for 1.6%, 30.2%, and 68.3% of all torrential rain events, respectively, in Korea. In Korea, more than half of the annual precipitation falls during the one-month monsoon season in summer,32 and torrential rains occur mainly from July to August. Most of the torrential rains included in the present analysis affected more than 80% of the population in Korea, and some affected areas were declared as special disaster areas. The intensity scale and categorization of torrential rain are not yet established, and we categorized rains according to maximum daily precipitation, which has good association with number of deaths (correlation coefficient 0.872, P = 0.054).
Table 2
Characteristics of analysed torrential rain cases from 2002–2012

Burden of disease associated with typhoon
Estimated mean DALYs per 100,000 population per event associated with typhoon were standardized by age and sex and are presented in Table 3 according to typhoon intensity and cause of disease. The mean DALYs of the ‘strong,’ ‘moderate,’ and ‘weak’ events were 107.6, 30.4, and 36.6 per 100,000 population per event, respectively. The YLLs, YLDs, and total DALYs associated with a strong typhoon were higher than those for a weak typhoon. However, the DALYs associated with a moderate typhoon and a weak typhoon were similar, although weak typhoon-associated DALYs were slightly higher than those of a moderate typhoon.
Table 3
Typhoon-associated standardized burden of disease by intensity (per 100,000 per case)

The YLLs explained about 99% of DALYs associated with typhoon regardless of intensity. The interquartile ranges of the YLLs for moderate and weak typhoons overlapped, as the weak typhoon-associated mean YLLs were widely dispersed. One interesting finding was that weak typhoon-associated mean YLLs were greater than those of a moderate typhoon, in contrast to Table 1, the data from the Korean Statistical Yearbook of Natural Disasters, which shows that weak typhoons had significantly fewer victims and deaths than moderate typhoons.
The mean YLDs associated with torrential rain were smaller than the mean YLLs but still meaningful, because the mean YLDs show a trend of incremental increase according to typhoon intensity. Injury-induced mean YLDs associated with typhoon abruptly increased with a strong typhoon (0.78 YLDs per 100,000 population per event), and this was more than 25 times higher than that of a weak typhoon (0.03 YLDs per 100,000 population per event). Mental disorder-associated YLDs associated with typhoon increased with a moderate typhoon (0.22 YLDs per 100,000 population per event) and was more than seven times the YLDs for a weak typhoon (0.03 YLDs per 100,000 population per event). Therefore, there might be different thresholds for different causes of illness.
Estimation of the burden of disease associated with torrential rain
Estimated mean DALYs per 100,000 population per event associated with torrential rain are standardized by age and sex in Table 4 and are presented according to intensity of torrential rain and cause of disease. The mean DALYs associated with torrential rain for strong, moderate, and weak events were 56.9, 52.8, and 26.4 per 100,000 population per event, respectively. The DALYs associated with a strong torrential rain were about half those of a strong typhoon, and the DALYs associated with a torrential rain of moderate intensity were higher than those of the typhoon in the same intensity class. The YLLs and DALYs associated with strong torrential rain were greater than other torrential rain intensity categories, and the difference between strong and moderate torrential rain was only 4.26 DALYs.
Table 4
Standardized burden of disease by torrential rain intensity (per 100,000 per case)

The mean YLLs explain about 98% of mean DALYs associated with torrential rain regardless of intensity. The mean YLLs associated with torrential rain increased according to intensity. Moderate intensity torrential rain-associated mean YLLs were about twice those associated with weak torrential rain. Interquartile ranges of mean YLLs for strong and weak torrential rain were not available due to the limited number of cases.
Mean YLDs due to injuries associated with strong torrential rain were 0.54 per 100,000 population per event, and this was more than 10 times higher than that associated with weak torrential rain. Mean YLDs associated with mental disorders, however, were greater for moderate or weak torrential rain than those associated with strong torrential rain. It is possible that moderate and weak torrential rains had longer durations than strong torrential rains, and this may have affected the results.
Mean YLLs and YLDs and DALYs caused by injury are likely associated with the intensity of precipitation, and YLDs caused by mental disorders require further study of the interaction between disease burden and period of precipitation during torrential rain. Consequently, the DALYs associated with typhoon and torrential rain are mostly attributed to indirect loss of life, which is greater than the direct loss of life caused by these disasters, and YLLs account for the most of the DALYs. Regarding the cause of disease burden, burden due to injury was increased in moderate torrential rain events, and mental disorders were greatly associated with moderate or weak torrential rain. However, the number of torrential rain events used in the present analysis was small, and care should be taken in the interpretation of these results.
Population most vulnerable to typhoon- and torrential rain-associated health risks
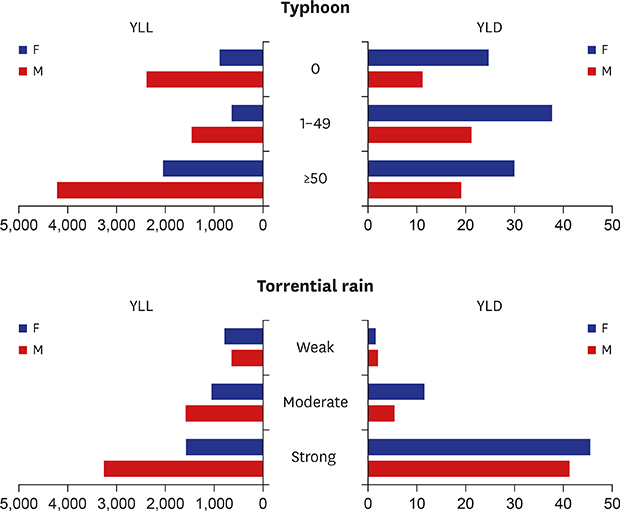
The mean YLLs and YLDs associated with typhoon and torrential rain were estimated by sex and age group (youth 0 to 14 years old, adults 15 to 64 years old, and the elderly 65 years or older). Figs 2 and 3 present the natural disaster-associated YLLs and YLDs across sex and age groups and type and intensity of disasters.
Fig. 2
Typhoon-associated mean YLLs and YLDs by sex and age group (per 100,000 population).
YLLs = years of life lost, YLDs = years lived with disability, TP = typhoon.
Fig. 3
Torrential rain-associated mean YLLs and YLDs by sex and age group (per 100,000 population).
YLLs = years of life lost, YLDs = years lived with disability, TR = torrential rain.
Regarding the intensity and type of natural disaster, the mean YLLs and YLDs per 100,000 population per case generally increased according to intensity of natural disaster and age. The intensity of torrential rain had an unclear positive association with YLLs and YLDs, and typhoon had a modest positive association with intensity and both YLLs and YLDs.
Among the study subpopulations, the greatest burden of disease was 40.56 YLLs per 100,000 population per event for males aged 65 or older associated with strong typhoon (Fig. 2). In general, males recorded higher mean YLLs per 100,000 population per event, and this indicates that males are more vulnerable to deadly risks associated with typhoon and torrential rain. Females aged 65 or older had the highest mean YLDs for most intensities and types of natural disasters. Nevertheless, most females recorded fewer YLLs but higher YLDs than males for most intensities and types of natural disaster.
Age also significantly varied the burden of disease associated with natural disaster. The risks of death and disease were generally greater for the elderly population exposed to typhoon than other subpopulations. The subpopulation of males aged 15–64, however, had a higher risk of diseases associated with typhoon than other male age groups.
DISCUSSION
The present study examined the burden of disease associated with typhoon and torrential rain using the DALY method. The results of our study show that the nationwide health effects of natural disaster in Korea are quite significant. The intensity of typhoon or torrential rain and burden of disease were not proportionally associated with an incremental increase in intensity of natural disaster. The most intense typhoon greatly increased the burden of disease. Mental disorders caused higher YLDs associated with typhoon and torrential rain than did injuries, but injury-induced YLDs were more strongly associated with strong typhoon and torrential rain than were storms of lower intensity. Our results also show that males have a higher risk of YLLs associated with typhoon and torrential rain than do females. On the contrary, females have a higher risk of YLDs associated with typhoon and torrential rain. Regarding age, the elderly population are the most vulnerable to most disaster types and intensities, and males younger than 65 years are more vulnerable to strong torrential rain events than are other population groups. Therefore, the population most vulnerable to natural disaster cannot be defined by the characteristics of the population alone, but the characteristics of the natural disaster itself may be the most important factor to be considered.
Although numerous epidemiologic studies have helped to explain the morbidity or mortality of natural disasters, this is, to our knowledge, the first study analysing the burden of disease associated with natural disasters by type and intensity of disaster across subpopulations. There are three methodological strong points of our study. First, we used a comprehensive national dataset to examine the nationwide health effects of disasters. Second, we used a proven and comparable burden of disease method, DALYs. Third, to estimate disaster-associated excess morbidity and mortality, we analysed morbidity based on episode, and the association was defined by a case-crossover study design. We believe these methodologies contributed to the conceptual strength of the present study.
The frequency and intensity of extreme weather may be altered by climate change,34 and public policy makers, therefore, should acknowledge that the current level of disaster preparedness is inadequate and consider disaster and climate change preparedness to be an essential part of public health policy. Our results showing the sudden increase in disease burden with a strong typhoon suggests that Korea has the capacity to adequately address a moderately-sized typhoon but is unprepared for an extreme typhoon.
Previous studies on the vulnerability of countries to natural disasters suggest that the economic status of a country,3536 human development,37 and weaker exposure38 to natural disaster decrease the vulnerability to disaster. Korea has an advanced economy39 with a very high Human Development Index (HDI)40 and low World Risk Index.41 Korea ranks 15th on the HDI42 and averages 27 deaths and 580 million USD lost per year to natural disasters.6 Considering its economic and development status and the exposure level of natural disaster in Korea, natural disaster is expected to minimally affect Korean society. Although Korea generally has good infrastructure and the capacity to deal with the hazards of natural disasters, extreme weather still has significant impacts on public health, as is illustrated in our results. According to the present study, the burden of disease associated with a strong typhoon is higher than that of annual unintentional injury including exposure to mechanical forces, fire, heat and hot substances, drowning, and falls caused by behavioural risk, with 151.30 DALYs per 100,000 population.43 Considering the short span of time of natural disaster impacts and the small number of events, the short-term health effects associated with a natural disaster should not be ignored.
The DALYs associated with natural disaster as a health risk include not only direct victims and deaths, but also indirect health effects and their spill over health effects. Our study found that the typhoon- and torrential rain-associated burdens of diseases are mostly related to YLLs. This burden is caused by the excess mortality associated with typhoon and torrential rain and is greater than the death toll in the Korean Statistical Yearbook of Natural Disasters. Because our estimation of excess mortalities includes direct and indirect deaths associated with typhoon and torrential rain in the short period following the storm event, this allowed our estimation of the YLLs associated with typhoon and torrential rain to cover the possible indirect or spill over death impacts associated with typhoon and torrential rain.
Non-fatal health outcomes from disease and injury are important considerations in health promotion and surveillance of individual and population health.4445 Quantifiable measurement of the burden of natural disasters allows a comparison of the causes of ill health associated with natural disasters. According to our results, intensity and type of disaster play a role in the increased burden of disease related with YLDs. Although only a strong typhoon was associated with significant YLDs, torrential rain significantly increased YLDs from the lowest scale of intensity of torrential rain. We assume that this is due to the wider regional area effected by torrential rain than typhoon. Conceptually, torrential rain affects a limited region; however, the Korean Statistical Yearbook of Natural Disasters shows that torrential rain occurs widely during the monsoon period in Korea, affecting a large portion of the population. An incremental trend in YLDs associated with typhoon and torrential rain according to intensity was observed. We assume that this was caused by increased excess morbidity and an increase in severity of injury. An interesting finding is that both typhoon and torrential rain caused more YLDs due to mental illness than injury. We presume that the longer duration of mental illness than for injury and higher YLDs of females, who are more vulnerable to mental illness46 than males,4647 may possibly explain these results.
Previous studies generalized the notions of vulnerabilities related to natural disasters and their results have not been consistent. Some studies contend that sexual inequity constrains women's access to resources for emergency preparedness, information, needed warnings, and forecasts, leaving women more vulnerable to disaster.2348 Others assert that women have better resilience or coping strategies for disaster and are not all more vulnerable.48 Our findings on health vulnerability to natural disaster are related to the type of disasters, its intensity, and the severity of health impact by subpopulation group. For instance, with a strong typhoon, the elderly population are most vulnerable to the risk of death, although male adults were the most vulnerable to the risk of disease. The higher YLLs of the elderly are since they are vulnerable to health-threatening hazards and have limited physical ability to cope with extreme weather. The high YLDs associated with strong torrential rain of younger males could be caused by the tendency of men to be “risk-takers.”25 However, there is another possible explanation. In Korea, the most powerful human resources at a catastrophic disaster are soldiers serving mandatory military service, who are on the front line to fight disaster events with the greatest exposure to hazard. This may explain part of our results in the context of Korea. Our results suggest that vulnerability to natural disaster is a combination of the function of social contexts, hazards, and health status of a population. Therefore, greater understanding of the associations between natural disaster, health, and population are needed for more effective public health disaster preparedness due to the increase of extreme weather risk caused by anthropologic climate change.
There are some limitations to the present study. Torrential rain-associated burdens of disease were analysed for a limited number of cases. Because the cases were strictly limited to those with minimum interaction with typhoon and other weather events, this may have resulted in underestimation of the actual burden of disease. Landfall typhoons frequently bring heavy rainfall over land before or after the typhoon, and this synergy usually worsens the event.49 The torrential rain-associated disease burden herein is a robust result. The causes of disease burden in this study were limited to mortality and morbidity due to injury and mental disorders, and natural disaster-associated burden of disease was estimated according to the cause of disease and type and intensity of natural disaster across subpopulations.
Despite the strengths of our study, it is probable that we underestimated YLDs owing to the limitations of the medical claims data. First, symptoms outside of medical utilization were not included, and there is possible to reduction the burden of mental disease for the narrow definition of mental disease in this study. In addition to depression, anxiety, and stress disorders that were included in this study, posttraumatic stress,5051 anger,52 somatic complaints,53 and substance abuse5354 are also associated with natural disasters. Those symptomatic mental disorders are significant after disasters, but many of them are not codable on the ICD-10 and are not addressed with proper medical care; consequently, they were not captured in our health insurance claim dataset. Second, the durations of mental disorders were underestimated. Mental disorders usually have a mean or median duration longer than 4 weeks,5556 and the report of the Global Burden of Depressive Disorders in 2000 assumed a duration for an episode of depression to be 6 months.57 However, our episode-based estimation found that mental disorder outpatients had a median duration of illness less than 3 weeks, and patients requiring admission had a median illness duration of 25 to 47 days, which was lower than reported in previous studies. In addition, for the vulnerable population analysis, we were not able to consider individual characteristics such as economic status, baseline health status, educational attainment, or other socioeconomic factors. Therefore, further studies with better control of these variables are needed.
 XML Download