

 PDF
PDF ePub
ePub Citation
 Print
Print


INTRODUCTION
Chronic kidney disease (CKD) is a major health problem, and it affects –10% of adults in Western countries (1). In Korea, CKD prevalence was 7.8% overall (Korea National Health and Nutrition Examination Survey [KNHANES] data) and 13.7% in urban population with age ≥ 35 years in Korea (23). Among various risk factors, hypertension (HT) is considered an important one in the development and progression of CKD (4). HT also increases the risk of death and cardiovascular disease (5).
To reduce these risks, recent guidelines recommend strict control of blood pressure (BP) to ≤ 130/80 and ≤ 140/90 mmHg in CKD patients with and without proteinuria, respectively (46). However, a large proportion of CKD patients have inadequate BP control, and the proportions vary from report to report (78). Furthermore, BP may not be properly controlled in many Korean CKD patients. In Korea, KNHANES guidelines suggested that 58.5% of the general population had appropriate clinic BP (< 130/80 mmHg), and an Assessment of Blood Pressure Control and Target Organ Damage in Patients with Chronic Kidney Disease and Hypertension (APrODiTe) study reported that 53.4% of CKD patients had controlled clinic BP (< 140/90 mmHg) (910). Furthermore, it is important to increase the BP control rate as kidney function deteriorates. The National Kidney Foundation-Kidney Early Evaluation Program (NKF-KEEP) in the United States reported that rates of HT awareness, treatment, and adequate HT control increased progressively with advancing kidney disease despite increasing HT prevalence (11). Unfortunately, this aspect of BP control is not known in Korean CKD patients.
Clinic BP is considered insufficient to diagnose HT and monitor overall BP control because it does not correlate well with ambulatory blood pressure monitoring (ABPM), which encompasses white-coat or masked HT (1213). CKD is associated not only with an abnormal dipping pattern but also with white-coat or masked HT (710141516171819). These abnormal ABPM patterns are considered to be associated with cardiovascular disease and CKD progression (20).
We conducted a multicenter, cross-sectional study to examine BP control status and patterns and dipping patterns in Korean CKD patients. We also investigated clinical characteristics associated with abnormal BP patterns.
MATERIALS AND METHODS
Study population
From August 2014 to May 2015, patients with HT and CKD stages G1–G4 treated at the Seoul National University Boramae Medical Center, Seoul National University Hospital, and Seoul National University Bundang Hospital were enrolled. The inclusion criteria were as follows: 1) age of 20–75 years, 2) BP ≥ 140/90 mmHg, and/or 3) taking the same BP medication since at least 2 weeks before enrollment. Patients with acute kidney injury, hospitalization, renal replacement therapy, previous kidney transplantation, uncontrolled arrhythmia, asthma, chronic obstructive pulmonary disease, and primary endocrine disorders except diabetes mellitus were excluded. Pregnant women and anyone who worked night shifts were also excluded.
Definitions
CKD is defined by the Kidney Disease Improving Global Outcomes (KDIGO) as abnormalities of kidney structure or function that are present for at least 3 months (4). CKD stages were defined according to glomerular filtration rate (GFR) categories as defined by KDIGO guidelines (4). The estimated glomerular filtration rate (eGFR) was calculated using the Chronic Kidney Disease-Epidemiology Collaboration equation (21). Serum creatinine (Cr) was measured using the isotope dilution mass spectrometry-traceable method. Extreme-dippers were defined as patients having a nighttime/daytime systolic blood pressure (SBP) ≤ 0.8; dippers, as those with a ratio of 0.8–0.9; non-dippers, as those with a ratio of 0.9–1.0; and reverse-dippers, as those with a ratio > 1.0 (22). HT as diagnosed by clinic BP and ABPM measurements was ≥ 140/90 and ≥ 130/80 mmHg, respectively. Normal BP was defined as both normal clinic BP and ABPM; sustained HT, as both HT clinic BP and ABPM; white-coat HT, as a HT clinic BP and normal ABPM (12); and masked HT, as normal clinic BP and HT ABPM (13).
Clinic BP measurement
Clinic BP was measured by trained medical staff using a mercury sphygmomanometer with an appropriately sized cuff (23). All participants rested over 5 minutes and were prohibited from smoking and ingesting caffeine for 30 minutes before measurements. Three measurements were performed at 1-minute intervals, and the average of the last 2 measurements was taken as the clinic BP.
ABPM
Patients underwent 24-hour ABPM using Oscar 2 (SunTech Medical, Morrisville, NC, USA) and Mobile-O-Graph (I.E.M. GmbH, Stolberg, Germany). BP monitoring was performed on a typical work day. BP was recorded every 30 minutes. The ABP reading was considered adequate if the monitor had been worn for 24-hour and there were more than 16 acceptable readings between 8 AM and 10 PM (daytime) and more than 12 acceptable readings between 10 PM and 8 AM (nighttime).
Baseline demographics and clinical characteristics
Demographic characteristics, CKD causes, medical history, and laboratory data such as hemoglobin (Hb), albumin, blood urea nitrogen (BUN), Cr, calcium (Ca), phosphorus (P), intact parathyroid hormone (iPTH), total cholesterol (Total-C), high-density lipoprotein cholesterol (HDL-C), low-density lipoprotein cholesterol (LDL-C), triglycerides (TG), and random urine protein/Cr ratio (UPCR) were obtained at the baseline study visit. Comorbidities were evaluated using the modified Charlson Comorbidity Index Score (CCIS) (24).
Statistical analysis
Quantitative variables are presented as mean ± standard deviation (SD) for normally distributed variables. Non-parametric variables are expressed as median (range). Categorical variables are expressed as numbers with proportions. Quantitative variables were analyzed using analysis of variance (ANOVA) followed by the Bonferroni post-hoc test or the Kruskal-Wallis or Mann-Whitney rank sum tests for non-parametric variables. Chi-square tests were used to compare categorical variables. Simple logistic regression analysis was applied to find the unadjusted factors that correlated with dipping patterns and BP control patterns. Multiple logistic regression analysis with backward elimination technique adjusted for factors with P < 0.05 was used to identify independent predictors of dipping patterns and BP control patterns. The relationship between the 2 continuous variables was assessed by Pearson's correlation method. Statistical analysis was performed using IBM SPSS Statistics 20 (SPSS Inc., Chicago, IL, USA). P value < 0.05 was considered statistically significant.
Ethics statement
The present study protocol was reviewed and approved by the Institutional Review Board of Seoul National University Boramae Medical Center (26-2014-63), Seoul National University Hospital (1406-131-593), and Seoul National University Bundang Hospital (B-1408/262-403). Informed consent was submitted by all subjects when they were enrolled.
RESULTS
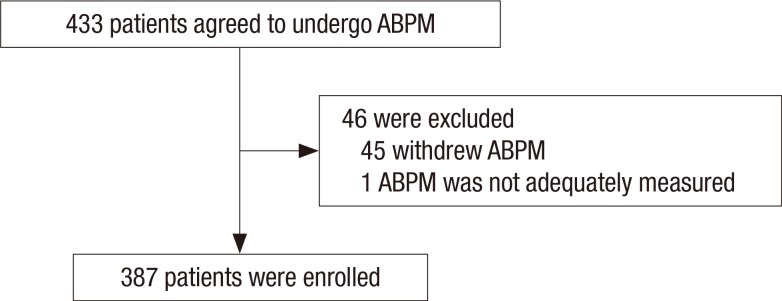
A total of 433 patients agreed to undergo ABPM, and 46 patients were excluded because they withdrew from the study or their ABPM measurements were not adequate. Finally, 387 CKD patients were enrolled in this study (Fig. 1).
Fig. 1
Diagram of patients enrollment. A total of 433 CKD patients agreed to undergo ABPM, and 46 patients were excluded from the analysis.
CKD = chronic kidney disease, ABPM = ambulatory blood pressure monitoring.
Demographic and clinical characteristics according to CKD stages
Table 1 shows the general characteristics of the 387 patients. Of these, 226 patients (58.4%) were male, and their median age was 61 (20–75) years. Diabetic nephropathy, glomerulonephritis, hypertensive nephropathy, and polycystic kidney disease were reported in 141 (36.5%), 107 (27.6%), 80 (20.7%), and 9 (2.3%) patients, respectively. Of all patients, 95 (24.6%) were CKD G1–2, 79 (20.4%) were CKD G3a, 93 (24.0%) were CKD G3b, and 120 (31.0%) were CKD G4. Table 1 also shows the demographic and laboratory characteristics according to the CKD stages.
Table 1
Demographic and clinical characteristics according to CKD stages
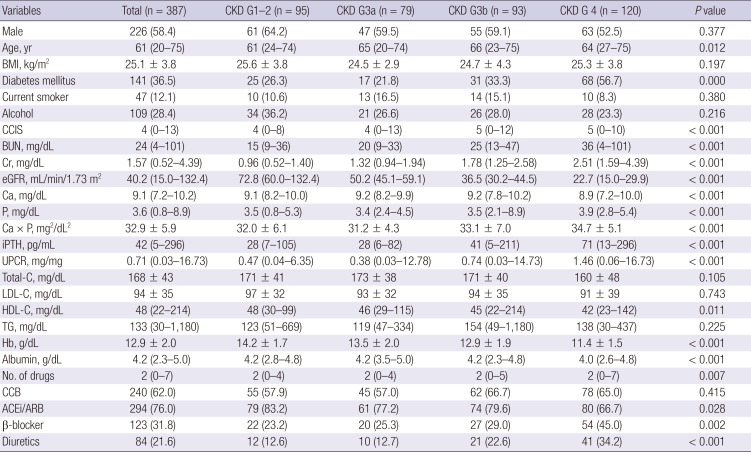
Values for categorical variables are given as a number (%); Values for continuous variables are given as mean ± standard deviation or median (range).
ACEi = angiotensin-converting enzyme inhibitor, ARB = angiotensin receptor blocker, BMI = body mass index, BUN = blood urea nitrogen, Ca = calcium, CCB = calcium channel blocker, CCIS = modified Charlson Comorbidity Index Score, CKD = chronic kidney disease, Cr = creatinine, eGFR = estimated glomerular filtration rate, Hb = hemoglobin, HDL-C = high-density lipoprotein cholesterol, iPTH = intact parathyroid hormone, LDL-C = low-density lipoprotein cholesterol, No. = number, P = phosphorus, TG = triglyceride, Total-C = total cholesterol, UPCR = random urine protein/creatinine ratio.
The median clinic BP was 133 (90–207)/78 (30–115) mmHg. According to ABPM, the median 24-hour BP was 129 (94–207)/79 (49–114) mmHg, median daytime BP was 133 (94–213)/82 (52–115) mmHg, and median nighttime BP was 121 (87–197)/73 (42–117) mmHg. Of all patients, 233 (60.2%) had controlled clinic BP (< 140/90 mmHg), whereas 134 (34.6%) using ABP criteria had < 130/80 mmHg.
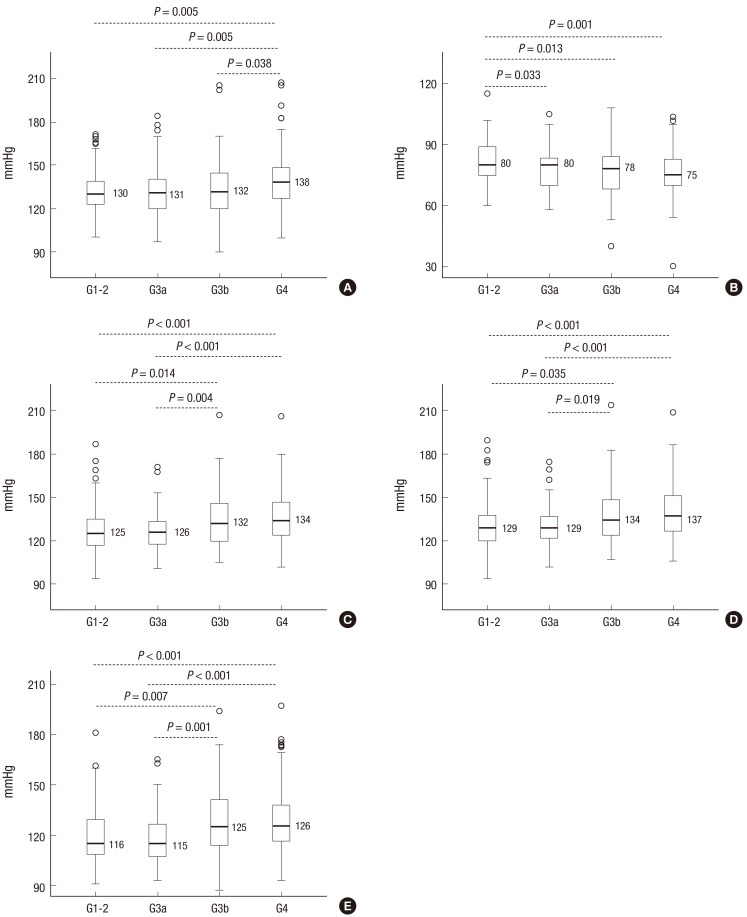
The median clinic, 24-hour, daytime, and nighttime SBPs were not different between CKD G1–2 and CKD G3a. The median 24-hour, daytime, and nighttime SBPs were not different between CKD G3b and CKD G4. The median clinic diastolic blood pressure (DBP) of CKD G1–2 (80 [60–115] mmHg) was significantly higher than that of CKD G3a (80 [58–105] mmHg, P = 0.033), CKD G3b (78 [40–108] mmHg, P = 0.013), and CKD G4 (75 [30–104] mmHg, P = 0.001). There were no differences in the 24-hour, daytime, and nighttime DBP between all CKD stages (Fig. 2).
Fig. 2
Clinic BP values and ABPM SBPs values according to CKD stages.
(A) Clinic SBP. (B) Clinic DBP. (C) 24-hour SBP. (D) Daytime SBP. (E) Nighttime SBP.
BP = blood pressure, ABPM = ambulatory blood pressure monitoring, CKD = chronic kidney disease, DBP = diastolic blood pressure, SBP = systolic blood pressure.
Dipping patterns
Of all patients, 22 (5.7%) were extreme-dippers, 147 (38.0%) were dippers, 164 (42.3%) were non-dippers, and 54 (14.0%) were reverse-dippers. Reverse-dippers showed lower median eGFR and a higher proportion of CKD G3b/G4, but no statistically significant difference. Reverse-dippers showed higher median P (P = 0.001), TG (P = 0.020), and nighttime SBP (P < 0.001) and lower median albumin (P < 0.001) than extreme-dippers, dippers, and non-dippers. They also showed higher median UPCR than extreme-dippers and dippers (P = 0.028). Reverse-dippers showed higher mean Ca × P product than dippers and non-dippers (P < 0.001) (Table 2).
Table 2
Demographic, clinical, and BP characteristics according to dipping patterns
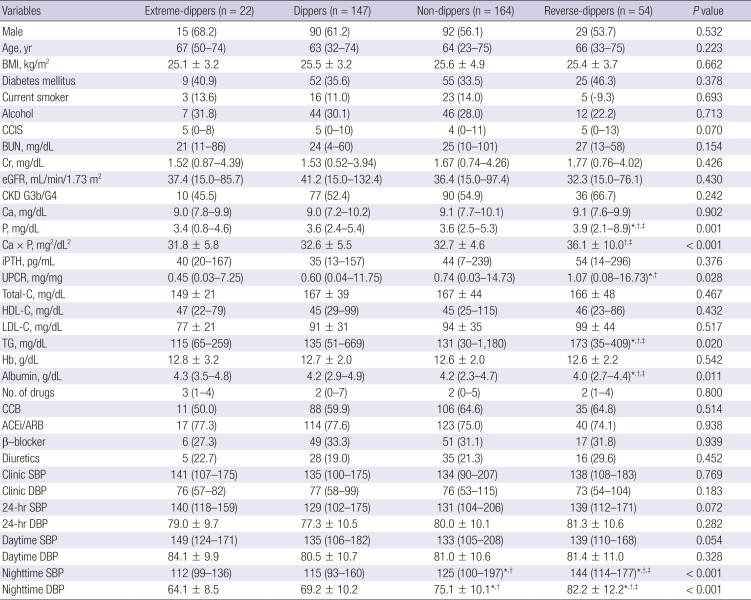
Values for categorical variables are given as a number (%); Values for continuous variables are given as mean ± standard deviation or median (range).
ACEi = angiotensin-converting enzyme inhibitor, ARB = angiotensin receptor blocker, BMI = body mass index, BP = blood pressure, BUN = blood urea nitrogen, Ca = calcium, CCB = calcium channel blocker, CCIS = modified Charlson Comorbidity Index Score, CKD = chronic kidney disease, Cr = creatinine, DBP = diastolic blood pressure, eGFR = estimated glomerular filtration rate, Hb = hemoglobin, HDL-C = high-density lipoprotein cholesterol, iPTH = intact parathyroid hormone, LDL-C = low-density lipoprotein cholesterol, No. = number, P = phosphorus, SBP = systolic blood pressure, TG = triglyceride, Total-C = total cholesterol, UPCR = random urine protein/creatinine ratio.
*Significant with extreme-dippers; †Significant with dippers; ‡Significant with non-dippers.
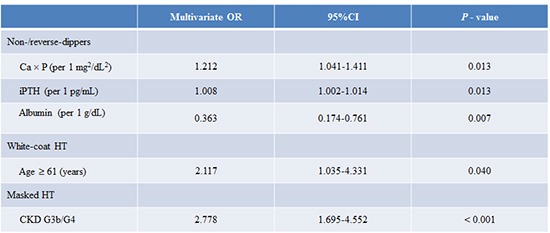
The Ca × P product and iPTH positively correlated with nighttime/daytime SBP ratio (R2 = 0.033, P < 0.001 and R2 = 0.017, P = 0.011, respectively) (Fig. 3). The P, Ca × P product, iPTH, albumin, nighttime SBP, and nighttime DBP significantly correlated with the non-/reverse-dippers in univariate analyses. Multiple logistic regression analyses conducted with the above factors and eGFR showed that the Ca × P product (odds ratio [OR], 1.212; 95% confidence interval [CI], 1.041–1.411; P = 0.013), iPTH (OR, 1.008; 95% CI, 1.002–1.014; P = 0.013), and albumin (OR, 0.363; 95% CI, 0.174–0.761; P = 0.007) were independently associated with non-/reverse-dippers when BP data were not included. When multiple logistic regression analyses were performed with the above factors, eGFR, and BP data, the Ca × P product (OR, 1.247; 95% CI, 1.053–1.582; P = 0.011), nighttime SBP (OR, 1.042; 95% CI, 1.022–1.062; P < 0.001), and nighttime DBP (OR, 1.040; 95% CI, 1.010–1.070; P = 0.008) were independently associated with non-/reverse-dippers (Table 3).
Fig. 3
Correlation of Ca × P and iPTH with nighttime/daytime SBP ratio. (A) Ca × P product. (B) iPTH.
Ca = calcium, P = phosphorus, iPTH = intact parathyroid hormone, SBP = systolic blood pressure.
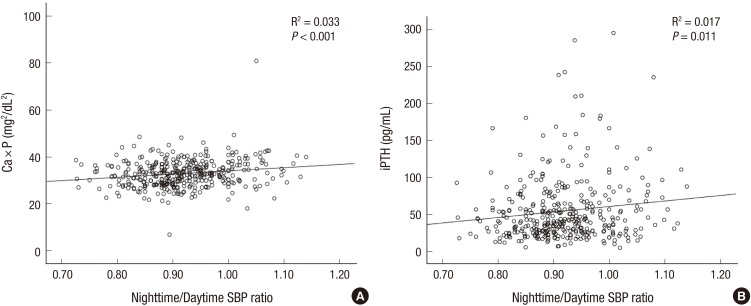
Table 3
Factors related to non-/reverse-dippers
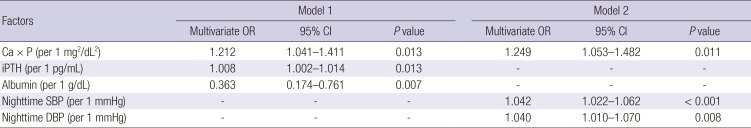
Model 1: adjusted for P, Ca × P, iPTH, albumin, eGFR, and UPCR; Model 2: adjusted for P, Ca × P, iPTH, albumin, eGFR, UPCR, nighttime SBP, and nighttime DBP.
Ca = calcium, CI = confidence interval, DBP = diastolic blood pressure, eGFR = estimated glomerular filtration rate, iPTH = intact parathyroid hormone, OR = odds ratio, P = phosphorus, SBP = systolic blood pressure, UPCR = random urine protein/creatinine ratio.
BP control patterns
Among all patients, normal BP was most common (33.3%), followed by sustained HT (29.7%), masked HT (26.9%), and white-coat HT (10.1%). The median 24-hour SBP (P < 0.001), daytime SBP (P < 0.001), and nighttime SBP (P < 0.001) were the highest in sustained HT than in normal BP, white-coat HT, and masked HT. Masked HT showed higher ABPM SBPs than normal BP and white-coat HT (P < 0.001) (Table 4). However, clinic SBP was not different between sustained HT and white-coat HT (Table 4).
Table 4
Demographic, clinical, and BP characteristics according to BP control pattern
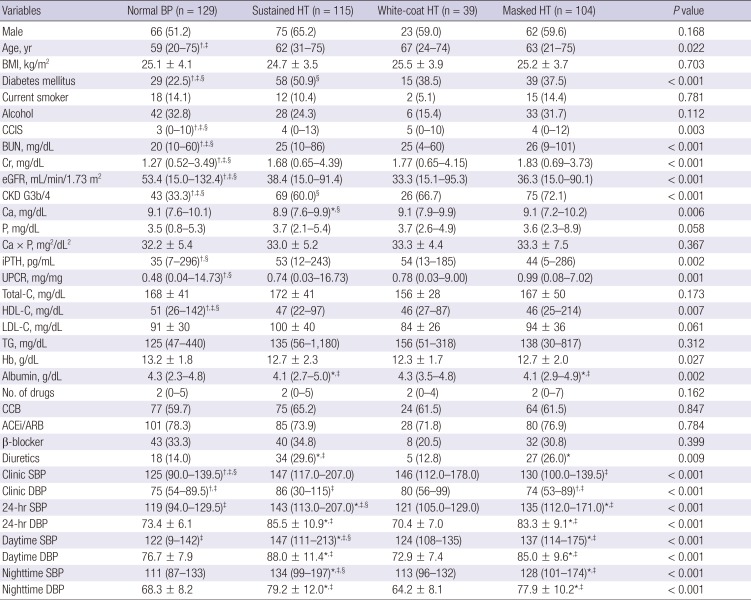
Values for categorical variables are given as a number (%); Values for continuous variables are given as mean ± standard deviation or median (range).
ACEi = angiotensin-converting enzyme inhibitor, ARB = angiotensin receptor blocker, BMI = body mass index, BP = blood pressure, BUN = blood urea nitrogen, Ca = calcium, CCB = calcium channel blocker, CCIS = modified Charlson Comorbidity Index Score, CKD = chronic kidney disease, Cr = creatinine, DBP = diastolic blood pressure, eGFR = estimated glomerular filtration rate, Hb = hemoglobin, HDL-C = high-density lipoprotein cholesterol, HT = hypertension iPTH, intact parathyroid hormone, LDL-C = low-density lipoprotein cholesterol, No. = number, P = phosphorus, SBP = systolic blood pressure, TG = triglyceride, Total-C = total cholesterol, UPCR = random urine protein/creatinine ratio.
*Significant with normal BP; †Significant with sustained HT; ‡Significant with white-coat HT; §Significant with masked HT.
Normal BP showed lower median BUN (P < 0.001), Cr (P < 0.001), and CCIS (P = 0.003); higher median eGFR (P < 0.001) and HDL-C (P = 0.007); and lower proportion of DM (P < 0.001) and CKD G3b/G4 (P < 0.001) than sustained HT, white-coat HT, and masked HT. Normal BP also showed lower median iPTH (P = 0.002) and UPCR (P = 0.001) than sustained HT and masked HT. Sustained HT showed a higher proportion of DM (P < 0.001) and lower proportion of CKD G3b/G4 (P < 0.001) than masked HT. Sustained HT and masked HT showed lower median albumin (P = 0.002) than normal BP and white-coat HT. Sustained and masked HT patients were also prescribed more diuretics than those with normal BP (P = 0.009) (Table 4).
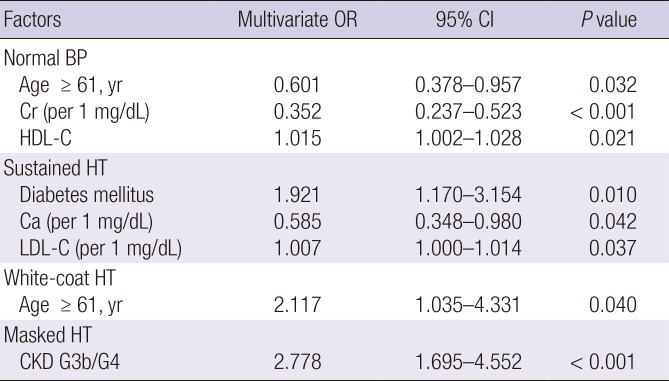
Multiple logistic regression analyses showed that age ≥ 61 years (OR, 0.601; 95% CI, 0.378–0.957; P = 0.032), Cr (OR, 0.352; 95% CI, 0.237–0.523; P < 0.001), and HDL-C (OR, 1.015; 95% CI, 1.002–1.928; P = 0.012) independently associated with normal BP. DM (OR, 1.921; 95% CI, 1.170–3.154; P = 0.010), Ca (OR, 0.585; 95% CI, 0.348–0.980; P = 0.042), and LDL-C (OR, 1.007; 95% CI, 1.000–1.014; P = 0.037) independently associated with sustained HT. Age ≥ 61 years (OR, 2.117; 95% CI, 1.035–4.331; P = 0.040) independently correlated with white-coat HT. CKD G3b/G4 (OR, 2.778; 95% CI, 1.695–4.552; P < 0.001) independently correlated with masked HT (Table 5).
Table 5
Factors related to BP control patterns
Normal BP: adjusted for sex, age ≥ 61 years, Diabetes mellitus, CCIS, BUN, Cr, eGFR, CKD G3b/G4, Ca, P, iPTH, UPCR ≥ 1 mg/mg, HDL-C, Hb, albumin, and diuretics; Sustained HT: adujusted for DM, CCIS, Cr, eGFR, Ca, iPTH, UPCR ≥ 1 mg/mg, LDL–C, albumin, and diuretics; White-coat HT: adjusted for age ≥ 61 years, Total-C, and HDL-C; Masked HT: adujusted for CCIS, BUN, Cr, eGFR, CKD G3b/4, and UPCR ≥ 1 mg/mg.
BP = blood pressure, BUN = blood urea nitrogen, Ca = calcium, CCIS = modified Charlson Comorbidity Index Score, CKD = chronic kidney disease, CI = confidence interval, Cr = creatinine, eGFR = estimated glomerular filtration rate, Hb = hemoglobin, HDL-C = high-density lipoprotein cholesterol, HT = hypertension, iPTH = intact parathyroid hormone, LDL-C= low-density lipoprotein cholesterol, OR = odds ratio, P = phosphorus, Total-C = total cholesterol, UPCR= random urine protein/creatinine ratio.
DISCUSSION
This study demonstrated that the clinic BP control rate was 60.2%. The median 24-hour SBPs of CKD G3b and CKD G4 were significantly higher than those of CKD G1–2 and CKD G3a. However, the median 24-hour SBPs were not different between CKD G1–2 and CKD G3a or between CKD G3b and CKD G4. Of all Korean CKD patients, 56.3% were non-/reverse-dippers. Non-/reverse-dippers are associated with higher P, higher Ca × P product, and lower albumin. They also show high prevalence of sustained HT (29.7%) and masked HT (26.9%). Sustained HT correlated with DM, lower Ca, and higher LDL-C. White-coat HT was associated with age ≥ 61 years and masked HT was associated with CKD G3b/G4.
Many previous studies have reported on control of clinic BP in CKD patients. NKF-KEEP showed that 31.4% and 13.2% of patients maintained clinic BP ≤ 140/90 and 130/80 mmHg, respectively (11). Among Chronic Renal Insufficiency Cohort (CRIC) Study participants, 67.1% and 46.1% showed clinic BP control rates of < 140/90 and < 130/80 mmHg, respectively (8). However, at Spanish ABPM Registry report showed that only 21.7% and 9.1% of CKD patients maintained clinic BP < 140/90 and < 130/80 mmHg, respectively (7). In Korea, the APrODiTe study reported that 53.4% of CKD patients had controlled clinic BP (< 140/90 mmHg) (10). This study showed a similar controlled clinic BP rate (60.2%).
Previous studies demonstrated that controlled BP rates increased with CKD progression. NKF-KEEP reported that rates of HT awareness, treatment and adequate HT control increased with advancing kidney disease despite increasing prevalence of HT (11). The Spanish ABPM Registry analysis also showed that BP control trends from no CKD to CKD stage 5 increased progressively for BP maintenance at the < 130/80 mmHg threshold. They also reported that 24-hour BP control did not change from no CKD to CKD stage 5 (7). In contrast, Wu et al. (25) reported that 24-hour, daytime, and nighttime SBPs and DPBs were higher in CKD stages 4–5 than CKD stages 1–3. This study demonstrated that clinic SBP was higher in CKD G4 than in other groups. In the case of ABPM, CKD G3b/G4 showed higher 24-hour, daytime, and nighttime SBPs than CKD G1–2/G3a. The ABPM SBPs were not different between CKD G1–2 and CKD G3a or between CKD G3b and CKD G4. Most CKD studies that examined the association between complications and CKD stages were based on the previous 5 stages (26). The recent KDIGO 2012 Guidelines divided stage 3 based on data supporting different outcomes and risk profiles into categories G3a (eGFR 45–59 mL/min/1.73 mg2) and G3b (eGFR 45–59 mL/min/1.73 mg2) (4). This study showed that outcomes and risk profiles as well as BP control patterns, were different between CKD G1–2/G3a and CKD G3b/G4. These results suggest that careful BP monitoring and treatment are essential from the moment CKD patients reach CKD G3b.
Non-/reverse-dipping indicate that nighttime BP did not decrease or was even higher than daytime BP. As non-/reverse-dipping is considered a risk factor of cardiovascular events in non-CKD hypertensive patients, non-/reverse-dipping is considered a risk factor of CKD progression (2728). Non-/reverse-dipping was also shown to be a risk factor for cardiovascular events and correlated with markers for cardiovascular events in CKD patients (101415162829). Multiple factors cause suppressed nighttime BP decrease, such as older age, race, autonomic dysfunction, abnormal sleep-wake cycle, and sodium sensitivity (30). In addition, Feldstein et al. (31) reported that non-dippers were associated with elevated serum Ca in elderly essential hypertensive patients with mild-to-moderate CKD, and Kanbay et al. (32) reported that the non-dipper clinical profile is related to serum Ca, P, and PTH in hypertensive patients with normal renal function. In this study, the nighttime/daytime SBP ratio correlated significantly with the Ca × P product and iPTH. We also suggested that the Ca × P product, iPTH, and albumin were independently associated with non-/reverse-dippers in a multiple logistic regression model even after adjusting for eGFR. In particular, the Ca × P product independently correlated with non-/reverse-dippers after adjusting for nighttime SBP and DBP. Elevated serum P and Ca × P product were associated with poor outcomes according to the International Dialysis Outcomes Practice Patterns Study and a cohort from The Netherlands that included both hemodialysis and peritoneal dialysis patients (3334). Serum Ca, P, and PTH are factors that promote vascular calcification (35). Increased serum P also stimulates fibroblast growth factor-23 (FGF-23) and PTH secretion. Elevated FGF-23 levels appear to be associated with poor clinical outcomes (35). However, because FGF-23 is not yet routinely measured in general clinical practice, a clinician should estimate CKD-mineral bone disorders using parameters that can be measured easily. The results of this study suggested that abnormal Ca, P, and PTH, all of which reflect abnormal mineral metabolism, vascular calcification, and poor outcome, could predict increased nighttime BP and non-/reverse-dipping.
The high prevalence of white-coat and masked HT in patients with CKD support the need to measure out-of-office BP, such as ABPM or home BP to confirm that a patient's BP is under control. In this study, the prevalence of white-coat and masked HT was 10.1% and 26.9%, respectively. These results were similar to those of the African American Study of Kidney Disease Cohort study (2.2% and 42.9%, respectively), CKD Japan cohort (5.6% and 30.9%, respectively), APrODiTe study (4.3% and 33.9%, respectively), and CRIC Study (4.1% and 27.8%, respectively) (10141819). However, the prevalence of white-coat HT and masked HT was respectively 18.3% and 8.3% in meta-analysis by Bangash and Agarwal and 28.8% and 7.0% in the Spanish ABPM Registry, suggesting that their prevalence was respectively ≥ 15% and ≤ 10% (717). The differences in the prevalence of BP control type are attributable to race, ethnicity, and renal function in addition to diagnostic thresholds.
Previous studies of CKD cohorts showed that masked HT was associated with low eGFR, elevated urine protein excretion, higher left ventricular hypertrophy and higher pulse wave velocity (10141819). In this study, masked HT was associated with lower eGFR, higher prevalence of CKD G3b/G4, and elevated UPCR than patients with normal BP. These data indicate that masked HT patients appear to have decreased renal function and elevated proteinuria. Therefore, clinician should carefully monitor out-of-office BP in CKD patients.
This study has several limitations. First, this was a cross-sectional and observational study, and therefore, it has limitations in establishing a cause-effect relationship. Second, important parameters such as FGF-23, echocardiography, and pulse wave velocity, were not obtained; this further limits the clarification of causality. Third, because ABPM was evaluated only once, variability in measurements was not considered. This might result in some degree of misclassification. Finally, because this study had a small number of participants, its statistical power was not high enough for some parameters.
In conclusion, the median ABPM SBPs of CKD G3b and CKD G4 were significantly higher than those of CKD G1–2 and CKD G3a. ABPM showed a high prevalence of non-/reverse-dippers and sustained/masked HT. Non-/reverse-dippers correlated with higher Ca × P product, higher iPTH, and lower albumin. White-coat HT correlated with old age and sustained HT, with advanced CKD. Clinicians should attempt to perform ABPM in CKD patients, especially in those who are older or have advanced CKD as well as those who have abnormal Ca × P product, iPTH, and albumin.
 XML Download