

 PDF
PDF ePub
ePub Citation
 Print
Print


INTRODUCTION
Socioeconomic status (SES) is one of the most frequently studied determinants in the context of public health care for the elderly. Many previous studies show that lower SES is an independent risk factor for the development of dementia or cognitive impairment in the elderly (12345), although several previous studies have suggested that higher prevalence of cardiovascular risk factors and poor behavioral habits among people with lower SES may contribute to increased risks of developing cognitive impairment (4567).
Apart from individual SES and related factors, however, it is not well established whether district-level SES disparities may interplay with individual SES on the incidence of cognitive impairment in the elderly. Most previous studies have concentrated the effects of either individual or district-level SES itself (1458910). The district-level SES could represent basic environmental infrastructures including readily accessible local health services or green space and sports facilities for active and healthy aging, while the individual SES could represent as effect modifiers or mediating factors for individual cognitive frailty (11). Considering this different aspect between individual and district-level SES, it is important to consider both individual and district-level SES especially for the public health related to mental health for the elderly. Although some of the previous studies have considered both individual and district-level SES (31112), most of those studies were cross-sectional, which might have limited interpretation regarding a causal relationship between SES and cognitive impairment. The purposes of this study, therefore, are to investigate the longitudinal effects of socioeconomic disparities between individual and district-level SES on the development of cognitive impairment among the elderly in Seoul. We hypothesized that there could be synergistic or addictive effects of individual and district-level SES on the development of cognitive impairment in the elderly.
MATERIALS AND METHODS
Study design
This is a retrospective longitudinal analysis using the database from the Seoul Dementia Management Project (SDMP).
Study population
The data were gathered from the data source of SDMP, which includes standardized clinical data with comprehensive screening services for dementia among the elderly population in Seoul. This project has been conducted by the Seoul Metropolitan Center for Dementia (SMCD). Details about the SDMP can be found online at https://www.seouldementia.or.kr.
For this research, we retrospectively analyzed data from January of 2010 to December of 2013. Among a total of 159,247 registrants for the SDMP in 2010, we excluded 19,955 participants (12.5%) who demonstrated cognitive impairment in 2010. Among 139,292 participants, we further excluded 18 participants who provided incorrect information about their ages, as well as 2,996 participants who were under 60 years (n = 1,786) or over 90 years (n = 1,210) of age. We further excluded 61 participants without information or with unreliable information about their National Health Insurance (NHI) services, including people who received benefits as persons of national merit. Accordingly, the final number of participants was 136,217. Among these, a total of 58,852 participants underwent one or more follow-up tests during the period of study (Fig. 1).
Individual SES
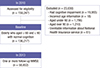
All participants were subdivided into 2 groups: lower vs. higher SES, based on the services provided to participants by the NHI system in Korea (1314). In other words, individuals were placed in a lower SES if they received medical aid (MA) services, while a higher SES was defined by those who received NHI services. Eligibility for MA services is annually evaluated by the Korean government to determine a status of poverty, which is defined as a lower household income than the minimum cost of living estimated by the government (15). As of 2010, the average minimum cost of living for a family of 4 was around $1,350 per month (15). Among 136,217 participants, 13,768 (10.1%) received assistance from the MA program in 2010, which placed them in the lower individual SES group.
District-level SES
All participants were also classified into 2 groups based on their district-level SES, lower vs. higher district-level SES. District-level SES was based on the tax income of each district per year in Seoul. Therefore, individuals were placed in a lower district-level SES if they lived in a district where the average tax income of a district was equal to or below the 50th percentile among 25 districts in Seoul, whereas higher district-level SES was defined if they lived in a district where the average tax income of a district was above the 50th percentile. The mean tax income of 25 districts in 2010 was $36,371,525 according to the data published by the Statistics Korea (http://kostat.go.kr/portal/korea), a central organization for statistics under Ministry of Strategy and Finance in Korea.
Assessment of risk factors for cognitive impairment
All baseline information related to participants was collected using a structured self-reported questionnaire. We assessed demographic characteristics, as well as family history of dementia, cardiovascular risk factors, health-related characteristics, and social relationships. Among the demographics, the years of education were further divided into 3 categories, including uneducated, lower (≤ 9 years of education), and higher (≥ 10 years of education). Cardiovascular risk factors consisted of the presence of hypertension, diabetes, hyperlipidemia, cardiac disease, and stroke, which were defined as existing or none. Health-related characteristics included physical exercise, smoking, and alcohol consumption. In terms of exercise, participants were asked whether they currently exercise regularly or not. With regards to smoking and alcohol consumption, participants were classified into 3 subgroups, including never, past, and current. Participants were also asked whether they held a previous or current occupation. The measures of social relationships comprised the marital status and living situations of participants. Marital status was defined by the following indicators: married , widowed or divorced, or never married. The living situations of participants were defined as living with family caregivers or living alone.
Statistical analysis
Statistical analyses were performed using the Statistical Package for the Social Sciences ver. 18.0 (SPSS Inc., Chicago, IL, USA). Statistical significance was defined as P < 0.05.
Baseline characteristics were compared using Student's t-tests for continuous variables and χ2 tests for dichotomous variables. Logistic regression was used to analyze the prevalence of risk factors according to SES after adjusting age and gender.
The Kaplan-Meier method was used to estimate the cumulative incidence rate (CIR). Differences in incidence of cognitive impairment according to individual or district-level SES were analyzed with the log-rank test. The Cox proportional hazard model was used to explore the significant risk factors for incidence of cognitive impairment, and to calculate the hazard ratio (HR) for the development of cognitive impairment according to individual or district-level SES. The significant risk factors for the development of cognitive impairment were examined using univariate and multivariate Cox-proportional analyses. We also constructed 5 models, in which explanatory variables were added in covariate blocks, to evaluate the associations between the individual or district-level SES and incidence of cognitive impairment.
The interactive association between individual and district-level SES was evaluated using the following stratifications. The study population was divided into 4 strata characterized by 1) having individual lower SES and district-level lower SES (ILDL); 2) having individual lower SES and district-level higher SES (ILDH); 3) having individual higher SES and district-level lower SES (IHDL); and 4) having individual higher SES and district-level higher SES (IHDH).
RESULTS
Baseline characteristics of participants
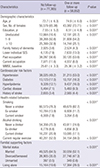
Table 1 demonstrates the baseline characteristics of participants based on the individual SES. People in the lower individual SES group were older and less educated. The baseline MMSE performance was worse among participants in the lower individual SES group (24.3 ± 3.6) than in the higher SES group (25.6 ± 3.2). The lower individual SES group had a higher percentage of hypertension, diabetes, cardiac disease, and history of stroke, as well as a higher percentage of current smokers. Also, peoples in the lower individual SES group were less likely to exercise or to drink alcohol. In terms of social relationships, the lower individual SES group demonstrated much higher proportions of persons living alone (64.7% vs. 19.3%, P < 0.001), and those in divorced or bereaved states (68.7% vs. 37.2%, P < 0.001) relative to the higher individual SES group.
Table 1
Baseline characteristics according to the individual SES
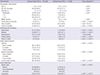
Table 2 shows the baseline characteristics according to the district-level SES. There were different percentages of MA group between higher and lower district-level SES, which shows that the higher district-level SES group had a higher percentage of the MA group (10.4% vs. 9.9%, P for group, 0.008). Regarding living state, the higher district-level SES group shows a greater percentage of persons who live alone than the lower district-level SES group, which are opposite results from the individual SES.
Table 2
Baseline characteristics according to the district-level SES
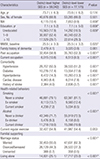
Table 3 shows a comparison of baseline demographic characteristics between the 58,852 participants who underwent follow-up testing and those who did not (n = 77,365). The participants who underwent follow-up were older and less educated compared to those who did not. In addition, those who underwent follow-up had a greater percentage of lower individual SES.
Table 3
Baseline characteristics between participants who underwent follow-up and those who did not
Cumulative incidence of cognitive impairment
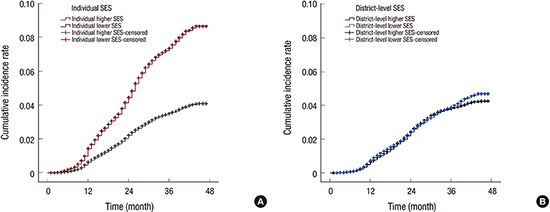
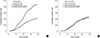
During 3 years of follow-up, 4,653 participants developed cognitive impairment. In the lower individual SES group, the CIR of cognitive impairment was 8.7% (95% confidence interval [CI], 8.64–8.70), whereas the CIR of cognitive impairment in the higher individual SES group was 4.1% (95% CI, 4.08–4.10) (with a relative risk [RR] of individual SES: 2.1, P for group < 0.001) (Fig. 2A). In terms of district-level SES, the CIR of cognitive impairment in the lower district-level SES was 4.7% (95% CI, 4.52–4.86), while that in the higher district-level SES was 4.3% (95% CI, 4.06–4.44) (with a RR of district-level SES: 1.1, P for group, 0.026) (Fig. 2B).
Fig. 2
CIR for cognitive impairment according to SES. (A) Individual SES. The individual lower SES group shows a higher CIR for cognitive impairment over 3 years (8.7%, 95% CI, 8.64–8.70) compared to the CIR for cognitive impairment of the higher SES group (4.1%, 95% CI, 4.08–4.10) (P for group < 0.001). The RR for cognitive impairment of the individual lower SES group is 2.1. (B) District-level SES. The CIR of cognitive impairment in the district-level lower SES was 4.7% (95% CI, 4.52–4.86), while that in the district-level higher SES was 4.3% (95% CI, 4.06–4.44). The RR for cognitive impairment of the district-level lower SES group is 1.1.
CIR = cumulative incidence rate, SES = socioeconomic status, CI = confidence interval, RR = relative risk.
Interactive effects of individual and district-level SES
Table 4 shows the CIR of cognitive impairment according to the 4 stratified groups. The CIR of ILDL was 9.1% (95% CI, 8.33–9.88), significantly higher than the 3.9% (95% CI, 3.67–4.05) observed in those participants with IHDH (RR, 2.4, P for group < 0.001). However, there was no additive or synergistic interaction between individual and district-level SES on the CIR of cognitive impairment.
Table 4
CIR according to 4 groups stratified by individual and district-level SES
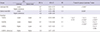
CIR = cumulative incidence rate, SES = socioeconomic status, CI = confidence interval, RR = relative risk, ILDL = having individual lower SES and district-level lower SES, ILDH = having individual lower SES and district-level higher SES, IHDL = having individual higher SES and district-level lower SES, IHDH = having individual higher SES and district-level higher SES.
*P < 0.05.
Adjustment of various risk factors
The individual lower SES (HR, 1.6; 95% CI, 1.49–1.77), lower education (HR, 1.6; 95% CI, 1.40–1.72), and history of stroke (HR, 1.7; 95% CI, 1.49–1.89) are the top 3-ranked independent risk factors for the cognitive impairment.
For the individual SES, Table 5 showed different HR according to the 5 models that we constructed for adjusting explanatory variables. The unadjusted model showed that individual lower SES had a higher HR for cognitive impairment than individual higher SES (2.1, 95% CI, 1.97–2.28) (Table 5). After adjusting for the baseline demographics (model 1), the HR was reduced slightly, but the individual lower SES group still had a higher risk for cognitive impairment (HR, 1.8; 95% CI, 1.62–1.88). Further adjustment for cardiovascular risk factors also decreased the HR to 1.7 (model 2), which was similar to our findings after adjusting for health-related behaviors (model 3) and social relationships (model 4). Finally, after all the risk factors were adjusted (model 5), the individual lower SES group demonstrated a higher risk for cognitive impairment (HR, 1.6; 95% CI, 1.53–1.80). We also compared the HR of district-level SES on the development of cognitive impairment according to the 5 models same as the individual SES. The unadjusted HR of district-level SES was 1.1 (95% CI, 1.01–1.13), which has seldom been changed after adjusting all the explanatory variables (HR, 1.1; 95% CI, 1.03–1.16).
Table 5
Adjusted association between risk factors for cognitive impairment and individual SES

DISCUSSION
This 3-year retrospective observational study clearly indicates that individual and district-level socioeconomic inequalities are independently attributable to the development of cognitive impairment among community-dwelling healthy elderly in Seoul, although the effects of district-level SES on the development of cognitive impairment were minimal (RR of district-level SES: 1.1, P for group, 0.026). Our study shows that the individual SES contributes 1.9 times greater to the development of cognitive impairment than the district-level SES (RR of individual SES: 2.1 vs. RR of district-level SES: 1.1). Interestingly, however, there were no synergistic or addictive effects of individual and district-level SES on the development of cognitive impairment in the healthy elderly.
From our study, we find that baseline characteristics between lower and higher SES groups are considerably different in terms of demographics, cardiovascular risk factors, health-related behaviors, and social relationships. The lower SES group, both individual and district-level, herein had more cardiovascular risk factors than the higher SES group, which is in line with findings from previous studies (518).
One of our major findings is that the CIR of cognitive impairment over 3 years is 2.1 times higher in the individual lower SES group than in the individual higher SES group. In addition, even after adjusting all the different risk factors between the 2 groups, the individual lower SES group still has 1.6 times greater risk for the development of cognitive impairment than the individual higher SES group. Accordingly, our findings suggest that individual lower SES itself may be an independent risk factor for the development of cognitive impairment, which is consistent with previous studies (45).
It is noteworthy that there were only minimal impacts of the district-level lower SES on the development of cognitive impairment in the elderly, which is contrary to the previous findings (31219202122). The big difference between the previous studies and the current study is the measurement of district-level SES. Most previous studies have used the combinational measurement for the district-level SES, which are generated from several individual variables including percentage of household in poverty, percentage of low education, families with a single parent and so on (192021). In this study, however, we considered the local tax from each district as a measure for the district-level SES, which could represent infrastructure of each district including industry and business activity (11). Therefore, it is plausible that the significant relationship between district-level SES and cognitive function from the previous studies could be influenced by the combinational measurement for the district-level SES, which might cause undifferentiated outcomes between district-level and individual SES since the combinational variables are produced from the several individual variables. In addition, one possible reason is that unknown confounding/modifying factors associated with district-level SES are also related to cognitive outcomes since the mechanisms from lower district-level SES to individual cognitive impairment is difficult to examine.
Our findings showing that individual lower SES revealed a greater incidence of cognitive impairment can be justified and explained in several ways. First, poorer health status, such as increased comorbidities, could exacerbate the decline of cognitive function among people with lower SES (2324). However, our results show that the HR of cognitive impairment in the individual lower SES group remains approximately 1.6 times greater than the risk of cognitive impairment in the individual higher SES after adjusting for all the risk factors at the baseline, including demographics, cardiovascular risk factors, health-related behaviors, and social relationships (Table 5). It is remarkable that these risk factors explain only 23.8% of disparities in the risks for the development of cognitive impairment, thus suggesting that the greater risk for cognitive impairment among individual lower SES groups is not simply attributable to a higher prevalence of comorbidities or poorer health status, including limited social relationships. Second, people with individual lower SES may be less likely to engage in cognitive-stimulating activities, such as reading books or participating in social activities. According to the cognitive reserve theory, it is understood that high levels of cognitive activity are protective against the development of dementia (2526). Therefore, it is plausible that lesser participation in various cognitive activities may exacerbate cognitive impairment in lower SES groups. Finally, one hypothesis is that psychological stress in people with individual lower SES may lead to an increased allostatic load on stress regulatory systems, including limbic areas and the hippocampus, which might impair the regulatory neuroplasticity of the brain (27). This impairment of limbic neuroplasticity could promote the development of cognitive impairment among people with individual lower SES.
This study has several limitations. First, we did not examine all the possible risk factors that are related to poor cognitive function, such as genetic factors (e.g., APOE), depression, the amount of cognitive leisure activity, or sleep and nutritional status. Second, we did not have any information about the compliance of participants with treatment for cardiovascular diseases or other comorbidities. Third, the types of insurance and risk factors for cognitive decline were measured only at the baseline. Fourth, the proportion of participants receiving MA services (10.1%) in our study is higher than that of the elderly aged 60 years or older (7.2%) in Korea (15). On one hand, this may be a selection bias that impacts our results, but on the other hand, the participants in our study may better represent the characteristics of the individual lower SES. Finally, local tax of each district may not represent the quality of environment such as accessibility to a community center, which also might influence cognitive function in the elderly.
Nonetheless, the strengths of this study include the following. First of all, this study is based on longitudinal observation of a very large number of community-dwelling elderly in urban areas. Second, our measurement of SES according to the type of insurance of recipients arguably reflects the general SES of individuals at a more integrated and precise level than traditional measures of SES such as education. For example, because the link between education and income is weaker in older women than in other demographics, using educational achievement as a proxy for SES may be limited among older women (1828).
To conclude, we find that individual lower SES is associated with higher incidence of cognitive impairment and a greater risk for the development of cognitive impairment. In addition, individual SES contributes 1.9 times greater to the development of cognitive impairment than the district-level SES. Our results may suggest that individual SES disparities could be considered as an important factor in public health related to cognitive impairment in the elderly.
 XML Download