

 PDF
PDF ePub
ePub Citation
 Print
Print


INTRODUCTION
Social inequalities within the context of all-cause infant mortality have been addressed (1234). However, little is known of social disparity in infant mortality with regard to the specific causes of death, and social disparity trends over time according to specific causes of infant death.
In Korea, all-cause infant mortality has encouragingly been in a downtrend. Korea is ranked as the 10th lowest level among Organisation for Economic Co-operation and Development (OECD) countries in all-cause infant mortality. However, this decreasing trend has slowed for several specific causes of infant deaths since 2011 (5). In addition, the top specific causes of infant mortality have been changing. The R00–R99-coded deaths used for “Not classified symptoms, signs and findings (International Classification of Diseases 10th revision [ICD-10])” have now become the primary cause of infant mortality. “Congenital malformations” (Q00–Q99), which in the mid-1990s was the primary cause of infant mortality, has been ranked second since 2000 (6).
Until now, the aforementioned category “Not classified symptoms, signs and findings (R00–R99-coded deaths) have been considered as merely as an “unknown” disease as a whole (78). However, because code item “Sudden infant death syndrome (SIDS)” (R950) and “Ill-defined and unspecified causes” (R990) in this “unknown” disease category has become the first ranking cause, there is an even greater need to investigate the causes of infant deaths. However, only a few studies have addressed which diseases contribute most to the social disparities in infant mortality. Little consideration has been given to the study of social disparities in unknown causes of infant mortality, including ill-defined and unspecified causes and especially concerning SIDS.
How the changes in occurrence of specific causes of infant mortality contribute to the inequalities in infant mortality needs to be clarified. This study aims to analyze infant mortality trends by cause of death and disparities in infant mortality according to parental social class. It is hope that the findings will provide insight into efforts to reduce the social inequalities of infant mortality and will inform policies that seek to reduce the social inequalities of infant mortality.
MATERIALS AND METHODS
Nationwide cohort data were obtained by linking birth and death certificates from the Statistics Korea from 1995 to 2009. A total of 8,209,836 births and 15,866 deaths were used in the statistical analysis, after excluding infants whose birth weight was less than 500 g or whose gestational age was less than 22 weeks (in accordance with the World Health Organization survival standard). Infant death was defined as death within a year after birth. Infants who were not identified as dead were followed-up for a year after birth.
Information on parental education level and employment, which are socioeconomic risk factors of infant mortality, were obtained from the birth certificates. Factors regarding maternal obstetrical history include the number of children, number of deaths of children, gestational age, parity, birth weight, and child gender. Parental education level was classified as ≥ university (≥ 13 years), high school (10–12 years), or ≤ middle school (≤ 9 years). Parental employment consisted of the non-manual group (e.g., legislators, senior officials, managers, professionals, technicians and practical professionals, office workers, service workers, and sales workers), manual group (e.g., skilled agricultural, forestry and fishery workers, craft workers, device/machine operators/assemblers, and laborers), and the economically inactive group (e.g., unemployed, students, housekeepers, and soldiers).
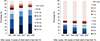
In this study, after comparing the distribution of “3-character categories (cause-specific mortality)” defined by ICD-10 as well as “4-character subcategories (detailing cause-specific mortality)” defined by ICD-10 of infant death, we selected the top four “3-character categories” and the top four “4-character subcategories” of infant death between 1995 and 2009. The causes of infant death were classified by the Korean Standard Classification of Disease into “3-character categories” of infant death between 1995 and 2009: “Conditions in perinatal period” (P00–P96); “Congenital malformations” (Q00–Q99); “Not classified symptoms, signs and findings” (R00–R99); and “Injury, poisoning and of external causes” (S00–T98). In addition to these four causes of infant death, “4-character subcategories” of infant death with a relatively high prevalence between 1995 and 2010, based on data from the National Statistics Office of Korea, were also studied. These included “Congenital malformation of the heart” (Q249); “SIDS” (R950); “Ill-defined and unspecified causes” (R990); and “Respiratory distress syndrome of newborns (RDS)” (P220) (Fig. 1).
Fig. 1
Percentage of cause-specific infant death in the time trend of 1995–1999, 2000–2004, and 2005–2009.
To examine the trend of infant mortality, birth years were classified into three intervals: 1995–1999, 2000–2004, and 2005–2009. We calculated infant mortality rate as being the number of deaths of children aged less than one year old per 1,000 live births in the same birth interval. The disparity of cause-specific infant mortality according to parental education and employment was examined using the difference in infant mortality rate and the adjusted hazard ratio (HR) from a Cox proportional hazard model. The adjusted HRs were calculated after adjusting for infants' gender, parents' age, maternal obstetrical history (e.g., parity, number of children, and number of deaths among children), gestational age, and birth weight. We tested for an increasing trend of disparity in cause-specific infant mortality over time by analyzing for causality-linked differences in infant mortality rate and performed tests on adjusted HR using linear regression modeling. All analyses were performed using SAS 9.3 (SAS Institute Inc., Cary, NC, USA), and the significance level was set at 0.05.
RESULTS
All-cause mortality according to parents' social class
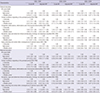
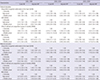
Table 1 presents the all-cause infant mortality rate of each birth year interval. In all birth-year intervals, the infant mortality rate was higher when the parental educational level was lower, when paternal employment was in the economically inactive status, when maternal employment was manually active or economically inactive, when parental age was either < 25 years or ≥ 40 years, and when the infants were in the preterm birth (PTB) or low birth weight (LBW) state.
Table 1
Infant mortality rate according to parental age, parental education, parental employment, and birth characteristics in Korea in the time trend of 1995–1999, 2000–2004, and 2005–2009
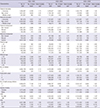
The all-cause infant mortality rate per 1,000 infants in each birth-year interval decreased with time (2.20 for infants born in 1995–1999, 1.83 for infants born in 2000–2004, and 1.67 for infants born in 2005–2009; P < 0.001). The mortality rate increased over time for LBW infants (P < 0.050).
Cause-specific infant mortality, according to parental education
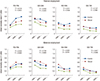
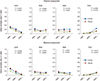
The difference in infant mortality rate for cause-specific deaths “3-character categories” in the in the ICD-10 between infants with the highest and the lowest parental education levels was the largest for “Not classified symptoms, signs and findings” (R00–R99-coded deaths). The difference increased over time (P = 0.003 for paternal education; P = 0.004 for maternal education). The infant mortality rate for “Conditions in perinatal period” (P00–P96) increased for infants with all paternal education levels, and the infant mortality rate for “Congenital malformations” (Q00–Q99) was found to be decreasing for infants with all maternal education levels. In particular, the infant mortality rate for “Not classified symptoms, signs and findings” (R00–R99) was increased for infants whose parents' educational level was the lowest (Fig. 2).
Fig. 2
Difference in infant mortality of cause-specific death according to parental education in the time trend of 1995–1999, 2000–2004, and 2005–2009.
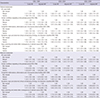
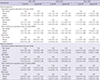
In all birth-year intervals, infants' death risk from any of four “3-character categories” increased in conjunction with increasingly lower parental educational levels after adjusting for gender, parental age, maternal obstetrical history (parity, the number of children, and the number of death among children), gestational age, and birth weight. The adjusted HR for infants was the largest for both “Not classified symptoms, signs and findings” (R00–R99) and “Injury, poisoning and of external causes” (S00–T98) in relation to parental educational level in every birth-year interval; when comparing infants whose parents had a middle school or lower educational level with infants whose parents had a university-level education or higher (Table 2). Identification was made of the major causes of death for which the social inequalities between a parental educational level of either university or higher vs. middle school or lower) increased the risk of infant mortality over time. These major causes of death included “Congenital malformations” (Q00–Q99) (P < 0.010), “Not classified symptoms, signs and findings” (R00–R99) (P < 0.001), and “Injury, poisoning and of external causes” (S00–T98) (P < 0.010) for paternal education (Table 2). For maternal education, this was “Not classified symptoms, signs and findings” (R00–R99) (P < 0.001), which coincided with the analysis of difference for parental education in infant mortality rate (Table 2).
Table 2
Adjusted HRs of cause-specific infant mortality (95% CI) according to parental education in the time trend of 1995–1999, 2000–2004, and 2005–2009
Cause-specific infant mortality, according to parental employment
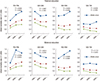
The difference in the infant mortality rate for cause-specific deaths “3-character categories” between infants whose fathers' employment was either non-manually active or economically inactive was the largest for “Conditions in perinatal period” (P00–P96) and it increased (P = 0.014). Infant mortality rates for “Conditions in perinatal period” (P00–P96) increased over time for infants regardless of paternal employment status, whereas infant mortality rates for “Congenital malformations” (Q00–Q99) were found to be decreasing over time for infants regardless of parental employment status. Infants from families whose mothers engaged in manual employment had higher mortality rates than infants with economically inactive mothers (Fig. 3).
Fig. 3
Difference in infant mortality of cause-specific death according to parental employment in the time trend of 1995–1999, 2000–2004, and 2005–2009.
The adjusted HR of death for infants with economically inactive fathers or manually employed mothers was larger for all birth-year intervals as compared with those whose parental employment was non-manual. The adjusted HR for infants was the largest for “Not classified symptoms, signs and findings” (R00–R99) or “Injury, poisoning and of external causes” (S00–T98) in every birth-year interval according to paternal employment, and for “Not classified symptoms, signs and findings” (R00–R99) according to maternal employment (Table 3). There was no increasing trend in adjusted HR for parental employment status (Table 3).
Table 3
Adjusted HRs of cause-specific infant mortality (95% CI) according to parental employment in the time trend of 1995–1999, 2000–2004, and 2005–2009
Cause-specific infant mortality according to infant's LBW or PTB
The risk for all-cause infant mortality increased over time for infants with LBW (P < 0.001) or PTB (P = 0.002). The adjusted HR for infants with LBW or PTB was the largest for “Conditions in perinatal period” (P00–P96). The adjusted HR for infants with LBW increased for “Conditions in perinatal period” (P00–P96) (P = 0.022) and “Congenital malformations” (Q00–Q99) (P = 0.019). The adjusted HR for infants with PTB increased for “Conditions in perinatal period” (P00–P96) (P = 0.017) and “Injury, poisoning and of external causes” (S00–T98) (P < 0.001) (not shown).
Detailed cause-specific infant mortality, according to parental education
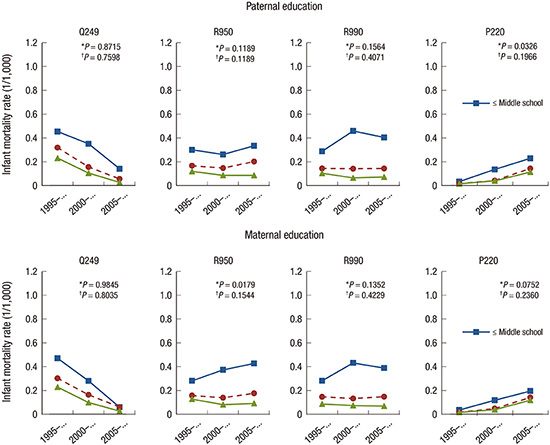
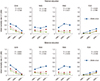
The difference in infant mortality rate for detailed cause-specific death (“4-character categories”) between infants with the highest vs. the lowest parental educational levels was the largest for both “Ill-defined and unspecified causes” (R990) and “SIDS” (R950). It was found to be increasing for “SIDS” (R950) over time (P = 0.018) for infants according to maternal educational level (Fig. 4).
Fig. 4
Difference in infant mortality of detail cause-specific death according to parental education in the time trend of 1995–1999, 2000–2004, and 2005–2009.
The adjusted HR for “Ill-defined and unspecified causes” (R990) according to parental educational level was the highest of that of all birth-year intervals (Table 4). The social inequalities of infant mortality according to paternal educational level increased over time for “Congenital malformation of the heart” (Q249) (P < 0.050), possibly due to the very low infant deaths due to “Congenital malformation of the heart” (Q249) in 2005–2009 for infants whose fathers were the highest-educated; the adjusted HR according to maternal educational level increased over time for “SIDS” (R950) (P < 0.010) (Table 4).
Table 4
Adjusted HRs of detail cause-specific infant mortality (95% CI) according to parental education in the time trend of 1995–1999, 2000–2004, and 2005–2009
HR = hazard ratio, CI = confidence interval, SIDS = sudden infant death syndrome, RDS = respiratory distress syndrome of newborns.
*Adjusted for gender, parents' age, maternal obstetrical history (parity, the number of children, the number of death among children), gestational age, birth weight; †P value for trend < 0.050; ‡ < 0.010.
Detailed cause-specific infant mortality, according to parental employment
The difference between the infant mortality rate of the detailed cause-specific deaths “4-character categories” of infants whose father was either non-manually employed or who was economically inactive was the largest for “Ill-defined and unspecified causes” (R990). While differences in the infant mortality rate according to parental employment were increasing for “RDS” (P220) (P = 0.041 for paternal employment; P = 0.012 for maternal employment), the crude mortality rates were very low for all parental employment status (Fig. 5).
Fig. 5
Difference in infant mortality of detail cause-specific death according to parental employment in the time trend of 1995–1999, 2000–2004, and 2005–2009.
The adjusted HRs of infants were the highest both for “Ill-defined and unspecified causes” (R990) according to paternal employment and for R990 and “Ill-defined and unspecified causes” (R990) according to maternal employment in every birth-year interval (Table 5). The adjusted HR for “RDS” (P220) increased over time for economically inactive paternal employment status (P < 0.050), but each adjusted HR was not statistically significant.
Table 5
Adjusted HRs of detail cause-specific infant mortality (95% CI) according to parental employment in the time trend of 1995–1999, 2000–2004, and 2005–2009
HR = hazard ratio, CI = confidence interval, SIDS = sudden infant death syndrome, RDS = respiratory distress syndrome of newborns.
*Adjusted for gender, parents' age, maternal obstetrical history (parity, the number of children, the number of death among children), gestational age, birth weight; †P value for trend < 0.050.
DISCUSSION
This study presents social inequalities in infant mortality in Korea, along with their increasing trends. The main findings of this study are that the social inequalities in infant mortality, according to parental education and employment, was larger for “Not classified symptoms, signs and findings” (R00–R99) and “Injury, poisoning and of external causes” (S00–T98), particularly for “Ill-defined and unspecified causes” (R990), and “SIDS” (R950). The causes of death for which the social inequalities of the risk of infant mortality increased over time included “Not classified symptoms, signs and findings” (R00–R99), “Injury, poisoning and of external causes” (S00–T98)”, and “Conditions in perinatal period” (P00–P96) for paternal education, and “Not classified symptoms, signs and findings” (R00–R99) for maternal education, particularly “SIDS” (R950) for maternal education.
This present study found social inequalities and an increasing gap of social inequalities were specific causes of infant mortality, consistent with previous studies (9101112). Social inequalities in infant mortality in our study can be explained by social inequalities in the social development process. The lower segments of the social class — being alienated from the means, act, and products of production — include the unemployed, those deprived of their means of living, and those lacking the ability to take care of their children. These social inequalities bring about social inequalities in infant mortality as well as an increased social inequalities-based gap in infant mortality. This causal pathway of social inequalities in infant mortality might be similarly applied to locations around the world in the contemporary era.
What makes our study different from other studies is that social inequalities in infant mortality were greater and more markedly increased over time when descriptive of the social status of the paternal side rather than of the maternal side, in particular for “Not classified symptoms, signs and findings” (R00–R99, especially for “SIDS” [R950]), “Conditions in perinatal period” (P00–P96, especially for “RDS” [P220]), and “Injury, poisoning and of external causes” (S00–T98). This finding can be explained by the two economic crises that occurred between 1995 and 2009 (1997–1998 and 2007–2008), which negatively influenced the economic status of the fathers who were, in many cases, responsible for the welfare of the whole family and whose disrupted economic status led to the aggravation of social inequality, which has been linked to infant mortality. The two economic crises caused massive unemployment and the downsizing of income due to industry restructuring, which produced asset inequalities and increasing inequalities in residence in Korea (13).
This study found that the several specific causes of infant deaths such as “Not classified symptoms, signs and findings” (R00–R99) (“SIDS” [R950], “Ill-defined and unspecified causes” [R990]), “Conditions in perinatal period” (P00–P96) (“RDS” [P220]), and “Injury, poisoning and of external causes” (S00–T98) are more influenced by social class. Social inequalities in infant deaths were greater for infant deaths due to “Not classified symptoms, signs and findings” (R00–R99), in particular due to “SIDS” (R950) and “Ill-defined and unspecified causes” (R990). This result is similar to that of the previous studies, which showed that socioeconomic factors (14) such as education (151617), poverty (181920), and race (1219) are the major risk factors for SIDS.
The major risk factors of SIDS, such as premature birth, LBW, growth-restriction, and a maternal history of multiple gestations, as well as the modifiable factors of SIDS that include such as maternal and paternal smoking, drug use, alcohol use, and insufficient prenatal/postnatal care are found more frequently among infants with parents of a lower social status (2122). In particular, environmental sleep factors hazards that include adults sleeping with an infant in the same bed with a shared sleep surface, having infants sleep in the same room as adults, covering an infant's head or face with bedding, prone sleeping, and sleeping without parents or guardians have a social gradient in the same direction as SIDS (23). These risk factors are likely the intermediate factors in the relationship between socioeconomic status and SIDS.
In Korea, one of the main reasons of social inequalities in SIDS might be inequalities in the living conditions. Koreans in a lower social class are suffering a lack of living space (affordable housing). About 70% of the low social class in Seoul lives in an underground or a semi-underground place. Overcrowding in the lower social class is increasing. The poorest of the poor live in overpopulated areas in tiny rooms where they are usually not enough space for a separate bed for the infant (13).
In Korea, 57.5% (204/355) of SIDS cases had been reported as being due to a bed-sharing situation. Of the 204 cases, 121 deaths (59.3%) occurred between 1998 and 2008 (24). Seventy-five of 168 SIDS cases (44.7%) occurred in infants sleeping the prone position or who had been lying on their side (24). In addition, 34% (108/355) SIDS cases occurred outside the home, such as in a nursery/day care setting or in a relative's accommodation (24). This tells us that the infants in the lower social class, who cannot receive proper care either in their home or in a nursery/day care center might be placed in an inadequate sleep position or in a prone position or in the bed-sharing situation, leading to the occurrence of SIDS.
There have been several SIDS cases that occurred in a child care center in Korea. The infants in the child care center mostly come from parents or a single parent (such as a single mother) of a low social class, individuals (from within Korea) who cannot take care of their children.
Therefore, if we deduce a causal pathway of socioeconomic factors as related to SIDS in this study, parents in the low social class cannot take care of their children as they have to work to make a living or they have been in a materially deprived state, which may cause the infants to sleep in the prone position or to share a bed, or engage in other risky sleep situations, which increases the risk of SIDS.
Secondly, this study also shows that infant mortality due to “Conditions in perinatal period” (P00–P96), in particular “RDS” (P220) increased for infants with economically inactive fathers. RDS usually occurs in premature infants whose lung development has not yet fully completed (2526), and these premature infants are often born into families of a lower social class (2728). Therefore, the reason why RDS is related to social inequalities is because PTB, which is the main cause of RDS, occurs with greater frequency in the lower social classes than in the higher social classes (29). The most common cause of RDS is pneumonia (66.7%), followed by sepsis (24.2%), and aspiration (3.0%) (30). The common risk factors of infant mortality are related to being of a lower social class (3132).
Thus, we can deduce that among the lower social classes, early-induced PTB — with its risk of premature development of the lungs — places a child at risk of developing RDS. When fathers are economically inactive, their spouses might be exposed to material deprivation, which is detrimental to maternal health during pregnancy and also to the newborn's health, thus increasing the risk of PTB with underdevelopment of the lungs, thus incurring RDS.
Thirdly, inequalities in infant mortality due to “Injury, poisoning and of external causes” (S00–T98) according to paternal education level and employment increased in the present study.
Poverty is the primary cause of the child's injury. In particular, poverty is recognized as a major factor underlying infant death due to child injury. Major causes of deaths that occur before the first year include traffic accidents, falls, homicides, and drowning, most of which happen to children in poor families. Lower socioeconomic status of parents (whether they are low-educated, unemployed, or manual-working parents) influences unintentional-injury-related deaths of infants in Korea (33). Injuries, such as burns, traffic accidents, and drowning, affect infants from poor families because those infants who are in an economically impoverished class are comparatively more likely than their richer counterparts to be exposed to a hazardous environment that increases the risk of injury (34).
In particular, road traffic injury has a greater influenced on the socially disadvantaged group (3536). In addition, half of the falls occur in the home environment, such as falling down stairs or falling from a high location or a location lacking adequate protective railing or other safety features, which is related to the social environment of the lower social class. Especially, the main cause of the infant's falling is parental carelessness, which is related to the social environment in the lower social class. Also, infants' burns mostly occur in their home, which is also related to the lower social class (33). Injury caused by child abuse more often occurs among infants from the lower social class (37). This kind of abuse such as non-accidental death due to intentional traumatic injury in infants increased during the economic recession (37), which coincides with what this study suggests.
Injury caused by accidents is the main cause of infant death. Accidents have become a very big problem for infants aged 6 and 12 months. During this period, an infant needs constant monitoring and observation as they increase their motor skills, manipulation skills, and curiosity about the environment. However, some infant from lower social class cannot receive care from their parents, which increasingly causes child injury (37).
This study also highlights that the social gap as related to infant death for “Congenital malformations” (Q00–Q99) (and in particular, “Congenital malformation of the heart” [Q249]) was comparatively higher among the infants whose parents had lower levels of education, and increased according to the progressive lack of paternal education.
The data show that social inequalities have been increasing, while “Congenital malformations” (Q00–Q99) related infant mortality has been generally decreasing. The specific disease category of “Congenital malformations” (Q00–Q99) (especially “Congenital malformation of the heart” [Q249]) occurs mainly due to individual genetic factors, rather than socioeconomic ones. However, specific disease categories, such as “Congenital malformations” (Q00–Q99), contribute to social inequalities in infant mortality, as has been suggested (38). Poor socioeconomic conditions may aggravate an existing pathology of congenital cardiac disease (38). Thus, social factors might also have an effect on genetic causal pathways leading to infant deaths.
A final interesting finding in this study is that several diseases, such as “SIDS” (R950), “RDS” (P220), and “Congenital malformation of the heart” (Q249), which are related to parental social class, are also closely related to LBW and PTB, as has been reported (429).
Parents of a lower social class are more likely to have newborns with LBW or PTB, leading to premature infant death (29). Also, socioeconomic factors might have an effect on infant-mortality-mediating LBW or PTB. Socioeconomic factors increase the occurrence of LBW or PTB, which increases infant death. Therefore, LBW or PTB might become mediating factors influencing infant mortality. Thus, SIDS or RDS appear driven by socioeconomic factors that lead to material deprivation. These factors also increase LBW and PTB, which play roles as mediating factors with regards to the SIDS or RDS.
One strength of this study is that it includes 8,209,836 national births from a 15-year period (1995–2009) in Korea. This study has several limitations, including the possibility that some neonatal (0–27 days) deaths might have been omitted, as the dead neonate's parents might have been reluctant to report death to the National Statistics Office (3940). This omission of neonate deaths might understate the relationship between social disparity and specific causes of infant mortality, as the lower social class has a higher infant mortality rate shown in this study.
Additionally, the use of social class — such as educational level and employment status — as a proxy for real social class differentials may be problematic in that they might not be adequately representative of those differentials.
In conclusion, this study found that the social inequalities in infant mortality were greater for “Not classified symptoms, signs and findings” (R00–R99) and “Injury, poisoning and of external causes” (S00–T98), particularly for “Ill-defined and unspecified causes” (R990) and “SIDS” (R950). In addition, the social inequalities in infant mortality increased over time for “Not classified symptoms, signs and findings” (R00–R99), “Injury, poisoning and of external causes” (S00–T98), “Conditions in perinatal period” (P00–P96), and particularly for “SIDS” (R950) and “RDS” (P220). The reason for the increasing inequality of “Not classified symptoms, signs and findings” (R00–R99), in particular “SIDS” (R950), was the increasing inequalities of living conditions such as bed-sharing. The cause of “Conditions in perinatal period” (P00–P96), especially “RDS” (P220) and including the under-development of lungs, is also related to LBW and PT, which are in turn related to socio-economic status. In addition, the main cause of “Injury, poisoning and of external causes” (S00–T98) is related to a hazardous social environment due to lower social class and poverty, which is particularly related to a deficit of care for infants during the period of their first 6 to 12th months. This paper also shows that the social inequalities in the “Congenital malformations” (Q00–Q99), which are related with social class. “SIDS” (R950), “RDS” (P220), and “Congenital malformation of the heart” (Q249) were related with LBW or PBW, which might be related with infant death as mediating factors of social class. Lastly, the increasing tendency of SIDS, RDS might be related to the two times periods of economic crisis in Korea in the past 20 years.
This study suggests that those of lower social class (including parents who are lower educated or who are economically inactive) whose children are more likely than their less impoverished counterparts to experience a higher number of infant deaths (due to the specific causes of infant death as stated above) should be the target population within which priority could be given to the goal of tracing the health needs and implementing a health policy designed to tackle the social inequalities related to infant mortality. In particular, this study suggests that the “Not classified causes of deaths (in particular R00–R99-coded deaths)” should be considered as a crucial cause of the social inequalities in infant mortality, and we should investigate the detail mechanisms of “Not classified causes of death” more thoroughly to reduce inequality in health.
 XML Download