

 PDF
PDF Citation
 Print
Print


INTRODUCTION
Korea (officially the Republic of Korea) is the third youngest country in the Organization for Economic Co-operation and Development (OECD), but it is a rapidly aging country with regard to the average age of its inhabitants; in fact, it is expected to be the second oldest after Japan by 2050.1 As the middle-aged population has been growing, chronic diseases are becoming more common. For example, osteoarthritis (OA) is an age-related disorder resulting in both direct and indirect medical costs2; its disease burden involves not only medical expenses for treatment itself, but also consequent loss of productivity.3 According to the National Statistical Year Book of Korea for 2015, knee OA, as a single disease entity, was the fourth highest medical expense, costing approximately 6.9 billion dollars in the population aged over 65 years.4 The prevalence of OA in Korean adults over 50 is also growing; it was 13.0% in 2005 and grew to 14.3% in 2010, as estimated by the Korea National Health and Nutrition Examination Survey (KNHNES).56 There is a tendency for OA prevalence to increase with age, and OA is approximately five times more prevalent in those in their 70s than in those in their 50s, where there was a prevalence rate of 2.1% based on KNHNES from 2010 to 2013.7
There are several methods for estimating the economic burden of diseases. One, out-of-pocket (OOP) payments, refers to the direct payments by households after medical service use.8 Catastrophic health expenditure (CHE) is defined when a household's total OOP payments for health services equals or exceeds 40% of the household's non-subsistence spending capacity.8 This does not always mean high healthcare costs, because CHE depends on the extent of the individual's insurance coverage and the household income; even small costs for common illnesses can lead to impoverishment of poor households without medical insurance.9 Hence, protecting people from CHE is a crucial aim for health-policy makers.10
It is believed that OA increases medical expenditure, but a direct relationship between OA and CHEs has not been well studied. There are previous studies on the relationship between OA and economic cost, but these focused on the proportion of direct and indirect medical costs,1112 or were limited to the economic effects on specific populations of a given gender.313 There have also been several studies of OA in Korea, but these were confined to prevalence, characteristics of patients, or risk factors in a specific region.1415 We designed a study to assess the impact of OA on CHEs in Korea.
METHODS
Source of data
We conducted a cross-sectional study based on the Korea Health Panel Survey (KHPS) of 2013. This survey has provided annual comprehensive information to the public since 2008, stratifying representative samples in proportion to population size.16 The survey consists of demographic and socio-economic characteristics at the individual and household level, providing associated health care expenditures by total income quintile. It also contains information on inpatient care, outpatient care, and emergency service use for chronic illness. We extracted data from 5,200 of the households surveyed by KHPS in 2013 and matched their information with the claims database to determine the prevalence of OA in those households.
Definition of variables
Household's capacities to pay
A household's capacity to pay was the household's total income minus subsistence costs and food costs.817 Although food expenditure excluded cost of food eaten outside the home, there was no proper information about spending in restaurants in the KHPS. Thus, the total cost of food consumption was taken as food expenditure in this study.
Definition of CHE and its thresholds
CHE was defined by the World Health Organization (WHO) when direct health care costs exceeded 40% of a household's capacity to pay, and the threshold was adjusted for each country.18 The frequency of CHEs can vary depending on the level of threshold used,19 and there is controversy over the ideal threshold. Most researchers apply thresholds between 10% and 40%17202122232425; we evaluated CHEs at 10%, 20%, 30%, and 40% thresholds.
Statistical analysis
The main determinant of this study was OA. Households were stratified into two groups by the presence of at least one family member with OA, which was defined following the diagnostic code from M15.0 to M19.0 of the International Statistical Classification of Diseases and Related Health Problems 10th Revision (ICD-10) and the Korean Classification of Disease, 6th revision (KCD-6). Each household with OA patients was matched one-to-one with a household without an OA patient, depending on the presence of a family member suffering from a neoplasm, hypertension, heart disease, cerebrovascular disease, diabetes, or osteoporosis. These disease entities are generally related to high medical costs in Korea.26 Demographic characteristics included sex, age, economic status, and employment status. The presence of householders' spouses, education levels of householders, and types of health insurance were also considered. The distribution of CHEs were evaluated at each threshold level, and the χ2 test was used to assess statistical significance. Multivariable logistic regression models were used to identify the impact of the presence of OA patients among family members on the development of CHE according to cut-off values of 10%, 20%, 30%, and 40%. These models were used after adjusting for the following parameters at baseline: age, sex, education level of householder, employment status of householder, number of household members with comorbidities, and healthcare utilization (such as insurance type and private health insurance). All analyses were performed using SAS 9.2 (SAS Institute, Cary, NC, USA). P value less than 0.05 was considered statistically significant.
Ethics statement
The Institutional Review Board (IRB) of Hanyang University Hospital determined that this study was exempt from IRB review because we used existing, publicly available data and the information about the subjects could not be identified directly or through identifiers linked to the subjects (IRB file No. HYUH 2017-06-005). Informed consent was waived by the IRB.
RESULTS
Baseline characteristics
A total of 1,457 households with OA patients and 3,743 households without OA patients were identified, and 1,289 households in each group were matched by adjusting the presence of comorbidities other than OA. The general characteristics of the matched households are shown in Table 1.
Table 1
Baseline characteristics of households with or without OA patients
All households with OA patients had family members with at least one comorbidity, compared to 63 (4.9%) households without OA patients who had no comorbidities at all. The size of the household was not significantly different between households with OA patients and those without OA patients.
OOP expenditure in households with and without OA
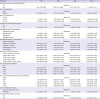
As shown in Table 2, the annual capacities to pay for households with and without OA patients were $14,166 and $19,865, respectively (P < 0.001). However, households with OA patients tended to pay higher annual OOP costs ($2,789) than households without OA patients ($2,607). The OOP payments of households with OA patients went significantly more on the purchase of prescriptions or over-the-counter drugs than on hospitalization.
Table 2
Annual OOP healthcare payments and capacity to pay of households with or without OA patients (1:1 matched)

OOP = out-of-pocket, OA = osteoarthritis, SD = standard deviation.
aPresented in United States dollars (USDs) at the exchange rate of 1,000 won (KRW) per 1 USD; bRatio of mean costs of households with OA patients to those without OA patients were noted; CHerbal medications including total purchase of herbal medications in pharmacies, herbal medicine shops, and oriental medical clinics; dHealth supplements are products used to supplement the diet, purchased in a pharmacy, hypermarket, or by internet.
Prevalence of CHEs in households with and without OA
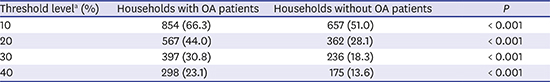
Of the households with OA patients, 66.3%, 44.0%, 30.8%, and 23.1%, were found to have CHEs at thresholds of 10%, 20%, 30%, and 40%, respectively (P < 0.001, Table 3). CHE in households without OA patients was less frequent: 51%, 28.1%, 18.3%, and 13.6% at the 10%, 20%, 30%, and 40% thresholds, respectively.
Table 3
Frequencies of CHEs at each threshold level

Values are presented as number (%).
CHE = catastrophic health expenditure, OA = osteoarthritis.
aThreshold level means direct health care costs divided by household's capacity to pay; CHE was defined when direct health care costs exceeded, variously, 10%, 20%, 30%, or 40% of a household's capacity to pay.
OA as a risk factor for CHE
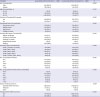
Several factors were associated with the occurrence of CHE as assessed in the multivariable regressions (Table 4). The presence of OA patients in each household was significantly related to CHEs at thresholds from 10% to 30%: 10% (odds ratio [OR], 1.48; 95% confidence interval [CI], 1.16–1.87), 20% (OR, 1.29; 95% CI, 1.01–1.66), and 30% (OR, 1.37; 95% CI, 1.05–1.78). However, OA was not a definite determinant that affected CHE at the 40% threshold (OR, 1.17; 95% CI, 0.87–1.57).
Table 4
Factors associated with the occurrence of CHEs at each threshold level
Also, households in higher quintiles of income were less likely to experience CHEs at thresholds of 10% and 20%. In fact, households in which the householder was highly educated rarely encountered CHEs at the 10% and 20% thresholds. However, there were no definite associations between other variables and the occurrence of CHE.
DISCUSSION
In this study, we compared households with OA patients to those without OA patients with regard to CHE. The households with OA patients experienced CHE more frequently at all thresholds, and this was associated with both increased OOP payments and lower household capacities to pay. The OOP costs of hospitalization and drug use were higher in the households with OA patients than in those without OA patients.
CHEs are determined by the number of family members, their average age, the total family income, the family members' employments, their educational levels, and their health insurance coverage.27 These are not only individual factors, but also social factors that can be influenced by a nation's policy. OOP medical costs can result in increased expenditure that reduces quality of life and promotes a transition to poverty.2829 Thus, CHEs have been considered in terms of the catastrophic impact of OOP payments at the household and national levels.192430 CHE is considered to reflect the extent of medical coverage and financial support given by the nation. Studies of CHEs have been conducted at different thresholds up to 40%, and CHEs could vary by definition of the threshold. The optimal threshold should depend on the society under consideration.18
There have been several attempts to discuss CHEs and their determinants in the context of the characteristics of the insurance system or change in insurance systems of a given country. Several studies focused on specific chronic diseases within a population exposed to CHE in respect of economic influence on society; occurrence of CHEs in patients having certain malignancies have been explored,3132 or interval change of CHEs in rheumatoid arthritis patients have been noted since biologic disease-modifying antirheumatic drugs (DMARDs) were introduced.333435 However, the relationship between OA and CHEs had not been clearly evaluated. A cohort study in Hong Kong found that OA contributed more to direct medical costs than in the West; in the former, direct medical costs excluding joint replacements ranged from Hong Kong dollars $11,690 to $40,180 per person per year.36
To build upon these previous results, we aimed to evaluate the relationship between CHE and another common illness, OA, in the general population. We observed that CHE was common in households with family members with OA. OA contributes to increased medical costs; in the United States, OA made the second largest contribution to medical costs, and 4.3% of all hospitalization-related costs were due to OA.37 Also, adult patients with non-rheumatic arthritis in the US had additional medical costs of $2,117 annually.38 In Singapore, the economic burden of OA increased 3-fold or more in patients who underwent total knee or hip replacement compared to a burden of $1,459 in those who did not undergo surgery.37
OA is a chronic disease that increases in prevalence with age, but the old also tend to have other chronic diseases. These can be confounding factors that lead to additional medical expenses. In our study, to minimize the unexpected influence of other illnesses on medical cost, OA households were paired with others having similar comorbidities including neoplasms, hypertension, heart disease, cerebrovascular disease, diabetes, or osteoporosis. Since having family members with chronic diseases also had a potent influence on CHE, we used multivariable regression models in our analysis.
The presence of OA patients in Korean households was significantly related to CHE at thresholds of 10%, 20%, and 30%, but not 40%. Korean national medical insurance and medicaid cover over 95% of the population; therefore, the 40% threshold is too high to be generalized to many other nations. OOP expenditure exceeding 40% of a family's total income is rare, and thresholds less than 30% are unusual in societies that have similar public health policies. From this point of view, OA was a definite independent factor contributing to CHE in Korean households even though its significance is only evident at thresholds up to 30%.
In addition, a low educational level of the head of household, and the presence of four household members with comorbidities contributed to the occurrence of CHEs at all thresholds. Householders themselves might be OA patients, in which case they would not be able to have highly productive occupations due to the physical limitations imposed by OA. Higher household economic level and number of household members did not influence CHE at any threshold level. These are socioeconomic factors that influence each other, and result in relatively little expenditure compared to total incomes.
OA contributed to several aspects of the occurrence of CHE. Households including OA patients tended to be in the lower income quantile and thus had a lower capacity to pay. Households with OA patients also made more OOP payments related to drug use and hospitalization than to attendance in outpatient clinic or emergency departments. On the other hand, it was clear that these households had a lower capacity to pay. This indicates that they also include a higher number of patients with comorbid conditions, even though we matched the two groups in terms of other comorbidities.
In general, Koreans tend to avoid surgical treatment because of a desire to use their own joints for as long as possible. Koreans have higher copayments than patients in other countries with comparable incomes due to non- or partial coverage of certain treatments.39 This might be a barrier to economically vulnerable patients being able to access medical facilities and could lead to significant extra expenditure on drugs.
This study supporting a close relationship between OA and CHE has several strengths. First, the data were based on panel surveys and national statistical data, which contain a wide range of variables. These two data sets were linked, while previous studies on CHE were solely based on surveys. Second, this study was optimized by adjusting each household for comorbidities other than OA, and confounding bias that might influence the interpretation of CHEs was minimized. Finally, we evaluated CHE at various thresholds so that the results could be compared with those obtained in other countries with similar medical insurance systems.
However, there were also potential limitations to this study. We defined OA using only diagnostic codes; thus, there was a possibility of overestimating the prevalence of OA patients in the households. This could have reduced the difference in OOP payments between households with and without OA patients. However, the diagnostic code itself was meaningful because it was selected based on the clinical judgement of physicians and symptoms reported by the patients themselves, and included not only radiologic but also symptomatic OA patients. Thus, any procedure or medication prescribed with the OA diagnostic code could be regarded as a reflection of the actual amount of medical expenses related to OA. The database lacked clinical information about the lesions involved and the severity of OA in each patient. This was because the Korean insurance system does not require specific diagnostic codes further specifying the attributes of OA.
If we had been able to set a threshold to knee or hip OA in the analysis, OA might have had more effect on CHE. Also, there could have been recall bias in the survey related to the use of health supplements or over-the-counter drugs, and this could have led to overestimating the magnitude of the influence on CHE. Nevertheless, this study makes a meaningful contribution to estimation of the impact of total OA, regardless of the parts affected, on CHE among.
In conclusion, we have shown that OA has a significant impact on the occurrence of CHE. OA is not just a problem for the individual, but a crucial factor affecting the economic burden on a household. Policy makers should consider the economic burden of OA in the real world and investigate how to reduce extra medical costs incurred by OA patients under the current health care system.
 XML Download