

 PDF
PDF Citation
 Print
Print


INTRODUCTION
Obesity has become a significant health issue globally. The prevalence rate of obesity in children and adolescents from 7 to 18 years old in Korea was 14.3% in 2016 and 8.4% in 2008.1 The prevalence rate in preschool kids was 2.8% in 2016, and 1.4% in 2008. The rate had rapidly increased and reached double within one decade. Nonalcoholic fatty liver disease (NAFLD) is a common chronic liver disease in children.234 With gradually increasing rates of childhood obesity, the incidence of NAFLD increases as a result of early and long-term exposure to obesity and related inflammation.5 NAFLD is defined as liver fat infiltration of 5% or more hepatocytes evaluated by liver biopsy, when there is no evidence of alcohol consumption, drug-induced, viral, or autoimmune liver disease. NAFLD can range from intrahepatic fat accumulation alone (steatosis) to the triad (fatty infiltration, inflammation, and fibrosis), termed nonalcoholic steatohepatitis (NASH).6
Most patients are asymptomatic. The known risk factors in pediatric NASH cohorts include obesity, male sex, hypertriglyceridemia, and insulin resistance.78 The elevation of serum aminotransferase levels are not specific or sensitive markers for NASH. No biomarkers are currently a reliable alternative to biopsy. Although ultrasonography detects NAFLD, recent imaging modalities cannot distinguish between steatosis and NASH. A liver biopsy is requested for a delimiting diagnosis. The long-term prognosis of NASH that develops in childhood is unknown. Approximately 25% of patients with NASH can develop progressive fibrosis and consequential cirrhosis.9 Childhood NASH is associated with severe metabolic disorders such as insulin resistance, abdominal obesity, and hypertension, as in adults.9
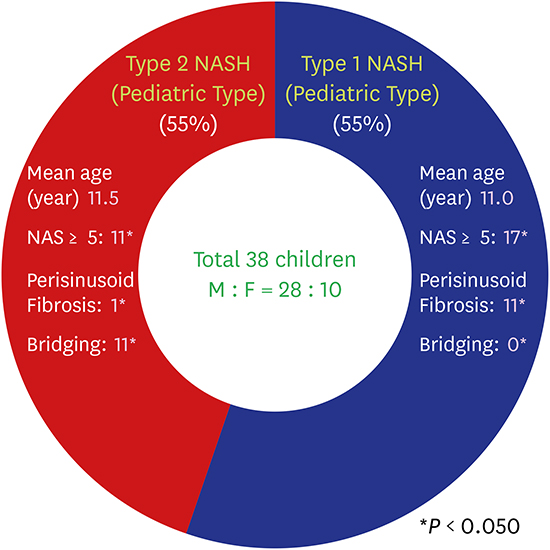
Schwimmer et al.10 categorized NASH into two established patterns in children; type 1 (adult-type) and type 2 (pediatric-type). The characteristics of the two types are as follows: In adult-type NASH, the distribution of steatosis is more common in zone 3, and is associated with ballooning, lobular inflammation, and perisinusoidal fibrosis. This type is usually observed in adult-onset NASH, but sometimes noted in pediatric patients. In pediatric-type, steatosis is not confined to a specific area but is more extensively distributed; the main site of inflammation and fibrosis is in the portal area, and ballooning is not noted. Pediatric-type is noted usually in children rather than in adults; however, it is still uncertain whether these differences originate through specific mechanisms in the development of these two types.
We performed this study to know the incidence of these two types of NASH (adult- and pediatric-type) in Korean children, the clinical characteristics of each type, and to determine the association between pathological type and clinical characteristics via anthropometric and laboratory data.
METHODS
Subjects
Among the children who visited the Pediatric Clinic for NAFLD at Hanyang University Hospital from January 2006 to November 2015, we performed liver biopsies in 44 patients with suspected NASH. NASH was diagnosed in 38 patients (28 boys, 10 girls).
Patients were identified and data was gathered via retrospective chart review. We selected patients who were 18 years old or younger and overweight with abnormal liver function test (LFT) results. We educated these children to modify their lifestyle by reducing their calorie intake and exercising more intensely. Medicine was not prescribed or introduced for the purpose of passive improvement of the liver dysfunction. We checked their LFT results every 2 months to assess improvement or lack thereof. We suspected hepatic pathologic lesions in the children who did not show any improvement in anthropometric data and LFT results more than 6 months after baseline assessment despite their efforts; then, we performed a liver biopsy. This observation period with lifestyle modification is recommended in the clinical guideline for pediatric NAFLD by US Preventive Service Task Force in 2010.11 These children were free of viral hepatitis, alcohol history, history of parenteral nutrition, drug toxicity, and genetic metabolic hepatic disease at the time of liver biopsy.
Anthropometric data
Abdominal imaging (ultrasonography or computed tomography) was performed in all patients to confirm the presence of fatty liver change.
Body mass index (BMI) was calculated for all patients. The BMI calculated as follows:
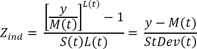
Weight percentile, height, BMI, and blood pressure (systolic and diastolic) were determined by age and sex, based on the 2007 Korean Pediatric Society and Korea Centers for Disease Control and Prevention child growth standard data. Z-scores for weight, height, and BMI were also calculated using standard weight, height, and BMI. The z-score for measurement y at age t was computed as:
Obesity was defined when the BMI for age and sex was greater than 95th percentile. Children who were older than 2 years with a BMI greater than or equal to 85th and less than 95th percentiles belong to the overweight category. Hypertension was defined as a blood pressure (systolic or diastolic) exceeding the 95th percentile for age, height, and sex.
Laboratory evaluation
Laboratory evaluation included LFT (serum alanine aminotransferase [ALT], aspartate aminotransferase [AST], gamma-glutamyl transpeptidase [GGT], total bilirubin, and albumin levels), fasting lipid profiles (total cholesterol, triglyceride [TG], high-density lipoprotein [HDL] cholesterol, low-density lipoprotein [LDL] cholesterol, free fatty acid [FFA]), fasting blood glucose, and complete blood count [CBC] such as white blood cell [WBC], hemoglobin, hematocrit, and platelet.
Insulin sensitivity index and insulin resistance were also calculated as follows12:
Homeostasis model assessment of insulin resistance (HOMA-IR) = fasting insulin (μIU/mL) × fasting glucose (mg/dL) / 405
Quantitative insulin sensitivity check index (QUICKI) = 1/[log fasting insulin (μIU/mL) + log fasting glucose (mg/dL)]
Plasma lipid levels were measured after at least a 12-hour overnight fast. Abnormalities were defined as TG greater than 150 mg/dL, and HDL less than 40 mg/dL, according to International Diabetes Federation (IDF) guidelines.17
Liver biopsy and pathologic investigation
Percutaneous needle liver biopsies were performed in all patients. Samples were taken from the right intercostal space, to avoid the pleura and blood vessels, with an 18-gauge needle automatic gun (Autovan; BARD GmbH/Angiomed, Karlsruhe, Germany). The skin to be biopsied was disinfected with povidone-iodine and local anesthesia was administered. All biopsies were at least 1.5 cm. Each specimen was fixed in formalin and paraffin-embedded sections were stained with hematoxylin-eosin and Masson trichrome. One hepato-pathologist, blinded to clinical and laboratory data, evaluated the liver biopsy samples.
The histological features including the amount of steatosis, inflammation (portal and lobular), and hepatocyte ballooning were evaluated. Fibrosis stage was assigned.
These features were graded according to the nonalcoholic fatty liver disease activity score (NAS) system.18 The steatosis was scored as 0 (less than 5%), 1 (5% or more, less than 33%), 2 (33% or more, less than 66%), or 3 (66% or more). Lobular inflammation was scored as 0 (no foci), 1 (less than 2 foci/200 × field), 2 (2–4 foci/200 × field), 3 (> 4 foci/200 × field). Ballooning was scored as 0 (none), 1 (few ballooning cells), 2 (many cells/prominent ballooning). Then, the NAS were determined by adding scores of steatosis, lobular inflammation, and ballooning. The NAS system is used to evaluate overall histological change and cannot replace the pathological diagnosis of NASH. However, generally, a NAS score of 5 or higher is considered diagnostic of NASH. Three or 4 scores are regarded as borderline, so this group can be divided between 3 diagnostic categories (“NASH”, “possible NASH”, or “not NASH”). So, patients with ballooning and lobular inflammation, in addition to lower NAS scores, can be diagnosed as NASH.1819 Fibrosis was scored as 0 (none), 1 (zone 3 perisinusoidal fibrosis), 2 (portal/periportal fibrosis), 3 (bridging fibrosis), and 4 (cirrhosis).
The liver biopsy specimens were classified into two types. Samples with characteristic features of zone 3 steatosis, ballooning and zone 3 perisinusoidal fibrosis were classified as type 1 or adult-type NASH, and more extensive steatosis, portal inflammation and fibrosis without ballooning and zone 3 perisinusoidal fibrosis were classified as type 2 or pediatric-type NASH.11
Statistical analysis
We used Student's t-test or Wilcoxon rank sum test or continuous factors (CBC, ALT, AST, TG, total cholesterol, HDL cholesterol, LDL cholesterol, total protein, albumin, total bilirubin) and Pearson's χ2 test or Fisher's exact test for categorical variables (hypertension, dyslipidemia) to determine which factors were significantly different between the two groups. P < 0.05 was considered statistically significant. SPSS version 21.0 (IBM Co., Armonk, NY, USA) was used for all analyses.
RESULTS
Clinical characteristics of the study subjects
The characteristics of the study group are summarized in Table 1. The mean age of the patients was 11.7 ± 2.21 years (range, 4–17 years). The number of male patients was thrice the number of female patients (male:female = 74%:26%). Most patients (95%) had ≥ 85th percentile for BMI. Among them, obesity was present in 55.26% of patients. Hypertension was observed in 31.8% of patients. No patient had diabetes mellitus.
Table 1
Characteristics of children enrolled in the study (n=38)
Values are presented as number (%) of children, mean ± standard deviation (range), or mean ± standard deviation.
BMI = body mass index, SBP = systolic blood pressure, DBP = diastolic blood pressure, AST = aspartate aminotransferase, ALT = alanine aminotransferase, GGT = gamma-glutamyl transpeptidase, TG = triglyceride, FFA = free fatty acid, HOMA-IR = homeostasis model assessment of insulin resistance, QUICKI = quantitative insulin sensitivity check index, ISI-FFA = insulin sensitivity index-free fatty acid, NASH = nonalcoholic steatohepatitis, NAS = nonalcoholic fatty liver disease activity score.
In most children, AST, ALT, and GGT levels were elevated to 69.9 ± 48.6 IU/L, 134.6 ± 111.5 IU/L, and 48.3 ± 32.0 U/L, respectively. TG levels were also elevated, 174.7 ± 93.3 mg/dL. FFA level was 576.2 ± 269.9 μmol/L; fasting glucose and insulin levels were 96.5 ± 11.2 mg/dL and 36.7 ± 41.1 μIU/mL, respectively. Mean HOMA-IR, QUICKI, and ISI-FFA were 5.33 ± 3.65, 0.29 ± 0.06, and 0.24 ± 0.19, respectively.
Histologically, 21 patients (55.3%) showed adult-type NASH and 17 patients (44.7%) showed pediatric-type NASH. The mean value of NAS was 5.0 ± 1.4.
Pathologic characteristics
The histological features of the patients are summarized in Table 2. In this study, 38 patients were classified into two groups (type 1 or type 2), according to their histological features, and then, each subgroup was divided into two groups according to NAS. There were 10 patients in the low score group (NAS from 0 to 4) and 28 patients in the high score group (NAS from 5 to 8). Mean NAS was higher in pediatric-type NASH (5.0 ± 0.86 for adult-type NASH, 5.3 ± 1.79 for pediatric-type NASH), but groups were not significantly different (P = 0.793). In the high score group; however, the adult-type NASH group had a significantly higher NAS value than the pediatric-type NASH group (P = 0.039)
Table 2
Classification according to NAS

| NAS | Type 1 NASH (adult-type) | Type 2 NASH (pediatric-type) | P value | |
|---|---|---|---|---|
| < 5 | 4 | 6 | 1.000 | |
| 0 | 0 | 0 | ||
| 1 | 0 | 0 | ||
| 2 | 0 | 0 | ||
| 3 | 1 | 2 | ||
| 4 | 3 | 4 | ||
| ≥ 5 | 17 | 11 | 0.039a | |
| 5 | 12 | 4 | ||
| 6 | 4 | 3 | ||
| 7 | 1 | 2 | ||
| 8 | 0 | 2 | ||
| Mean ± SD | 5.0 ± 0.9 | 5.3 ± 1.6 | 0.793 | |
Some degree of fibrosis was present in 84.2% of patients (n = 32). In the adult-type NASH group, 52.4% showed stage 1 (zone 3 perisinusoidal) fibrosis (n = 11) and 19% showed stage 2 (portal/periportal) fibrosis (n = 4). In the pediatric-type NASH group, stage 1 fibrosis was 5.9% (n = 1), stage 2 was 29.4% (n = 5), and stage 3 was 64.7% (n = 11) (Table 3). No patient had cirrhosis.
Table 3
Classification according to fibrosis score

Fibrosis was found in 71.4% (n = 15) of patients with adult-type NASH and 100% (n = 17) in pediatric-type patients. Therefore, hepatic fibrosis was more common in patients with pediatric-type NASH.
Comparing subtypes according to fibrosis score, a significantly greater number of patients with adult-type NASH had low scores (score 0 and 1), whereas a greater number of patients with pediatric-type NASH had high scores (score 3) (P values = 0.024, 0.004, and < 0.001, respectively).
Differences in laboratory results between type 1 NASH and type 2 NASH groups
The main laboratory characteristics of our patient sample are summarized in Table 4. There was no statistically significant difference in age and sex distributions in both two types nor in the severity of obesity. Type 1 NASH group had significantly lower albumin level and higher TG than type 2 NASH group. Hematocrit was also significantly lower in the type 1 NASH group. LFT (AST, ALT, and GGT) results, other dyslipidemia-related blood test results (HDL, LDL, FFA, and total cholesterol), and insulin resistance (HOMA-IR and QUICKI) were not statistically significant between groups. Insulin sensitivity (ISI-FFA) was lower in type 1 NASH group with marginal statistical significance (P value = 0.056). WBC, hemoglobin, and platelet were also not significantly different between groups.
Table 4
Anthropometric and laboratory data of the studied population
Values are presented as mean ± 2 standard deviations.
NASH = nonalcoholic steatohepatitis, BMI = body mass index, AST = aspartate aminotransferase, ALT = alanine aminotransferase, GGT = gamma-glutamyl transpeptidase, TG = triglyceride, FFA = free fatty acid, HDL = high-density lipoprotein, LDL = low-density lipoprotein, WBC = white blood cell, HOMA-IR = homeostasis model assessment of insulin resistance, QUICKI = quantitative insulin sensitivity check index, ISI-FFA = insulin sensitivity index-free fatty acid.
aP ≤ 0.05.
DISCUSSION
In recent years, NASH in adults has been extensively studied, yet little is known about NASH in children due to the difficulty performing liver biopsies in children. For this reason, we studied histologically verified NASH in children and focused on the subtypes (adult- and pediatric-type) in relation to their histologic characteristics and the anthropometric and laboratory differences between these subtypes.
The classical criteria of steatohepatitis are hepatic pathological findings of steatosis with ballooning, lobular inflammation, Mallory hyaline, or fibrosis. Based on these criteria, 86.4% of the biopsies in our study were diagnosed as NASH. The presence of fibrosis in 84.2% of these children in the current study also supports the opinion that childhood fatty liver disease can be severe. Schwimmer et al.10 classified two types of NASH in children. The first is the “adult-type” that shows the zone 3 distribution of steatosis, lobular inflammation, ballooning, and perisinusoidal fibrosis. The second is the “pediatric-type” that appears as steatosis with inflammation and fibrosis in the portal area without ballooning. Previous studies have revealed that pediatric-type NASH predominates in children.102021 However, in our study, there was a similar occurrence between the pediatric- and the adult-type, which was slightly different from earlier studies. Why the histological pattern of adult- and pediatric-types differ is not clear.22 One hypothesis that explains the difference in the histologic patterns of pediatric-type NASH is that the pathologic changes begin in zone 1, and then progress gradually to adult pattern. Another hypothesis is that pediatric-type pathology differs from adult-type NASH.23 Hepatic fibrosis in NASH occurs as a result of inflammation-related immune responses. In our case, fibrosis was more general and its score was higher in pediatric-type NASH than in adult-type. The staging system of fibrosis was defined by Brunt et al.,24 who reported the incidence of fibrosis was exceptionally high in many children. Our findings correspond to Brunt's fibrosis staging, and indicate the possibility of the latter hypothesis that the pediatric pattern is distinct from the adult pattern.
A “two-hit hypothesis” involving TG accumulation (first hit) and liver damage (second hit) was suggested by Day and James.25 A typical characteristic of the “first hit” is peripheral insulin resistance, which increases hepatocellular fat accumulation and lipid peroxidation. Under physiologic conditions, fatty acids are derived from various organs, and fatty acids are either β-oxidized in mitochondria or stored as TG. The excessive hepatic TG accumulation induces hepatic insulin resistance as well as impaired insulin responsiveness of the whole organism. Hyperinsulinemia and insulin resistance, lead to hepatic steatosis, and these increase FFA uptake into the liver. Consequently, these phenomena explain why high TG levels in NASH patients are correlated with high NAS. In our study, the age of the two groups was similar, but the TG levels were considerably higher in the adult-type group. Although hypertriglyceridemia is a risk factor for NASH, there are very few reports about the direct relationship between histological patterns of NASH and TG levels. Our study also demonstrated that TG levels were significantly higher in the adult-type group, while fibrosis was higher in the pediatric-type group, indicating no association between TG and fibrosis. Some studies also have shown a significant correlation between TG levels and portal inflammation than fibrosis.21 As shown in our outcomes, both two types demonstrated insulin resistance and weakened insulin sensitivity with borderline statistical significance in ISI-FFA. Even though the current study did not confirm insulin resistance as a determining factor in the types of NASH, additional studies with a larger sample may be required.
A typical feature of the “second hit” is oxidative stress induced by reactive oxygen species, which plays a major role in the progression to liver fibrosis.
Few studies on the relationship between severity of fibrosis and hematocrit have been conducted. Li et al.26 reported the greater the severity of fibrosis, the more hematocrit increased. The mechanism of increased hematocrit levels in NASH is not unclear. Li et al.26 attempted to explain it through the association of hypoxia and dyslipidemia, and obstructive sleep apnea.24 Hypoxia stimulates erythropoiesis and increases hematocrit levels.27 Additionally, hypoxia regulates the expression of genes involved in the production and metabolism of lipids and, as a result, promotes the progression of NASH by reducing insulin sensitivity.28 Besides hypoxia, serum TG levels may also be relevant to increased hematocrit levels in NASH. As TG circulates with other lipoproteins, higher TG levels increase large volume lipoproteins, such as very LDL or chylomicrons. These large lipoproteins increase the fluid resistance of blood flow, which increases blood viscosity and hematocrit.26 In our study, hematocrit was distributed to the normal range or upper normal limit, but the type 2 NASH group that presented a higher grade of fibrosis had a significantly higher hematocrit compared to the type 1 NASH group (Table 4).
As noted in our study, NASH incidence in male children was much higher. A related NASH animal study reported more severe and extensive damage in male sex.29 Sex hormones have been implicated as important factors in the development and prevention of steatohepatitis. Some studies have shown that estrogens may protect liver from NASH, while androgens may aggravate NASH.3031 Clark et al.32 reported that NAFLD is more common in postmenopausal than premenopausal women, and hormone therapy decreases the risk of NAFLD. In women with polycystic ovarian syndrome, hyperandrogenism was significantly associated with fatty liver disease, without any correlation with insulin sensitivity and BMI.33 Men with aromatase deficiency, induced by a CYP19 gene mutation, have congenital estrogen deficiency and eventual metabolic syndrome which are presented with progressive insulin resistance, and type 2 diabetes mellitus, acanthosis nigricans, cardiovascular complications, NASH after testosterone treatment for more than 2 years. All the problems developed in these men improved after 1-year of estrogen treatment.34 Hepatic steatosis has also been observed in aromatase knockout (ArKO) male mice. Therefore, the ratio of estrogen: testosterone may be a potential mediator in the development of insulin resistance and fatty liver changes. However, there was no statistically significant difference in sexual distribution between the two types in this study.
A few study limitations should be acknowledged. First, the study sample was acquired from a single center. Second, liver biopsy examinations were performed while the patients chronically showed liver dysfunction for over 6 months. Therefore, little is known about the hepatic pathology of NAFLD in children with normal ALT levels. Finally, because it is a retrospective study, we could not consider the Tanner stage of the children. The Tanner stage may affect insulin sensitivity and resistance; therefore, further studies are needed.
We conclude that type 1 (adult-type) and type 2 (pediatric-type) NASH are subtypes of pediatric NASH and have an almost similar distribution in children. Hematocrit, albumin, and TG levels are the key differences between these subtypes. TG level was higher in adult-type NASH, and albumin level and hematocrit were higher in pediatric-type NASH. What determines the pathological characteristics of the two NASH types should be investigated in a larger study.
 XML Download