

 PDF
PDF Citation
 Print
Print


INTRODUCTION
Spirometric reference values are key in interpreting the findings of pulmonary function tests, which provide essential information to evaluate respiratory diseases.12 The principal interest indices in spirometry are forced expiratory volume in one second (FEV1), forced vital capacity (FVC), and the FEV1/FVC ratio, in which values below normal are generally of concern. For the evaluation of airflow limitation, a fixed ratio of FEV1/FVC < 0.7 in a post-bronchodilator test remains standard according to the criteria of the Global Initiative for Chronic Obstructive Lung Disease (GOLD).3 However, it has been suggested that following the fixed ratio criterion may result in misjudging airflow limitations, more frequently in the elderly45 and less frequently in young adults.5 To mitigate such errors in diagnosis, the concept of the lower limits of normal (LLN) could be adopted which was formerly introduced in the American Thoracic Society (ATS) and the European Respiratory Society (ERS) articles.26
The LLN is defined as a value equal to the fifth percentile of a healthy population. If a variable follows a normal distribution, then the LLN is equivalent to subtracting 1.645 × the standard deviation (SD) from the mean. A variance is expressed as a standard error of the estimate (SEE) or residual standard deviation (RSD) in regressions, thus a normal 95% confidence interval from the 2.5 to 97.5 percentiles could be defined as the mean ± 2 × SEE. However, the FEV1/FVC ratio is not normally distributed, and the variance (SEE) for the ratio does not vary significantly by age or height. Consequently, calculating the LLN with SEE yields statistical flaws.7
To ensure validity, reference values for spirometry should be updated periodically in consideration of birth-cohort effects and the latest methodology.89 Recently, Stanojevic et al.1011 applied the lamda, mu, sigma (LMS) method to calculate more accurate reference ranges for spirometry. This new approach allowed the prediction of the values of spirometric indices accounting for transition into adulthood from childhood, and provided age-specific values for the LLN.11 In 2008, the Global Lung Function Initiative (GLI) was established in Berlin, sharing spirometric data from various centers and countries around the world. In 2010, the ERS set up the GLI as an ERS Task Force, which was subsequently endorsed by other international societies including the ATS and the Asian Pacific Society for Respirology (APSR). One of the main objectives of the GLI was to develop improved spirometric reference equations that are applicable globally with adjustment for the heterogeneity of between-subject variability according to age, sex, ethnic group, and lung function parameters.12 Spirometric data of the Korean population was also included in the study, but the data was not free from birth-cohort effects since it was collected between November 2001 and January 2002. Besides, Korea was grouped in the North East Asia dataset along with North China because of systematical discrepancies relative to other datasets including Hong Kong, Taiwan, Thailand, China, and the USA.12 It is recommended to adopt reference equations derived from data that most closely reflects the spirometric characteristics of a population, including ethnic, environmental, and socioeconomic properties.26 Because Korea differs from other East Asian countries in these traits, and because the data utilized in the study were not updated, reference values from the GLI in 201212 may not properly describe the spirometric characteristics of the Korean population.
The present study was conducted to update the Korean spirometric reference equations and their LLN using an improved statistical approach and to evaluate the reference values by comparing them with values of previously developed prediction equations for spirometry.
METHODS
Data sources and subjects
Raw data from the Korea National Health and Nutrition Examination Survey (KNHANES) IV (2007–2009) and V (2010–2012) were utilized to derive reference equations for spirometry. Conducted by the Korea Centers for Disease Control and Prevention (KCDC), the KNHANES is a national survey that examines the health and nutritional status of Koreans, including health risk factors and major diseases. The population reflected in the KNHANES comprises non-institutionalized citizens enrolled by a multi-stage cluster probability sampling method, securing homogenous and representative sampling.13 The KNHANES IV and V covered 31,705 (response rate: 74.5%) and 31,596 (response rate: 76.5%) people, respectively. Among all the subjects who participated in the health questionnaire and the physical examination survey, the number of adults aged 19 years and above was 38,005, and spirometric measurements were valid for 22,423 participants. The reference population was sampled using the following exclusion criteria: 1) smokers with a lifetime total smoking of 5 packs or more, 2) underlying respiratory diseases, 3) present respiratory symptoms including cough, sputum and dyspnea, 4) abnormal findings on chest radiography, 5) cardiovascular diseases other than hypertension, namely, stroke and ischemic heart diseases, 6) severe renal or liver dysfunction, and 7) any malignancy. In addition, outliers in which spirometric data yielded a z-score < 5.0 or > 5.0 were sought for exclusion (however, no outliers were found). Fig. 1 shows the flowchart for selecting the study population.
Measurements
Spirometry was performed using a dry rolling seal spirometer (Model 2130; Sensor Medics, Yorba Linda, CA, USA). Spirometric indices including FEV1, FVC, and FEV1/FVC were measured and evaluated in accordance with the ATS/ERS recommendations for standardized lung function and the criteria of acceptability and repeatability for spirometry.2 In the KNHANES IV, spirometry was performed for adults aged 19 years and over, while adults aged 40 years and over were measured in the KNHANES V.
Age, sex, and height data of all subjects were collected to develop models for outcome variables. Weight was not considered because regression effects make it inappropriate to predict pulmonary function using body mass within mammal species.14
Statistical analysis
The reference population was divided into two groups by sex. The mean, SD, and range of each variables including age, height, FEV1, FVC, and FEV1/FVC were calculated.
Separate reference equations for spirometry were derived for males and females using the LMS method. The LMS method was applied utilizing the generalized additive model of location, scale and shape (GAMLSS version 5.0-0) package in statistical software R (version 3.3.0 for Windows 64 bit; R Foundation, Vienna, Austria, http://www.r-project.org). The GAMLSS comprises semi-parametric regression type models, which are suitable for developing models of multiple explanatory variables including age and height.15
The LMS method allows for modeling of expected mean (mu [M]), coefficient of variation (sigma [S]), and skewness (lambda [L]). In addition, a continuous smooth fit over the entire age range is achievable by spline functions, which allow the dependent variable to vary smoothly (non-linearly) as a function of an explanatory variable. Using the Box-Cox-Cole-Green distribution described by Cole and Green,16 the best fit was estimated. To avoid over-fitting, the optimal degrees of freedom for the spline curve were attained by selecting the model with the smallest Schwarz's Bayesian Criterion. Thereby, the reference equations, which are a function of age and height, were derived as the following general form:
where M is the dependent variable (reference mean value), a, b, and c are coefficients, and M-spline is the age-specific contribution from the spline function. The LLN, equivalent to the fifth percentile, was calculated from L, M, and S as follows:
To compare the findings of the present study with other previous reference values, graphs showing changes in values of each spirometric index and their corresponding LLN values across age were illustrated under conditions of fixed subject height. Reference equations in the work of Eom and Kim17 derived using multiple linear regression analyses (2013MRA) and in the work of Quanjer et al.12 from ERS (2012GLI) were chosen as comparison topics.
RESULTS
Anthropometry and spirometry
Spirometric data were analyzed from 10,249 adults (8,776 females) over the age of 19 years. The mean, SD, and range of each variable are presented in Table 1. The demographic distributions are summarized in Supplementary Table 1.
Table 1
Anthropometric and spirometric characteristics of the reference population

Reference values
Equations for the mean, S, and L values of each spirometric index are presented in Table 2. Age-specific spline values are required for calculation of the mean (M-spline) and sigma (S-spline) for FEV1, FVC, and FEV1/FVC. The L-spline value was also required to determine the lambda for the FEV1/FVC ratio in females. Otherwise, the values for lambda remained fixed. The spline values obtained using penalized B-splines are presented in the Supplementary Materials (see Supplementary Tables 2, 3, 4). Likewise, the LLN for each of the spirometric indices can be calculated by substituting obtained values of M, S, and L on the equation:
Table 2
LMS equations for each of the spirometric indices for Korean adults

Age-specific spline values for males and females are indicated in the Supplementary Materials (see Supplementary Tables 2, 3, 4).
LMS = lambda, mu, sigma, FEV1 = forced expiratory volume in one second, FVC = forced vital capacity, M = mu as predicted value, S = sigma as coefficient of variation, L = lambda as index of skewness, H = standing height (cm), A = age (years), m-s = M-spline, s-s = S-spline, l-s = L-spline.
Comparisons between reference equations
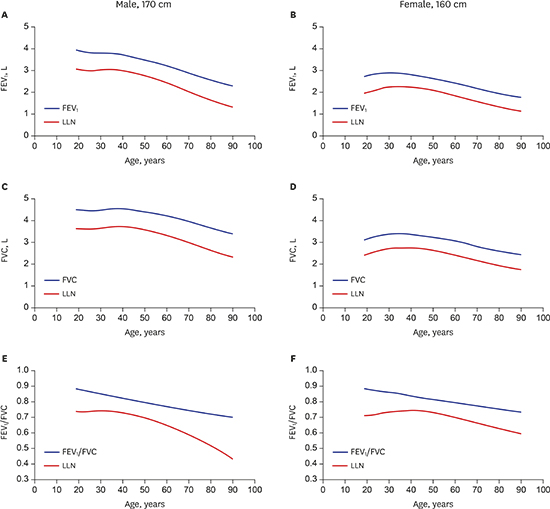
The new prediction equations and corresponding LLN values for spirometric indices were compared with previous references equations under conditions of fixed height (Figs. 2 and 3). In comparison with findings from the 2013MRA, the predicted values for FEV1 and FVC were smaller in young adults and larger in the elderly. Each of the LLN values for FEV1 and FVC demonstrated similar trends, except for FVC in males, which showed subequal values in young adults. The gap between predicted values for FEV1/FVC and their LLN values appeared wider in young adults and widened progressively with advancing age. For FEV1/FVC in males, the LLN showed a steep decrease in subjects older than age 60 in contradistinction to the LLN for FEV1/FVC in females.
Fig. 2
Comparison of reference values between 2017LMS and 2013MRA. (A) FEV1 in males. (B) FEV1 in females. (C) FVC in males. (D) FVC in females. (E) FEV1/FVC in males. (F) FEV1/FVC in females.
LLN = lower limits of normal, FEV1 = forced expiratory volume in one second, FVC = forced vital capacity, LMS = lambda, mu, sigma, 2017LMS = the reference values obtained in the present study, pred val = predicted value for each of the spirometric indices, 2013MRA = the reference values derived using multiple regression analysis by Eom and Kim.17
Fig. 3
Comparison of reference values between 2017LMS and 2012GLI. (A) FEV1 in males. (B) FEV1 in females. (C) FVC in males. (D) FVC in females. (E) FEV1/FVC in males. (F) FEV1/FVC in females.
LLN = lower limits of normal, FEV1 = forced expiratory volume in one second, FVC = forced vital capacity, LMS = lambda, mu, sigma, 2017LMS = the reference values obtained in the present study, pred val = predicted value for each of the spirometric indices, 2012GLI = the reference values from the Global Lung Function Initiative in 2012.
The disparity between the reference values for FEV1 and FVC in young adults was more apparent in comparison to these values in the 2012GLI. For elderly males, the gap between predicted values for FEV1/FVC and their LLN values appeared narrower in the 2012GLI, leading to a greater difference between the LLN of the present study and that of the 2012GLI.
DISCUSSION
Based on data from versions IV and V of the KNHANES, the present study derived new spirometric reference ranges using the novel LMS approach to properly capture the non-linear relationship of age and height with FEV1, FVC, and FEV1/FVC across subjects. Reference equations derived by the LMS method are expressed in the exponential form:
whereas conventional regression models take the form:
Conventional multiple regression analysis builds a model upon several assumptions where variance around the mean across subject height and age ranges is constant, and residuals are normally distributed. However, these assumptions are barely met for distributions of spirometric measures including FEV1 and FVC, and particularly for skewed FEV1/FVC distribution.18 Such statistical limitations of conventional multiple regression analysis are overcome using the LMS method.
In GAMLSS, a distribution-based approach to regression models, the exponential family distribution assumption for a variable of interest (Y) is replaced by a general distribution family, which allows modeling both skewness and kurtosis. The LMS method enables coping with non-normal distributions and facilitates the modeling of complex effects of age and height on the dependent variable using splines, which allow the dependent variable to vary non-linearly, (but smoothly) with age.
Another advantage of utilizing the LMS method is that LLN values are independently determined throughout the age-height spectrum, which is facilitated by the sigma and lambda terms.7 According to the analysis, the normal range of the FEV1/FVC ratio and its components is wider in younger ages and widens progressively in adults older than 40, demonstrating the inappropriateness of a fixed percent value for LLN.7 In contrast, the GOLD group3 favors a fixed ratio of FEV1/FVC below 0.70 in post-bronchodilator tests for evaluating airflow limitation. In terms of LLN values for FEV1/FVC in this study, males cross the cutoff value of 0.70 at about 50 years, while females cross the cutoff value at about 60 years. This finding is similar to findings in the 2013MRA. However, findings in the 2012GLI showed higher LLN for males, falling below the cutoff value of 0.70 at about 60 years. There seems to be ethnic diversity, taking into account findings in Caucasians in which LLN values were shown to cross the cutoff value at about 50 years of age.12 In contrast, a study from Japan reported greater LLN values in both males and females, crossing the cutoff value of 0.70 at about 60 years in males and 70 years in females.9 In the present study, the LLN of FEV1/FVC falls steeply in male subjects who are older than 60 years. Among the subjects included for analysis, the number of males aged 70 years and above was 152, while the number of females was 1,028 (see Supplementary Table 1 in the Supplementary Materials). Since LLN is independently determined throughout the age-height spectrum with the LMS method, the small number of older males may have led to lower LLN values. This finding needs to be clarified with a greater amount of Korean data in further research.
Small differences were found between the present study and the 2013MRA, particularly in young and old adults. Additional to the KNHANES V, the present study utilized the KNHANES IV to gather spirometric data about adults younger than 40 years of age, because spirometric data were restricted to adults between 40 and 79 years of age in the KNHANES V. By merging data from the KNHANES IV and V, a greater number of older subjects were included in this study than in the 2013MRA. The larger number of subjects herein better captured the decline in lung function with advancing age. However, a relatively small number of younger subjects were included for analysis, resulting in less power to claim representativeness. Additionally, different methods between studies may have also contributed to the incongruity between the current analysis and the 2013MRA.
In comparing the findings of this study with the 2012GLI, partial discrepancies are shown to be more notable in young adults. Eom and Kim17 reported lower predicted values of spirometric indices derived from the KNHANES IV data in comparison to previous reference equations derived from the KNHANES II.19 Results from Eom and Kim17 also showed lower predicted values of FEV1 and FVC in comparison to these values in the US NHANES III20 and in Morris et al.,21 particularly in young adults. One possible explanation for the differing results refers to the different exclusion criteria between studies. In analysis of the KNHANES II,19 stricter exclusion criteria concerning medical conditions were applied, while individuals with abnormal chest radiography findings were not considered in the analysis of the KNHANES IV.17 To overcome potential bias, individuals with underlying respiratory diseases or symptoms, as well as with positive findings on chest radiography were excluded in the present study. However, the result of seeing lower predicted values for FEV1 and FVC in young adults was repeated. This may be due to small number of younger subjects, as indicated above.
A more likely explanation is attributable to properties of the 2012GLI reference values regarding North East Asians. Quanjer et al.12 reported significant differences for spirometric data between centers in East Asia. In the 2012GLI, predicted values for FEV1 and FVC derived from two datasets collected in North China22 and Korea19 were significantly higher than predicted values derived from other datasets collected in Hong Kong,2324 Taiwan,25 Thailand,26 the USA (according to the Multi-Ethnic Study of Atherosclerosis [MESA] investigators R.G. Barr, P.L. Enright, and J.L. Hankinson wherein the data was personally communicated by Quanjer et al.12) and China.27 The differences between datasets led to the development of separate reference equations for East Asians from the North and the South. The dataset collected in Korea was based on the KNHANES II survey, which was conducted from November 2001 to January 2002. Eom and Kim17 indicated that predicted values derived from the KNHANES II19 were noticeably higher than values derived from the KNHANES IV17 and from the US NHANES III.20 In comparison to another spirometric dataset collected from a region within the Chungbuk province in Korea, the US NHANES III model showed a better fit than the KNHANES II model.28 Based on these findings, Eom et al.1728 asserted that the KNHANES II equations overestimated the predicted values for FEV1 and FVC. Since 2012GLI data is partially comprised of KNHANES II data, predicted values from the 2012GLI were expected to be greater than the values of the present study. Nevertheless, the predicted values for FVC in the 2012GLI show a smaller decline than the values of the present study for male subjects between 40 and 50 years of age. This might be due to the mixed effects of including North Chinese along with Korean populations in the 2012GLI dataset for North East Asians. Among several possible explanations, disagreement in measured values between datasets is the most likely reason for the inconsistent findings, but there is no clear proof for such discrepancies in measure values between the data. Quanjer et al.12 reported that no evidence of unrepresentativeness arising from a small sample size was found in the KNHANES II data19 or in the data from North China.22 These ambiguous findings need to be investigated in further research.
According to Quanjer et al.,12 the GLI has produced spirometric reference values that are more generalizable across populations by utilizing many data from various sources. However, more generalizable reference values may not necessarily mean that the values are optimal to describe the spirometric characteristics of an ethnic group. In East Asia alone, there are many subgroups and ethnic minorities differ from each other in physical, social and ecological traits. In addition to age and height, these traits may have correlations with pulmonary function. In Japan, a study reports a sample with greater height driven by increased leg length due to post-war improvements in socioeconomic conditions.29 In sample populations in China, there are considerable differences in socioeconomic conditions between urban and rural areas3031 and ethnic differences in body builds.3233 Since certain traits are not shared across ethnic groups and regions, the development of separate spirometric equations for each ethnicity and country is needed. Nevertheless, the work from the GLI has advantages in certain situations. The GLI findings could be adopted to evaluate respiratory diseases in foreigners or adolescents, where representative reference values are absent.
The major weakness of the analysis in this study arise from the properties of the KNHANES data. Because the reference values are calculated independently throughout the age-height spectrum, the findings might be less reliable in ages for which the number of subjects is relatively small. In this study, the number of young subjects was small, and caution is required when interpreting the predicted values for subjects younger than 30 years of age. However, it is clear that the new reference values derived by the LMS method better reflect transitions in pulmonary function in young adults relative to previous reference equations derived by conventional regression analysis.11 Another limitation is that the KNHANES IV data utilized in this study is not absolutely free from birth-cohort effects, since the data collection began in July 2007 and ended in December 2009. Korea is one of the fastest growing countries in terms of the standing height of its population (see Fig. E7 in the online supplementary material of the article by Quanjer et al.12). For example, the average height in subjects aged 40 years in 2008 may differ from the average height in subjects aged 40 years in 2017. In order to develop valid and reliable prediction equations for spirometry, data needs to be periodically updated and collected from a sufficient number of subjects with acceptable representativeness. Furthermore, representative data for Korean adolescents should be collected along with adults to derive continuous reference values for spirometry with transition into adulthood from childhood.
In conclusion, the present study provides new reference values for spirometry and corresponding LLN values using the LMS method, better capturing the transition of pulmonary function in young adults. The results should be interpreted with caution for young adults as well as for the LLN of FEV1/FVC in elderly males in particular. Considering that clinical evaluation is an art, following spirometry assessment over time and correlating the findings with other exams is important. Finally, future studies should be conducted to improve the accuracy of reference data and to develop continuous reference values for spirometry across all ages.
 XML Download