

 PDF
PDF ePub
ePub Citation
 Print
Print


INTRODUCTION
Cerebral palsy (CP) — a disease characterized by motor impairment — is multifactorial and the exact causes are unknown, though it generally refers to a disability caused by an injury to an immature brain [12]. Patients with CP have difficulty with body movement, muscle control and coordination, muscle reflex, and postural and balance maintenance. CP may also affect oral motor functions [3].
Feeding ability is developed along with the development of basic sensory and motor functions of the oral organs in early childhood and late childhood, and is more refined and sophisticated in adulthood [45]. Food intake in early childhood and late childhood is critical because it has a serious impact on the growth and development of the body and brain [67]. Therefore, children who are incapable of self-feeding or those with feeding disorders have an inadequate nutrient intake, which undermines their physical fitness, activity, concentration, and motivation for learning [5].
Dietary habits refer to one's food-related habits, such as food preference and eating regularity that are acquired through various environmental, cultural, and social factors. They determine an individual's nutritional status and affect their health [4]. Healthy dietary habits facilitate growth and may lower numerous immediate and long-term health risks [8]. Thus, inappropriate dietary habits may not only hinder normal growth and development in children due to nutritional deficiency but may also affect their intellectual, social, and emotional competence, stressing the importance of a balanced nutritional intake and good dietary habits [5]. Feeding in childhood affects multiple areas, including growth and development, concentration, and behavioral problems [9]. CP is one of the classic disorders that may affect feeding in childhood [6].
Hwang and Kim [10] reported that nutritional and health disorders caused by poor dietary habits are serious problems in children. Particularly, such growth and nutritional disorders are common secondary disabilities that affect children with CP [11]. Lopes et al. [12] reported that 25% of 100 children with disabilities were underweight, and 11% and 9% of underweight children were mildly and severely underweight, respectively, suggesting that a vast majority of children with disabilities, especially children with CP, have severe nutritional problems. Kim [1] suggested that because children with CP are only able to eat with their parents' assistance, the amount and types of food intake are determined by someone else, which places them in an environment more vulnerable to nutritional or health impairment. Children with disabilities exhibit more desirable dietary habits, such as having regular meals and not skipping breakfast, compared to children with no disabilities because their parents determine their method of eating [10].
Two factors may play a role: inadequate food intake hinders adequate intake of nutrients or food intake is far short of the required energy as a result of a rise in nutritional demand by the increasing metabolism of the body [11]. Park et al. [5] reported that the reduced appetite and low food intake are the most serious problems in children with disabilities. Furthermore, Reilly and Skuse [13] reported that the amount of food provided as well as the amount of food eaten are lower for children with CP compared to children with no disabilities, suggesting that providing highly nutritious meals is essential to improve health and nutritional disorders in children with CP. The type of CP was classified with the use of topographic distribution and the extent of impairment. The type, severity of neurological impairment, and ambulatory status could affect nutritional status [12].
Ahn [14] and Lee [15] suggested that compared to the volume of studies investigating the dietary habits and food intake in children with all types of disabilities, there is a lack of studies investigating this issue specifically in children with CP. Further, most studies related to feeding in CP simply shed light on the association between secondary disabilities and feeding problems, as suggested by Matsuo and Palmer [16] and Andrew and Sullivan [17]. Anthropometric studies analyzing height, body weight, and body fat as well as investigations on the dietary habits and feeding statuses are also lacking, showing the thin volume of data pertaining to physical development regarding the feeding status of children with CP.
Children with CP suffer from emotional and physical problems such as intellectual disability, epilepsy, feeding difficulties, ophthalmologic impairment, and hearing impairments [17]. Growth retardation can result from an inadequate nutrition. Therefore, it is important to improve poor nutrition caused by feeding difficulties in children with CP. However, there were no studies of diet-related factors including nutrition status have been conducted in children with CP in Korea.
Thus, this study aimed to understand diet-related factors, such as food preferences and eating habits, affecting nutritional status, dietary intake, and body composition of children with cerebral palsy compared to healthy children.
MATERIALS AND METHODS
Study participants
Sixteen children with CP (13 boys, 3 girls) aged 4–12 years attending one of four rehabilitation centers for the disabled and one daycare center in Changwon and 16 healthy children (12 boys, 4 girls) in Changwon with similar family and local environments as the children with CP were enrolled. Children with CP using tube feeding were excluded. The children were classified into hemiplegia, paraplegia, and quadriplegia based on the location of paralysis. The study was approved by the Institutional Review Board (IRB) of Changwon National University (IRB No.1040271-201411-HR-016).
Study method and period
Questionnaire surveys were used for this study. The investigator conducted a 1:1 interview with the parents of the children to explain the precautions and meal-related issues and asked the parents to complete the self-reported questionnaire. The study period was from January 5 to June 30, 2015.
General characteristics
With regard to demographic characteristics, the participants' age, sex, and CP were investigated. For all the subjects, height, weight, body mass index (BMI), and body composition were measured by using the Inbody S10 (Inbody Co. Ltd., Seoul, Korea). Regarding physical characteristics, height-for-age percentile, weight-for-age percentile, and BMI-for-age percentile were obtained with reference to the 2017 Standard Growth Chart for Korean Children and Adolescents published by the Korea Centers for Disease Prevention and Control at the Ministry of Health and Welfare and Standard Body Growth Investigation Committee at the Korea Pediatric Society.
Dietary habits
A dietary habit questionnaire was developed based on the study by Kim et al. [19]. The questionnaire comprised 7 items, with three items including eating priority, preferred taste, and unbalanced diet habit for food preference, two items (problems of diet and reason for irregular meals) for problems during meals, and 2 items concerning snack times and why eat a snack for snack intake.
Nutrient intake
The 24-hour recall technique was used to investigate participants' general dietary intake. For an accurate investigation, we presented the “Two-dimensional model of foods and their containers” published in the Korean National Health and Nutrition Examination Survey (KNHANES) by the Korea Health Industry Development Institute, Ministry of Health and Welfare. The participants were instructed to record the name of the food eaten, names of ingredients contained in the food, and amount of food intake.
The participants' daily nutrient intake was analyzed using the Computer Aided Nutritional Analysis for Professionals, version 5.0 (The Korean Nutrition Society, Seoul, Korea), and nutrient-specific demands and percentage of nutrient intake were assessed based on the Dietary Reference Intakes for Koreans (KDRIs) [18].
Statistical analysis
The collected data were statistically analyzed using SPSS Statistics version 24.0 (IBM Corporation, New York, NY, USA). General characteristics, dietary habits, and intake pattern by food group were presented as frequencies and percentages. The Mann-Whitney U test was used to compare body composition and nutritional intakes of the CP and healthy children group. The χ2 test was used to examine the differences in general characteristics, food preference, and problems with eating and snack intake. Kruskal-Wallis test was performed to examine whether the parameters differed in relation to the types of CP. Statistical significance was set at p < 0.05.
RESULTS
Demographic characteristics
The proportion of boys was 81.3% in the CP group and 75.0% (n = 12) in the healthy children group, showing a higher proportion of boys than girls in each group, with no significant differences across the groups (Table 1). There was also no significant difference in age, with a mean age of 8.00 ± 1.97 years in CP group and 8.56 ± 2.53 years in the healthy children group.
Table 1
General characteristics of the children with CP and healthy children

Physical characteristics
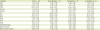
The height percentile was significantly different 20.25 ± 30.25th% in the CP group and 64.06 ± 28.18th% in the healthy children (p < 0.001, Table 2). The height percentile of paraplegic group was lower than hemiplegic and quadriplegic group (p < 0.05). The weight percentile was also in the healthy range (5th–85th percentile) for CP and healthy children with significant differences among the groups (p < 0.05), with 52.20 ± 42.94th% in the quadriplegic group, 9.43 ± 11.10th% in the paraplegic group, and 26.75 ± 29.80th% in the hemiplegic group. The BMI percentile was also in the healthy range for CP and healthy children with no significant differences.
Table 2
Body composition of the children with CP and healthy children

Values are presented as mean ± standard deviation.
CP, cerebral palsy; BMI, body mass index
Significantly different between CP and healthy children at *p < 0.05, †p < 0.01, and ‡p < 0.001. §,∥Values with different superscript mark were significantly different in quadriplegia, paraplegia, and hemiplegia at p < 0.05.
Body composition
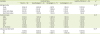
Intracellular water (ICW) differed significantly across the paralysis groups (p < 0.05), with 9.04 ± 1.98 L for the quadriplegic group, 6.40 ± 1.85 L for the paraplegic group, and 7.20 ± 1.65 L for the hemiplegic group (Table 3). Protein also differed significantly across the paralysis groups (p < 0.05), with 3.90 ± 0.84 kg for the quadriplegic group, 2.73 ± 0.80 kg for the paraplegic group, and 3.10 ± 0.75 kg for the hemiplegic group. Skeletal muscle mass also differed significantly across the paralysis groups (p < 0.05), with 9.78 ± 2.57 kg for the quadriplegic group, 6.36 ± 2.40 kg for the paraplegic group, and 7.38 ± 2.10 kg for the hemiplegic group.
Table 3
Body composition analysis of the children with CP according to plegia
Values are presented as mean ± standard deviation.
CP, cerebral palsy; ICW, intracellular water; ECW, extracellular water; TBW, total body water; SLM, soft lean mass; FFM, fat free mass; SMM, skeletal muscle mass; PMF, percent body fat; WHR, waist-to-hip ratio.
*,†Values with different superscript mark were significantly different in quadriplegia, paraplegia, and hemiplegia at p < 0.05.
Food preference
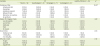
Eating priority of food preference was significantly different in CP group and healthy children group (p < 0.05, Table 4). With the exception of the hemiplegic group, all children considered “taste” as the most important factor in eating food. The hemiplegic group considered “nutrition” as the most important (n = 3, 75.0%), showing a significant difference from the other groups (p < 0.05). The most preferred taste was “greasy” (n = 2, 40.0%) in the quadriplegic group, “sweet” (n = 5, 71.4%) in the paraplegic group, “most tastes” (n = 2, 50.5%) in the hemiplegic group, and “salty” (n = 5, 31.3%). The proportion of children who had a balanced diet was greater than that of children who had an unbalanced diet in children with CP though not in healthy children, showing a significant difference (p < 0.01).
Table 4
Food preferences of the children with CP and healthy children
Problems with eating and snack intake
The problem of diet was significantly different in CP group and healthy children group (p < 0.05, Table 5). The greatest problem with diet was “unbalanced diet” in healthy children and “assistance required” in children with CP. The problem with eating was “overeating” (n = 2, 40.0% each) in the quadriplegic group and “cannot eat on one's own” (n = 5, 71.4%) in the paraplegic group among the CP group. With respect to the frequency of eating snacks, “1–2 times/day” was the most common in all groups, with no significant differences among the groups.
Table 5
Problems detected during meals and general snacking habits of the children with cerebral and healthy children
Nutrient intake
Percentage of nutrient intake were assessed based on the KDRIs. There was no difference in percentage of nutrient intake of children with CP and healthy children (Table 6). With regard to average energy consumption, the estimated energy requirements (EER)% for the quadriplegic and paraplegic groups were lower (82.84% ± 15.82% and 89.50% ± 24.39%, respectively) than that for the hemiplegic group (111.63% ± 29.03%). All groups consumed more than two-fold of the body's demand for protein. The children with CP and healthy children consumed less than the adequate amount of vitamin D, with average intake of 76.44% ± 28.52% and 83.59% ± 30.26%, respectively. With regard to average calcium intake, the CP and healthy children groups took less than the adequate intake, at 93.44% ± 36.77% and 87.78% ± 17.42%, respectively.
Table 6
Nutritional intakes of the children with CP and healthy children
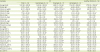
Values are presented as mean ± standard deviation.
CP, cerebral palsy; EER, estimated energy requirements; EAR, estimated average requirements; AI, adequate intake.
*Significantly different between cerebral palsy and healthy children at p < 0.05. †,‡Values with different superscript mark were significantly different in quadriplegia, paraplegia, and hemiplegia at p < 0.05.
DISCUSSION
We had investigated to understand between inadequate nutritional supply and children with CP. In our study, the proportion of boys was greater than that of girls. Multiple studies that investigated children with CP also found a higher percentage of boys than girls [1014], presumably due to the fact that male fetuses and neonates are more vulnerable to trauma during the process of brain development. When compared to the standard growth measurements of Korean children and adolescents in the same age group (Korea Centers for Disease Prevention and Control, 2007), children with CP seem to have hindered height growth compared to healthy children, and even among children with CP, growth delay is more evident in those with severe brain injury and paraplegia. In a study assessing growth and development of disabled children, Kim [19] reported that children with CP were shorter and lighter than children with other disabilities or non-disabled children, which are similar to our findings. There were smaller differences in terms of BMI percentiles between children with CP and healthy children, which may be attributable to the fact that children with CP show a more marked hindrance of height growth than weight growth, resulting in a higher BMI percentage. According to Lee's study [15], disabled children exhibit hindered height growth but higher weight growth.
With regard to dietary habits, most children considered “taste” to be the most important in meals, although the hemiplegic group considered “nutrition” (75.0%) to be the most important. The quadriplegic and paraplegic groups could intake foods by oneself, but hemiplegic group should be assisted by parents or caregivers. The emphasis on nutrition in children with CP seems to be inaccurate due to the fact that parents, as opposed to children themselves, filled out the survey; hence, the response seems to reflect more of the parents' decisions and not the children's [15]. Children with severe brain injury and children with paraplegia preferred a sweet taste, while children with quadriplegia preferred a greasy taste. Further, healthy children preferred a spicy and greasy taste. Ahn [14] reported that children with disabilities preferred a light and clean taste the most, followed by greasy and sweet tastes. The percentage of children with CP who only ate foods they liked was high in our study, which was in contrast with previous findings that a higher percentage of disabled children tend to have an unbalanced diet compared to healthy children [1115]. Further, our findings were also in contrast with Kim et al.'s [4] study, where 62.6% of children with CP had an unbalanced diet, and with Park et al.'s [5] study, where 34% of children with disabilities had a “serious issue with an unbalanced diet.” The lower rate of unbalanced diet in our study may be attributable to the fact that a high percentage of parents and teachers intervened in the diet of children with CP. Furthermore, food is often diced for children with CP due to their chewing difficulty, thus it may seem like these children do not have an unbalanced diet. The greatest issue with dietary habit was the inability to eat on one's own among children with severe brain injury while the greatest problem was “overeating” and “unbalanced meal” among children with moderate brain injury and healthy children, respectively. In quadriplegia children, overeating was shown as a food-related problem, but the energy intake did not reach the EER% and was significantly lower than the other groups. We could explain that quadriplegic group was restricted food intakes by caregiver.
With regard to nutrient intake, children with severe brain injury, children with quadriplegia, and those with paraplegia tended to have a lower energy intake. In a study on children with CP, children with other physical disabilities, and non-disabled children, Kim [19] reported that children with CP have lower energy intake (69.1% ± 15.4%) than that of non-disabled children though similar to that of children with other physical disabilities. Park et al. [5] reported that energy intake in children with spastic CP falls short of the recommended intake, which is similar to our findings. Vitamin D intake was below the adequate amount in both children with CP and healthy children, which was similar in other study [5]. Moreover, calcium intake was also low among children with moderate brain injury and children with quadriplegia as well as in healthy children. Unlike healthy children, children with CP engage in little outdoor activities and consequently have fewer opportunities to synthesize vitamin D [20], therefore vitamin D and calcium intake through food is important. In children with quadriplegia, the intake of energy, protein, vitamin A, niacin, vitamin B6, folate, and zinc was significantly lower than healthy children. It might be considered that problem of chewing and swallowing comes out best in quadriplegia. One limitation of this study is that it investigated only a small sample of children in one rehabilitation center in Changwon, which makes it difficult to present normal values. Future studies should additionally perform in-depth interviews and physical activity and biochemical investigations on children with CP so as to present implications for improving their quality of life.
CONCLUSION
Based on a nutritional assessment of children with CP and healthy children, this study found that children with CP have hindered growth — particularly height — compared to healthy children. Growth and developmental delay was particularly more evident among children with severe brain injury and those with paraplegia. In addition, children with CP showed low energy intake overall as well as low vitamin D and calcium intake, which are important for height growth, calling for nutrient education that stresses the importance of vitamin D and calcium intake for children with CP. Furthermore, our findings showing that children with CP considered nutrition to be important and have a balanced diet and the fact that children with CP cannot eat on their own suggests that there is much external involvement with their diets. Therefore, education to foster appropriate dietary habits and attitudes should also be provided for parents and teachers who are directly involved with meals.
 XML Download