

 PDF
PDF ePub
ePub Citation
 Print
Print


INTRODUCTION
Early neurological deterioration (END) is generally defined as neurological worsening within 72 hours after an acute ischemic stroke.1 The main causes of END in acute ischemic stroke are symptomatic hemorrhage, hemorrhagic transformation, stroke recurrence, seizure, metabolic encephalopathy, pneumonia, and cardiac arrest.2 The incidence of END in acute ischemic stroke reportedly varies from 16% to 38% depending on the stroke severity scale and time frame used.34 However, regardless of the definition, END is associated with a poor prognosis for ischemic stroke patients,5 and so identifying factors associated with END is important for improving the prognosis of acute stroke.
Blood pressure parameters are common risk factors for vascular disease, including stroke. Current hypertension guidelines advocate checking the blood pressure in both arms,6 due to the possibility of differences in the measured blood pressures. Such interarm blood pressure differences (IABDs) have been found in several studies. In general, IABD ≥10 mm Hg has been found in about 4% of patients without any vascular disease, 13% of patients with hypertension, 7% of patients with diabetes mellitus, and 9–10% of patients with stroke; however, the methods used to measure IABD have differed between these studies.789
IABD is a clinically important indicator that is easy to measure in the clinic. IABD is associated with significant atherosclerosis and other types of stenosis in the large arteries, including the aorta and its major branches.10 Because progressed atherosclerosis is related to poor prognosis in stroke patients,11 IABD could be associated with poor clinical outcomes after acute ischemic stroke, particularly END. However, there are few reports on the association between IABD and END. Moreover, the clinical significance of IABD for stroke outcomes has also rarely been reported. In this study we hypothesized that increased interarm differences in the systolic and diastolic blood pressures (IASBD and IADBD, respectively) are related to END, poor functional outcome, and mortality.
METHODS
Study population
Between January 2011 and August 2016, 1,425 consecutive patients with a first-ever transient ischemic attack or acute cerebral infarction were admitted to our stroke center within 24 hours after symptom onset or the last normal time.12 The medical history, demographic characteristics, vascular risk factors, neurological manifestations, and neuroimaging data were collected in our registry during their admission. Chest X-rays, laboratory blood tests, and 12-lead electrocardiography were routinely performed in all of the admitted stroke patients. Brain CT and/or MRI and vascular imaging [magnetic resonance angiography (MRA), CT angiography (CTA), or digital subtraction angiography (DSA)] were also performed. The ankle-brachial index (ABI) was also routinely measured with an automated device between 3 and 7 days after admission to investigate underlying peripheral arterial occlusive diseases.8
Among the 1,425 initially included patients, patients with transient ischemic attack (n=102), potential cardiac source of embolism (PCSE) [n=182; sick sinus syndrome (n=5), paroxysmal atrial fibrillation (n=40), or persistent atrial flutter/ fibrillation (n=121), or other PCSE (n=16)], stroke due to other determined causes (rare causes, n=21), or incomplete stroke evaluation (n=10) were excluded. Patients with PCSE were excluded because arrhythmias—which are the main component of PCSE (predominantly atrial fibrillation)—are a frequent cause of the failure to accurately or consistently measure blood pressure and the brachial-ankle pulse wave velocity (baPWV).813 Patients who did not receive brain MRI (n=19) or for whom the quality of MRI images was poor (n=4) were excluded. In addition, patients missing ABI data (n=38) or with an abnormal ABI result (ABI <0.9, n=41) were also excluded due to the possibility of inaccurate blood pressure and baPWV measurements.14 This study finally included 1,008 patients (Supplementary Fig. 1 in the online-only Data Supplement) with no history of coarctation of the aorta or cardiac valvular disease pathologies.
The Supplementary Material (in the online-only Data Supplement) and a previous study815 provide detailed definitions of vascular risk factors, including the body mass index (BMI), hypertension, diabetes mellitus, hyperlipidemia, smoking, alcohol intake, history of coronary artery disease, metabolic syndrome, and left ventricular hypertrophy. Stroke was classified according to the Trial of Org 10,172 in Acute Stroke Treatment classification system.16 The degree of intracranial cerebral atherosclerosis (ICAS) stenosis was measured as described previously,1718 and the presence of ICAS was defined as a ≥50% decrease in the luminal diameter.1718 Extracranial cerebral atherosclerosis (ECAS) was investigated in the common carotid arteries, subclavian arteries, and proximal internal carotid arteries up to the bifurcation level,19 with its presence defined by a ≥50% decrease in the luminal diameter.19 Extracranial vertebral arteries with suspecting hypoplasia were not considered as ECAS because MRA and CTA cannot clearly differentiate a normal variant of vertebral artery hypoplasia from acquired stenosis.17 If one artery had multiple stenotic lesions, the most-severe lesion was selected. The presence of ICAS and ECAS was independently investigated by two neurologists (T.J.S. and Y.C.) who were blinded to clinical information. The kappa value for the interobserver agreement regarding the presence of ICAS was 0.936. Consensus was reached in cases of discrepancy when detecting ICAS and ECAS. High-grade white-matter hyperintensities (HGWMHs) were defined as a Fazekas score of 3 in the periventricular white matter or ≥2 in the deep white matter in FLAIR or T2-weighted brain MRI images.20 Blood laboratory findings at admission (white blood cell count, hemoglobin, and platelet count) and after an 8-hour fast (glucose and lipid profile) were used. The Institutional Review Board approved our study (IRB No. 2017-04-017-001) without the need to obtain informed consent because of its retrospective and observational design.
Definition of END
The presence and type of END were prospectively confirmed by the agreement of more than three stroke neurologists at a weekly stroke conference. END was defined as at least one of the following three criteria being met within 72 hours after admission: 1) increase in the total National Institutes of Health Stroke Scale (NIHSS) score since admission of at least 2 points, 2) subscore for the level of consciousness on the NIHSS of 1 or more, or 3) any other new neurological deficit.21 The causes of END were symptomatic hemorrhagic transformation, stroke progression, stroke recurrence, and other medical complications (e.g., acute myocardial infarction).22
Outcome measures
The score on the modified Rankin Scale (mRS) was checked at 3 months after the index stroke by a stroke specialist and/or well-trained stroke nurse. The functional outcome at 3 months after the index stroke was dichotomized into a good outcome (mRS score <3) or a poor outcome (mRS score ≥3). We also recorded the date of all-cause mortality for all of our patients using data from mRS during follow up and the Korean National Statistical Office, which are based on death certificates and are known to be reliable.23 The censoring date was set as December 31, 2016.
Measuring blood pressure in both arms and IABDs
The systolic and diastolic blood pressures are measured in the supine position with a device designed to automatically and simultaneously assess the ABI (VP-1000, Colin, Komaki, Japan). Pressure cuffs were wrapped on both the brachial and posterior tibial arteries to measure the arterial blood pressure using the oscillometric method.24 Large IASBD and IADBD values were defined as absolute differences ≥10 mm Hg, which is a frequently used cutoff.825
Statistical analysis
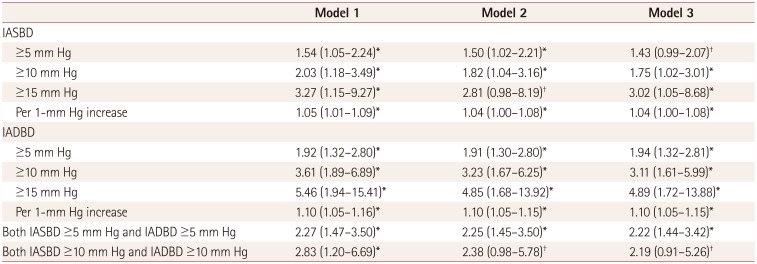
Statistical analyses were performed with the Windows SPSS software package (version 21.0, IBM Corp., Armonk NY, USA) and the R package for Windows (version 3.0.2, R Foundation for Statistical Computing, Vienna, Austria). Continuous variables are expressed as mean±SD values, categorical variables as frequency (percentage) values, and ordinal variables as median [interquartile range] values. The demographic characteristics and clinical variables were compared according to the presence of END using the independent t-test, Mann-Whitney U test, chi-square test, and Fisher's exact test. The relationships of IASBD and IADBD with END were investigated using multivariate binary logistic regression with END as the dependent variable. The association of IABD with END was tested with clinical models (models 1 and 2) and a general statistical method (model 3). Model 1 was adjusted for traditional cardiovascular risk factors (sex, age, BMI, hypertension, diabetes mellitus, hypercholesterolemia, smoking, alcohol intake, coronary artery disease, metabolic syndrome, left ventricular hypertrophy, and brachial-ankle pulse wave velocity) and NIHSS score. In model 2, the odds ratios (ORs) of IABD were adjusted for model 1 plus significant laboratory and imaging factors (white blood cell count, total cholesterol, low-density lipoprotein, thrombolysis, cerebral atherosclerosis, and HGWMHs). Model 3 included covariates that were associated with END in the univariate logistic regression (p<0.1). The association between IABD and END was further investigated by analyzing a smoothed spline plot produced using a generalized additive regression model.
Uni- and multivariate logistic regression analyses were performed to investigate factors associated with a poor functional outcome. The association between the IABD score and mortality was analyzed using the Kaplan-Meier product-limit method with a log-rank test and multivariate Cox proportional- hazards regression. In addition to age and sex, variables with p<0.1 in the univariate analysis were entered in the multivariate analyses. There was no statistical interaction for a poor functional outcome or mortality between IABD (IASBD and IADBD) and END. To investigate the improvement in the prediction performance obtained by adding IABD for END, functional outcome, and mortality, continuous net reclassification improvement and integrated discrimination improvement between the multivariate models with and without IABD were computed. For sensitivity analyses, we performed further multivariate analyses for IASBD ≥5 mm Hg, IASBD ≥15 mm Hg, IADBD ≥5 mm Hg, IADBD ≥15 mm Hg, and increased IASBD or IADBD.8 Subgroup analyses were performed to investigate whether the relationship between IABD and END differed according to sex, age, BMI, hypertension, diabetes mellitus, hypercholesterolemia, smoking, alcohol intake, coronary artery disease, metabolic syndrome, left ventricular hypertrophy, prior statin use, antihypertensive treatment before the ABI examination, NIHSS score, cerebral atherosclerosis, HGWMHs, thrombolytic therapy, or stroke subtype (lacune or nonlacune). A two-tailed p value of <0.05 was defined as statistically significant.
RESULTS
Demographic characteristics and comparisons of patients with and without END
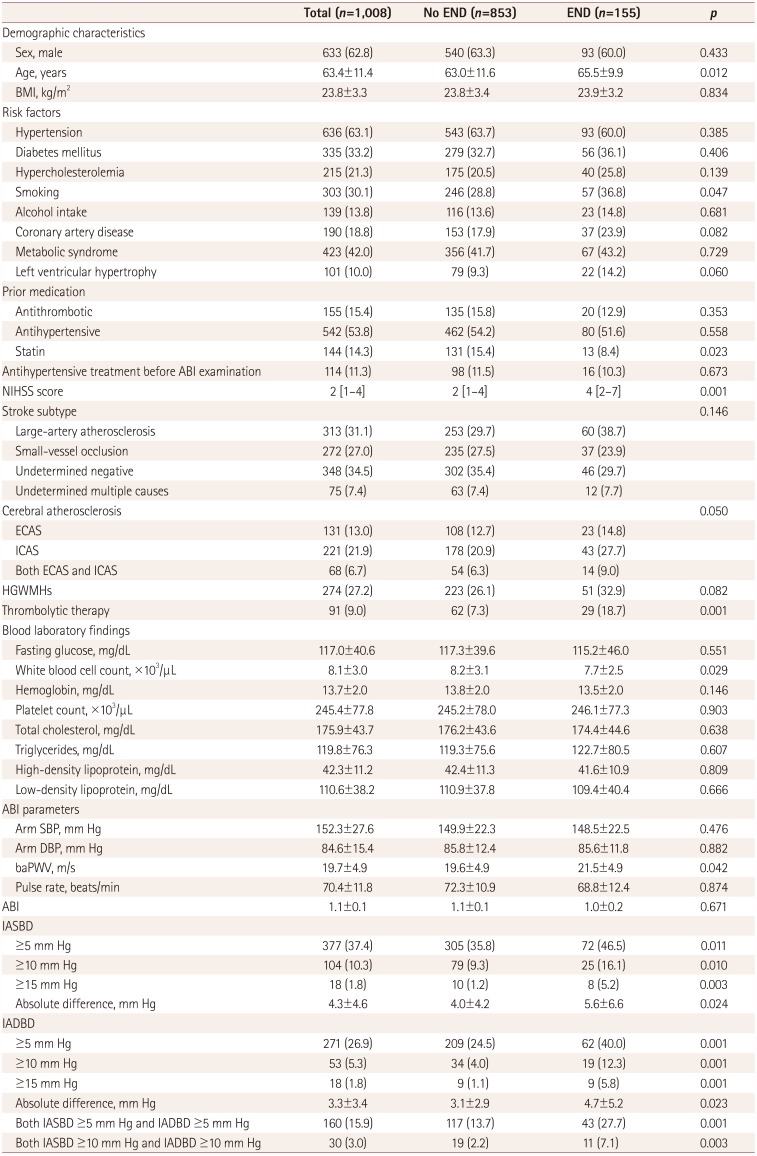
The demographic characteristics and risk factors other than age did not differ significantly between the 1,008 patients who were final included in this study and the 417 patients who were excluded (Supplementary Table 1 in the online-only Data Supplement). The included patients were aged 63.4±11.4 years, and 62.8% (633/1,008) of them were male. END occurred in 15.3% (155/1,008) of the patients. The causes of END were symptomatic hemorrhage/hemorrhagic transformation (8.3%, 13/155), stroke progression (72.2%, 112/155), stroke recurrence (9.6%, 15/155), other known causes [8.4%, 13/155; gastrointestinal bleeding (n=4), drug side effects (n=3), pneumonia (n=3), cardiac arrest or myocardial infarction (n=2), and sepsis (n=1)], and unknown causes (1.3%, 2/155). Compared to those without END, patients with END were older (65.5±9.9 vs. 63.0±11.6 years) and more often had a history of smoking (36.8% vs. 28.8%), coronary artery disease (23.9% vs. 17.9%), left ventricular hypertrophy (14.2% vs. 9.3%), higher NIHSS score [4 (2–7) vs. 2 (1–4)], cerebral atherosclerosis (51.6% vs. 39.9%), HGWMHs (32.9% vs. 26.1%), and receiving thrombolytic therapy (18.7% vs. 7.3%). The white blood cell counts and brachial-ankle pulse wave velocities were also higher in patients with END than in those without END. The prevalence of END was lower in patients with prior statin use (Table 1). In total, 144 (11.3%) patients received antihypertensive treatment before the ABI examination, with 95 patients (65.9%) taking only intravenous labetalol, 23 patients (15.9%) taking intravenous perdipine and labetalol, 11 patients (7.6%) taking both oral antihypertensive agents and intravenous antihypertensive agents, and 15 patients (10.4%) taking only oral antihypertensive agents. After excluding 35 patients in whom subclavian artery stenosis could not be evaluated accurately (mainly due to artifacts), contrast-enhanced MRA, CTA, or DSA identified subclavian artery stenosis in 41patients (4.2%) of the remaining 973 patients. All patients with subclavian artery stenosis had IASBD ≥10 mm Hg and/or IADBD ≥10 mm Hg.
Association between IABD and END
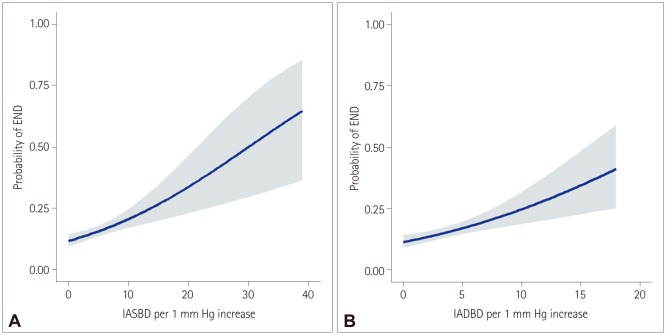
IASBD ≥10 mm Hg and IADBD ≥10 mm Hg were found in 104 (10.3%) and 53 (5.3%) patients, respectively. Among the 25 patients with IASBD ≥10 mm Hg and END, 22 patients (88.0%) had stroke progression and 3 patients (12.0%) had stroke recurrence. Moreover, among the 19 patients with IADBD ≥10 mm Hg and END, 15 patients (78.9%) had stroke progression and 4 patients (21.1%) had stroke recurrence. The results of a multivariate analysis of the association between IABD and END using clinical models (models 1 and 2) are presented in Table 2. In model 3, the multivariate analysis controlled for sex, age, and the factors that were significant (p<0.1) in the univariate analysis: smoking, coronary artery disease, prior stain use, left ventricular hypertrophy, NIHSS score, cerebral atherosclerosis, HGWMHs, thrombolytic therapy, white blood cell count, and brachial-ankle pulse wave velocity. This model demonstrated that IASBD ≥10 mm Hg was significantly related to END (OR=1.75, 95% CI=1.02–3.01, p=0.041). The probability of END increased significantly when IASBD increased by 1 mm Hg (OR=1.04, 95% CI=1.01–1.08, p=0.025). IADBD ≥10 mm Hg was also significantly associated with END (OR=3.11, 95% CI=1.61–5.99, p=0.001), and an IADBD increase of 1 mm Hg significantly increased the probability of ICAS (OR=1.10, 95% CI=1.05–1.15, p=0.001). Patients who had both IASBD ≥10 mm Hg and IADBD ≥10 mm Hg tended to have END (OR=2.19, 95% CI=0.91–5.26, p=0.079). Fig. 1 illustrates the estimated probability of END according to IASBD and IADBD as continuous variables, which indicates that the association of both IASBD and IADBD with END can be detected by simple visual inspection.
Association of IABD with END in subgroup populations
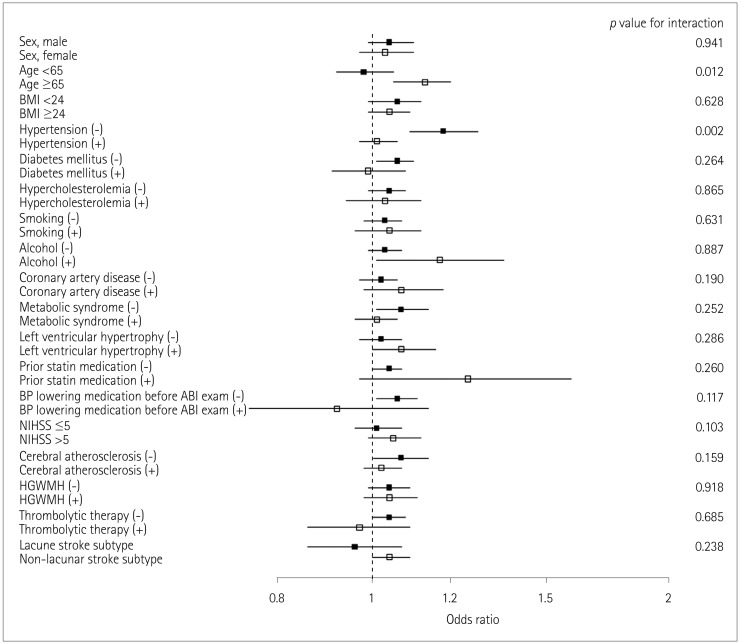
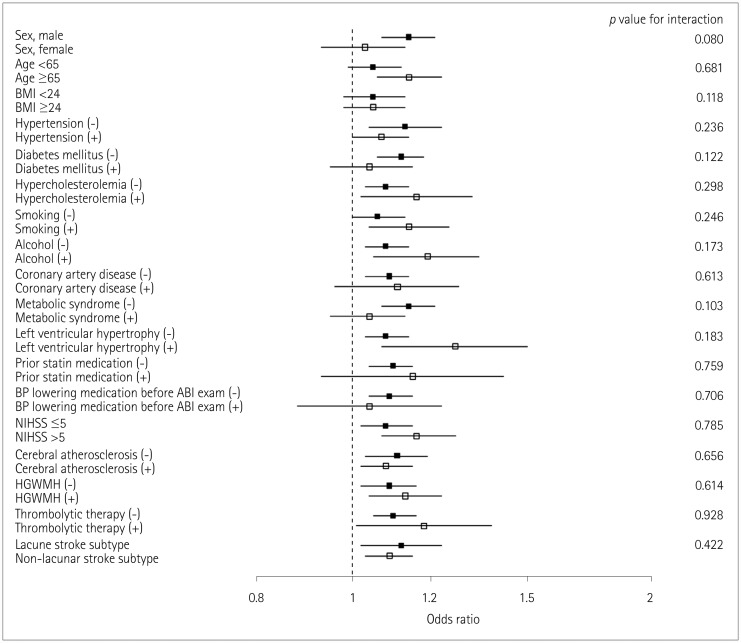
For the association of IABD with END, no subgroups had significant differences except IASBD for those aged 65 years or older having a history of hypertension (Figs. 2 and 3). A 1-mm Hg increase in IASBD was not associated with END in patients younger than 65 years (OR=0.98, 95% CI=0.92–1.05) or those with hypertension (OR=1.01, 95% CI=0.97–1.06). However, a 1-mm Hg increase in IASBD was associated with END in patients aged 65 years or older (OR=1.13, 95% CI=1.05–1.20) and those without hypertension (OR=1.18, 95% CI=1.09–1.28) (p for interaction=0.012 and 0.002, respectively).
Association between IABD and stroke outcome
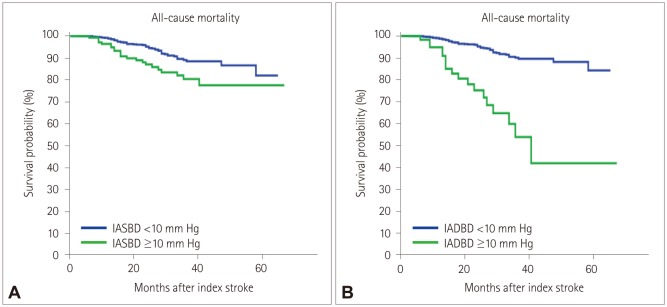
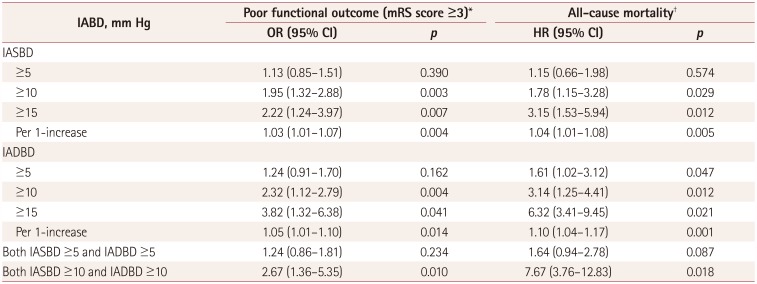
The association between IABD and stroke outcome based on the mRS score at 3 months after the index stroke was investigated in 92.2% patients (929/1,008). The functional outcome was poor in 23.1% of the patients (215/929). Regarding mortality, 71 patients (7.0%) died during a median follow-up of 24 months (interquartile range=15–37 months). IASBD ≥10 mm Hg and IADBD ≥10 mm Hg were independently associated with a poor functional outcome (OR=1.95, 95% CI=1.32–2.88, p=0.003; and OR=2.32, 95% CI=1.12–2.79, p=0.004; respectively) after adjusting for sex, age, hypertension, metabolic syndrome, thrombolytic therapy, END, NIHSS score, stroke subtype, cerebral atherosclerosis, HGWMHs, and brachial-ankle pulse wave velocity (Table 3). The Kaplan-Meier curve demonstrated that the occurrence of mortality was significantly affected by both IASBD ≥10 mm Hg (p=0.001) and IADBD ≥10 mm Hg (p=0.001) (Fig. 4). IASBD ≥10 mm Hg and IADBD ≥10 mm Hg were also related to mortality [hazard ratio (HR)=1.78, 95% CI=1.15–3.28, p=0.029; and HR=3.14, 95% CI=1.25–4.41, p=0.012; respectively) after adjusting for sex, age, hypertension, diabetes mellitus, metabolic syndrome, thrombolytic therapy, END, NIHSS score, stroke subtype, cerebral atherosclerosis, HGWMHs, and brachial-ankle pulse wave velocity (Table 3). Furthermore, the associations of IABD with END, poor functional outcome, and mortality were consistent after including the cardioembolic stroke subtype (Supplementary Table 2 and 3 in the online-only Data Supplement).
Predictability of IABD for END, poor functional outcome, and mortality
In terms of the predictability of IABD for END, an increase in IASBD of 1 mm Hg increased the continuous net reclassification improvement and integrated discrimination improvement by 0.015 (p=0.012) and 0.187 (p=0.001), respectively; the corresponding values for an increase in IADBD of 1 mm Hg were 0.030 (p=0.001) and 0.280 (p=0.001).
In terms of the predictability of IABD for a poor functional outcome at 3 months after the index stroke, an increase in IASBD of 1 mm Hg increased the continuous net reclassification improvement and integrated discrimination improvement by 0.073 (p=0.009) and 0.195 (p=0.001), respectively; the corresponding values for an increase in IADBD of 1 mm Hg were 0.032 (p=0.003) and 0.276 (p=0.001).
In terms of the predictability of IABD for mortality, an increase in IASBD of 1 mm Hg increased the continuous net reclassification improvement and integrated discrimination improvement by 0.104 (p=0.032) and 0.192 (p=0.002), respectively; the corresponding values for an increase in IADBD of 1 mm Hg were 0.142 (p=0.001) and 0.232 (p=0.015).
DISCUSSION
The key findings of our study are that IASBD ≥10 mm Hg and IADBD ≥10 mm Hg were associated with END, poor functional outcome, and mortality even after adjusting for stroke severity (NIHSS score), thrombolysis, and brachial-ankle pulse wave velocity, which were closely related to the stroke prognosis. These associations were consistent whether IABD was examined as a binary or continuous variable. Our findings further suggest that IASBD and IADBD are of additional benefit in predicting the occurrence of the END, poor shortterm functional outcome, and mortality.
IABD is independently associated with all-cause mortality and cardiovascular mortality,26 including in cohorts without known cardiovascular disease.27 Moreover, previous studies involving elderly hypertensive patients have found the risks of cardiovascular disease and mortality to be relatively high in patients with IASBD ≥10 mm Hg.28 A cohort study of medicines at a renal clinic found that increased IASBD was related to an increased risk of mortality.29 On the other hand, the Framingham Heart Study found that increased IABD was not associated with mortality despite the risk of cardiovascular disease being increased in a long-term follow-up of 3,390 patients without a history of cardiovascular disease.30
Few previous studies have investigated IABD and stroke outcomes. Previous studies of acute ischemic stroke have found both IASBD and IADBD to be associated with longterm mortality.9 Cerebral artery stenosis (which is closely related to recurrent stroke), stroke progression, and END were found to be independently associated with IABD in patients with noncardioembolic stroke.31 Our findings support the results of these previous studies; moreover, because END could produce a poor long-term prognosis in stroke patients, our results may provide additional evidence for the association between IABD and a poor long-term prognosis. Our study further suggests that bilateral brachial blood pressure measurements provide an easy screening tool for estimating the probability of END in acute noncardioembolic stroke patients.
We found that IASBD ≥5 mm Hg was not significantly associated with END, whereas IASBD ≥5 mm Hg was previously found to be associated with the presence of peripheral arterial disease and cardiovascular mortality in patients taking aspirin for asymptomatic atherosclerosis, and was also related to multiorgan damage in patients with type 2 diabetes mellitus.732 These differences from our results may be due to differences in the sample sizes, demographic characteristics, risk factors, study populations, or methods. In contrast, IADBD ≥5 mm Hg was independently related to END in our study, whereas a study of patients with type 2 diabetes mellitus found that IADBD was not associated with end-organ damage.32 Since IADBD may vary across each measurements and differences between IASBD and IADBD may not be large (the mean difference was less than 3 mm Hg in our study), caution is needed when interpreting the relationship between IADBD and END.
Our subgroup analysis showed that increased IASBD was associated with being aged 65 years or older and not having hypertension, but not with being younger than 65 years or not having a history of hypertension. We were unable to develop any appropriate hypotheses for explaining these results. In patients with noncardioembolic stroke younger than 65 years or with a history of hypertension, factors other than IASBD may affect END. Additional research is needed to understand these results.
In our study, having both IASBD ≥10 mm Hg and IADBD ≥10 mm Hg was associated with a poor functional outcome at 3 months after the index stroke and also with mortality. Previous studies involving stroke patients have found both IASBD ≥10 mm Hg and IADBD ≥10 mm Hg to be related to all-cause mortality and cardiovascular mortality.9 A previous meta-analysis found that IASBD ≥15 mm Hg was associated with increased risks of cardiovascular mortality and all-cause mortality.26 Our study supports these previous studies and suggests the new information that IABD ≥10 mm Hg is associated with a poor short-term functional outcome in stroke patients. Considering our findings and previous studies, IABD ≥10 mm Hg could be a useful indicator for the risks of poor functional outcome and mortality.
Several mechanisms could be hypothesized for explaining the relationships of IABD with the occurrence of END, poor functional outcome, and mortality. A large IABD was found to be related to progressed atherosclerosis and stenosis of the aorta and its large branches.10 Thus, large differences in blood pressure may reduce the blood flow and the perfusion of brain tissue,33 with this hemodynamic dysfunction or hypoperfusion possibly playing a role in END and a poor prognosis.34 Furthermore, progressed systemic atherosclerosis is related to early mortality in stroke patients.11 Also, a previous study revealed that IADBD due to ischemia in one arm was associated with flow-mediated dilatation in the arm, which is an index of endothelial dysfunction or injury.35 Another study found that an elevated plasma level of 20-hydroxyeicosatetraenoic acid, which is a biomarker for endothelial dysfunction, was related to END in acute ischemic stroke.36
Increased arterial stiffness could also explain our results. A population-based study found that large IABDs were related to arterial stiffness.37 Another study found that the brachial-ankle pulse wave velocity was higher in patients with IABD ≥10 mm Hg than in those with IABD <10 mm Hg.8 Arterial stiffness as indicated by the baPWV is independently associated with END, poor functional outcome, and mortality in patients with acute cerebral infarction.383940
This study was subject to some limitations. Although consecutive patients were included and ABI was routinely performed, selection bias might have been present due to the retrospective design of the study. Even though an adjusted stroke severity scale (NIHSS) was used, spasticity or flaccidity of the muscle or muscle tone—which could affect IABD—was not evaluated. Making accurate automatic, simultaneous, and multiple IABD measurements is recommended. Although the measurements were made in this study simultaneously with an automatic device, the consistency of the measurements is difficult to determine because IABD was measured once only.
In conclusions, this study has demonstrated that IASBD ≥10 mm Hg and IADBD ≥10 mm Hg are independently associated with END, poor functional outcome, and mortality. The findings suggest that IABD ≥10 mm Hg could be a useful indicator for the risks of END, poor functional outcome, and mortality.
 XML Download