

 PDF
PDF ePub
ePub Citation
 Print
Print


Cytogenetic dosimetry is an important technology for estimating the ionizing radiation dose absorbed by an individual and is based on chromosomal damage following chronic or acute exposure [123]. In Korea, cytogenetic dosimetry has been used by a few national centers, such as the Korea Institute of Radiological & Medical Sciences (KIRAMS) and the Radiation Health Institute (RHI), to provide a dose assessment for individuals employed in the nuclear power industry and to prepare for potential exposure via radiation emergency [45]. However, very few clinical laboratories have been equipped to provide biodosimetry services.
Of the several available cytogenetic dosimetry techniques, a dicentric chromosome (DC) assay and FISH translocation (TR) assay have recently been approved as new health technologies by the committee for New Health Technology Assessment (nHTA) pursuant to the Medical Services Act of August 2016 [6]. The main objective of cytogenetic dosimetry is to assess the irradiated dose reflecting the damage caused by ionizing radiation and to recommend appropriate treatment for exposed patients [78]. However, there are some challenges in disseminating these new practices in most clinical laboratories in Korea: (1) lack of adequate radiation generators, (2) unavailability of reference standards reflecting in vivo responses, (3) difficulties in achieving sample irradiation with a target dose, and (4) a complicated statistical analysis for correct calibration curve-fitting procedure [29].
We constructed in vitro dose-response calibration curves for DC and TR induced by X-ray irradiation generated with an electron linear accelerator (LINAC), which is the most frequently used medical device in external beam radiotherapy [910]. We irradiated samples from four healthy Korean individuals and compared the resultant curves between individuals.
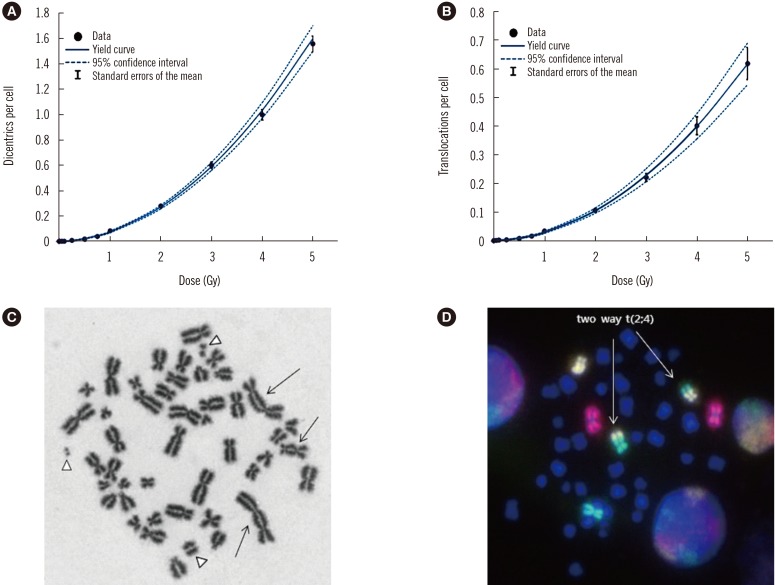
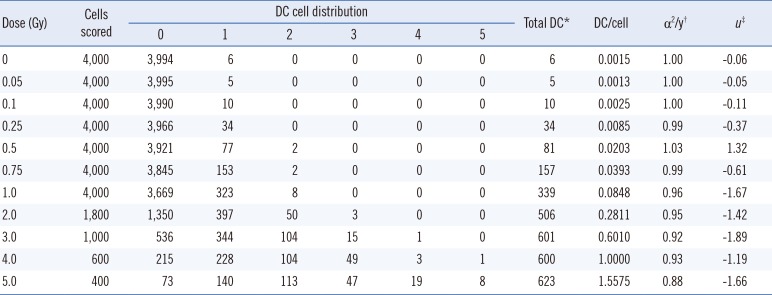
After obtaining informed consent, heparinized peripheral blood samples were collected from two males (36 and 22 years) and two females (28 and 24 years) in a tertiary-care hospital in Bucheon, Korea. Since chromosomal aberrations are known to be affected by factors such as age, sex, and smoking status [2], we chose study participants considering these factors. None had a history of smoking, and they had never been subjected to radiotherapy or chemotherapy. The samples were aliquoted into 11 separate tubes (one control and 10 for acute single exposure to doses of 0.05, 0.1, 0.25, 0.5, 0.75, 1, 2, 3, 4, and 5 Gy). X-rays were generated using a 6MV LINAC (Siemens, Concord, CA, USA) at a dose rate of 0.5 Gy/min. The samples were placed at the center of a 20×20 cm radiation field at a source-sample distance of 100 cm. Following irradiation, lymphocyte culture, harvesting, staining, and scoring processes were performed according to the guidelines of the International Atomic Energy Agency (IAEA) [2]. Briefly, 1 mL blood from each dose-point was cultured for 48 hrs in a culture tube containing 9 mL of medium (RPMI-1640). Next, 80 µL of colcemid (10 µg/mL) were added to 10 mL of each culture (final concentration, 0.08 µg/mL) during the final 24 hours of the culture period. Following hypotonic treatment with 0.075 M KCl, the cells were fixed in a 3:1 methanol-acetic acid solution. The cells were prepared on a slide, stained with Giemsa, and the number of DCs was scored per 1,000 metaphases. Once more than 100 DCs were identified in samples above the 2 Gy dose-point, analysis was stopped, and the proportion per scored cells was calculated.
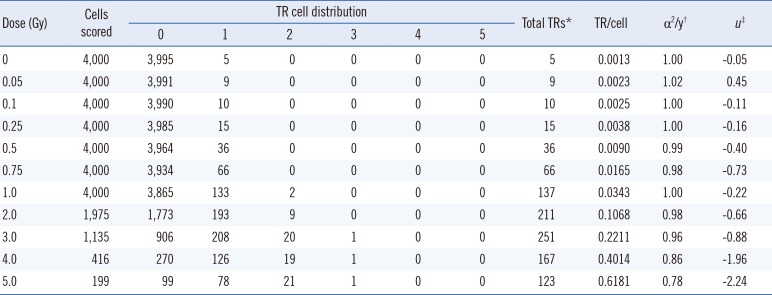
For the TR assay, samples were processed as described above, and metaphases were prepared on a slide using the same protocol described for the DC assay. Two slides were prepared for each sample, and the TR assay was carried out with a mixture of commercially available fluorophore-labeled probes (chromosome 1, red; chromosome 2, green; chromosome 4, yellow; Metasystems, Altlussheim, Germany). The number of TRs was scored per 1,000 metaphases. The detailed scoring rules for exchange-type aberration were as follows: (1) only stable cells were counted, (2) TR between three chromosomes was scored as two TR equivalents, (3) inversion or insertion was scored as one TR equivalent, and (4) deletions were not included in the analyses.
Metaphases were captured using the Metafer Image Analysis System (Metasystems). Two investigators independently interpreted the DC and TR results. Discordant interpretations were reanalyzed in several ways, including comparison of images and a final review by a third experienced investigator in the cytogenetic laboratory.
Statistical analysis of the data used to generate the dose-response curves was conducted using R version 2.10.1 (R Foundation for Statistical Computing, Vienna, Austria) and the analysis scripts as mentioned in the IAEA guidelines [2]. To determine whether the DC or TR frequency followed a Poisson distribution as expected for X-ray irradiation, the dispersion index (α2/y) and the normalized unit of this index (u) were obtained for each dose. Pearson's correlation was calculated between the delivered dose and chromosomal aberration frequency. P<0.05 was considered statistically significant.
Following in vitro irradiation, a total of 31,800 and 31,725 metaphases were analyzed for DC and TR, respectively. The average mitotic index was 24%, based on the equation described in the IAEA guidelines [2]. The DC and TR frequencies obtained following exposure to 11 different radiation doses are shown in Tables 1 and 2, respectively. The number of DC or TR increased with increasing radiation dose. The distribution of DC followed a Poisson distribution at all doses, whereas TR showed overdispersion at the 5 Gy dose point (Table 2). The DC or TR yield was fitted using a linear-quadratic model represented by the following equation: Y=C+αD+βD2, where Y is the DC or TR frequency yield, D is the absorbed dose in Gy, β is the corresponding quadratic coefficient, α is the linear coefficient, and C is the background frequency. Dose-response curves for DC and TR induction were derived as follows: Y=(0.0011±0.0004)+(0.0119±0.0032)D+(0.0617±0.0019)D2 for DC, and Y=(0.0015±0.0004) +(0.0048±0.0024)D+(0.0237±0.0014)D2 for TR (Fig. 1). The correlation coefficient (r) was 0.971 for DC and 0.6 for TR, indicating very strong and moderate correlations, respectively, between the fitted data points [11]. The goodness of fit test for DC induction (chi-squared [χ2]=12.76, degrees of freedom=8, P<0.05) and TR induction (χ2=4.76, degrees of freedom=8, P<0.05) indicated that the data fit well with the linear-quadratic model.
Unlike physical measurements routinely conducted for individuals with occupational exposure, most people who are exposed during radiation emergencies do not carry personal dosimeters [7]. Therefore, biological dosimetry using chromosome damage is important not only to determine whether individuals have been over-exposed to radiation but also to consider individual differences in susceptibility [2].
We present two types of dose-response curves compatible with two methods: a DC assay for assessing the acute phase within two months of exposure [7] and chromosome painting TR analysis using three probes (one each for chromosome pairs 1, 2, and 4), which can estimate a radiation exposure dose received several years earlier [12]. A previous Japanese study demonstrated considerable variation between individuals in the frequency of chromosomal aberrations formed, especially at low doses of ≤1 Gy [13]. We included a total of seven points below 1 Gy in our study (0, 0.05, 0.1, 0.25, 0.5, 0.75, and 1); however, no significant inter-individual differences were observed in DC and TR frequency at these doses (See Supplemental Data Tables S1 and S2). In contrast, significant differences in DC frequency were observed at doses of 3 and 4 Gy (See Supplemental Data Table S1). These variances are likely due to confounding individual factors such as age, smoking, and polymorphisms in DNA repair genes [8]. Thus, it is important to analyze a sufficient number of cells to reduce the influence of these factors; a number between 3,000 and 5,000 per point is suggested by the IAEA guidelines [2]. A limitation of this study is that it has not been performed on subjects of various ages.
Laboratories should have their own dose-response curves to avoid inter-laboratory variations [28] as several factors are known to impact the resulting dose-response curves, including the intrinsic environmental conditions in each laboratory, choice of reagents, technical procedures and equipment, scoring criteria, and the subjective nature of microscopic identification of chromosome aberrations [914].
In order to approximate in vitro-generated calibration curves as close as possible to in vivo responses, it is important to generate the curves using a wide range of potentially absorbed doses that represent the majority of accidental human exposure to ionizing radiation (0.1 to 5 Gy) [29]. Since most radiological incidents involve overexposure to gamma-radiation or X-rays [2415], curves for these two radiation sources should be preferentially established. In Korea, most dosimetry laboratories use 60Co as a radiation source for dosimetry calibration curves [5]. We used X-rays generated by electron LINACs, and this curve could aid in assessing workers' radiation doses, radiation emergencies, and in vitro dose reconstruction for medical accidents caused by X-rays. This is the first study implementing cytogenetic dosimetry following exposure to ionizing X-radiation.
 XML Download